Maritimes Region Science Advisory Report 2011/040
July 2011
MUSQUASH ESTUARY: A PROPOSED MONITORING
FRAMEWORK FOR THE MARINE PROTECTED AREA AND
INTERTIDAL AREA ADMINISTERED BY
FISHERIES AND OCEANS CANADA
Tributary of the Musquash Estuary, New Brunswick (courtesy of: David Thompson, Conservation Council of New Brunswick and Fundy Baykeeper).
Figure 1. The Musquash Estuary Marine Protected Area (MPA) and Administered Intertidal Area (AIA) managed by Fisheries and Oceans Canada.
Context:
In support of the Health of the Oceans Initiative, Fisheries and Oceans Canada (DFO) Science is to provide advice on indicators, strategies, and protocols for monitoring the individual conservation objectives of Marine Protected Areas (MPAs) established pursuant to the Oceans Act. Monitoring of biological, chemical, physical, and ecological indicators (and related threats) is necessary for: A) incorporation into broader MPA monitoring ‘plans’ or ‘programs’; B) tracking status, condition, and trends to determine if MPAs are effective in achieving the conservation objectives; C) aiding managers in the adjustment of MPA management plans to achieve the conservation objectives; and D) reporting to Parliament and Canadians. The selection of indicators as well as the strategies and protocols for the collection and analysis of monitoring data must be scientifically defensible.
The Musquash Estuary is located in southwest New Brunswick (Figure 1). It supports rich and productive habitat for many species of invertebrates, fish, and wildlife, as well as several different marine plants. On December 14, 2006, the lands and waters in the Musquash Estuary up to mean low water were designated a Marine Protected Area (MPA) through regulations pursuant to Canada’s Oceans Act. The Oceans Act, however, does not apply to the lands and waters above mean low water and, as a result, the Musquash Estuary MPA Regulations do not apply to the intertidal area administered by DFO (Figure 1). Activities in the Administered Intertidal Area (AIA) are managed pursuant to the Fisheries Act and Federal
Real Property and Federal Immovables Act. A draft management plan for the Musquash Estuary MPA and AIA identifies research and monitoring as actions required to advising effective management of the protected area.
Research and monitoring activities have, and continue to be, undertaken in the Musquash Estuary, although no systematic monitoring has been undertaken to focus on the evaluation of the MPA and AIA ecosystem and its conservation objectives. To inform development of a systematic monitoring plan, it is necessary to propose a suite of monitoring indicators, strategies, and protocols that can be used to address the conservation objectives of the MPA and AIA in a cost-effective manner, while incorporating existing monitoring programs and their indicators, strategies, and protocols, where appropriate. The monitoring indicators, strategies, and protocols that have been proposed in this framework may be refined or dropped and others added, as further baseline knowledge of the estuary is developed. The proposed indicators, strategies, and protocols are not intended to address non-biological aspects of monitoring (e.g. social, economic, or historical), with the exception of the threats presented by human activities that are consistent with the Musquash Estuary MPA Regulations.
A Maritimes Region Science Advisory Process was conducted on December 9-10, 2010, to review a range of proposed indicators, strategies, and protocols for monitoring the Musquash Estuary. The scope of the framework and discussion was on proposed indicators, strategies, and protocols for monitoring the estuary as a whole, and was not limited to the MPA and AIA boundaries. The implementation of monitoring, however, may not be undertaken on the scale of the estuary, and this is to be determined at a later date dependent on factors such as partnerships and availability of resources, to name a few. The results of the advisory meeting have been published in this CSA Science Advisory Report, which reached consensus on February 4, 2011. A CSA Research Document, and meeting CSA Proceedings will also be published, and can be found on the national CSA website as they become available: www.dfo-mpo.gc.ca/csas-sccs/index-eng.htm
SUMMARY
The scope of the Science Advisory Report is on proposed indicators, strategies, and
protocols for monitoring the Musquash Estuary, and is not limited to the Marine Protected Area (MPA) and Administered Intertidal Area (AIA) boundaries. The implementation of monitoring, however, may not be undertaken on the scale of the estuary, and this is to be determined at a later date dependent on factors such as partnerships and availability of resources, to name a few.
Fifteen indicators have been proposed to monitor the conservation objectives that have been established for managing the MPA and AIA. A range of strategies and protocols have also been proposed to monitor each of the identified indicators. The proposed strategies and protocols are either currently underway in the estuary or may reasonably be implemented at this time.
A lack of baseline data exists for many aspects of the Musquash Estuary ecosystem, thus, the proposed indicators are general guidelines (i.e. not detailed), with the range of monitoring strategies and protocols being proposed as a first step to evaluating the indicators in tandem with improving the baseline knowledge. As baseline information improves and the proposed strategies and protocols are implemented, tested, and evaluated some of the indicators may be refined or dropped and others added, as appropriate. This may help reduce the sources of uncertainty that currently surround understanding of the functioning of the estuary and the likelihood and impact that human activities may have (or be having) on the ecosystem.
Threats in Musquash Estuary may arise from proposed human activities not only in the MPA and AIA, but also from activities outside of the MPA and AIA. As such, activities proposed for
neighbouring lands, in the greater Musquash watershed, and adjacent coastal areas of the Bay of Fundy may also need to be evaluated for their zone of influence and perceived threats to the MPA and AIA prior to their approval.
Discussion of the specific threats to the structure and function of the Musquash Estuary ecosystem was not the focus of the meeting, although it was recognized that monitoring the threats is key to understanding potential impacts to the ecosystem. Such threats have been identified and discussed at previous workshops (e.g. Rangeley and Singh, 2000; Singh and Buzeta, 2007; Davies et al., 2008).
Recommendations on potential monitoring indicators and appropriate protocols and
strategies for the Musquash Estuary are proposed. In addition, governance and data management for effective monitoring are considered, but are discussed in more detail in the CSA Research Document that accompanies this CSA Science Advisory Report.
BACKGROUND
Rationale for Assessment
In support of the Health of the Oceans Initiative, the Science Branch of Fisheries and Oceans Canada (DFO) was asked to propose scientifically-defensible indicators, strategies, and protocols for monitoring the conservation objectives of established MPAs that have been designated pursuant to Canada’s Oceans Act.
Monitoring of biological, chemical, physical, and ecological indicators (and related threats) is necessary for:
A. incorporation into broader MPA monitoring ‘plans’ or ‘programs’;
B. tracking status, condition, and trends to determine if MPAs are effective in achieving their conservation objectives;
C. assisting managers in the adjustment of MPA management plans to achieve conservation objectives; and
D. reporting to Parliament and Canadians.
A great deal of work has been completed over the past decade on establishing the Musquash Estuary MPA and AIA, including the development and implementation of a management framework. An ecological overview of the Musquash Estuary undertaken by Singh et al. (2000) identified commercial and non-commercial fisheries, unique habitat, and areas of high biological diversity and productivity in the estuary. It is these valued characteristics that has given the Musquash Estuary special status as one of Canada’s MPAs. It is considered that these characteristics should be well incorporated into the MPA’s management and monitoring plans. A proposal for biological monitoring in the estuary was prepared for the Conservation Council of New Brunswick by Rangeley and Singh (2000). It provided an overview of proposed conservation goals and the need for a pilot study and baseline inventory of the estuarine ecosystem.
In response to a move toward ecosystem-based management of MPAs, DFO developed a nationally-consistent framework for establishing ecosystem objectives and indicators (Jamieson et al., 2001). This national guidance was applied in an ecosystem framework for the Musquash Estuary (Singh and Buzeta, 2007). The framework proposed monitoring indicators and strategies that would contribute to the achievement of DFO’s ecosystem objectives. The proposed monitoring indicators and strategies were examined by a group of experts to rank them and discuss appropriate protocols for their application (Davies et al., 2008).
The science advice outlined in this report proposes an ecosystem-level monitoring framework that may be implemented to identify changes in the ecological characteristics of the Musquash Estuary, with a focus on the monitoring of current activities and perceived threats in the MPA and AIA. The monitoring indicators, strategies, and protocols that have been proposed are not intended to address potential social, economic, or governance indicators and related strategies or protocols, though certain anthropogenic threats to the Musquash Estuary MPA and AIA ecosystem have been identified. The monitoring indicators, strategies, and protocols that have been recommended in this Science Advisory Report will need to be evaluated against fiscal and other considerations, and do not necessarily reflect a final monitoring plan for the MPA and AIA.
Description of the Musquash Estuary MPA and AIA
An estuary is a partially-enclosed coastal body of water with a free connection to the sea, in which freshwater from rivers and streams mix with oceanic water. The Musquash Estuary is located in the Bay of Fundy approximately 20 km southwest of Saint John, New Brunswick (Figure 1). It is unique due to its size, expansive salt marshes, and relatively undisturbed natural condition. It is the largest ecologically-intact estuary in the Bay of Fundy. It exhibits a diverse number of habitat types and related biological communities (Singh et al., 2000). Refer to Singh et al. (2000) for a more complete ecological overview of the Musquash Estuary.
The Musquash Estuary is comprised of a large embayment with a relatively narrow and deep entrance between the two rocky headlands of Western Head and Musquash Head (Hunter and Associates, 1982; Singh et al., 2000). The Musquash River flows into the shallow Musquash Harbour. The estuary drains the Musquash River and adjacent salt marshes. Musquash Estuary is a shallow, tidal estuarine ecosystem. It exhibits water depths of 1-6 m and a tidal range of 6-8 m (Wildish, 1977; Gratto, 1986). Musquash Harbour is highly turbid (i.e. muddy) due to the resuspension of bottom sediment associated with strong tidal currents (Singh et al., 2000). Suspended sediment in the estuary is discharged into the Bay of Fundy during the ebb tide and transported further upstream during the flood tide (Singh et al., 2000).
Freshwater discharge into the estuary passes through a small, deactivated electric dam in the Musquash River and from several small creeks. Salinity in Musquash Harbour varies depending on the balance between freshwater inputs and seawater from the Bay of Fundy. Water in the estuary is vertically well mixed between the surface and bottom (Kristmanson, 1974; Singh et al., 2000). The estuary’s location, shape, and oceanographic characteristics support diverse habitat and high biological productivity. Characteristic of the Musquash Estuary is an abundance of wildlife including phytoplankton and zooplankton, invertebrates, salt marsh plants, fish, and many rare bird species (Singh et al., 2000).
Conservation Objectives
Conservation objectives for the Musquash Estuary MPA and AIA are to ensure that there is no unacceptable reduction or human-caused modification in:
Productivity so that each component (primary, community, population) can play its role in the functioning of the ecosystem by maintaining abundance and health of harvested species;
Biodiversity by maintaining the diversity of individual species, communities, and populations within the different ecotypes; and
Habitat in order to safeguard the physical and chemical properties of the ecosystem by maintaining water and sediment quality.
Identification of Current and Potential Threats to the Ecosystem
A fundamental component to designing, implementing, and reviewing a monitoring plan is to establish a clear justification for acquiring information (McDonald-Madden et al., 2010). This justification is built around both the conservation objectives, as well as identifying the threats and management options for the MPA and AIA. The Musquash Estuary MPA and AIA is divided into four management zones: Zones 1, 2 and 3 of the MPA and, the forth zone, the AIA (Figure 1). In these zones, various activities in the area may be generally permitted, restricted, or require pre-approval. For every managed activity, the perceived threat to the conservation objectives should be identified. Listed below are managed activities in the MPA and AIA (DFO, 2008), including an example of how these activities could be monitored:
Recreational activities are allowed throughout the MPA and AIA (e.g. swimming, sailing, scuba diving) provided that they do not disturb, damage, destroy, or remove any living marine organism, or any part of its habitat.
The amount of recreational activity could be monitored as a periodic survey of recreational community use and perceived value in maintaining the MPA and AIA for continued enjoyment.
Marine vessels are not allowed in Zone 1, but are allowed in Zone 2 at a maximum speed of 5 knots and in Zone 3 at a maximum speed of 8 knots.
Vessel traffic (number, speed, and location) could be monitored via remote video cameras, or some other vessel activity surveillance methods such as mandatory VHF hail-in.
All-terrain vehicles are not allowed in the MPA and AIA.
Conservation and protection programs should keep a record (time and location) of illegal ATV activity observed in the MPA and AIA.
Aboriginal fishing is allowed throughout the MPA and AIA provided that it is carried out in accordance with the Aboriginal Communal Fishing Licences Regulations.
Periodic survey of aboriginal community on their perceived value and effectiveness of the MPA and AIA and how it facilitates fishing in accordance with the Aboriginal Fishing Licenses Regulations.
Recreational fishing for scallop and clams by manual means, and recreational fishing for any other species by means of angling or a dip net is allowed throughout the MPA and AIA provided that it is in accordance with the Atlantic Fisheries Regulations 1985, or the Maritimes Provinces Fishery Regulations.
Records of some recreational fishing activities are already required for license holders and should be incorporated into the MPA and AIA data management structure on an annual basis. Should consider change in policy to require a license for all recreational fishing in the MPA and AIA.
Recreational harvesting of dulse by manual means is allowed in Zones 2 and 3 of the MPA and AIA.
Records of recreational harvesting of dulse should be incorporated into the MPA and AIA data management structure.
Certain activities such as commercial fishing and commercial dulse harvesting, scientific and archaeological studies, educational and tourism trips, and habitat restoration
initiatives are also allowed, but may require a license or need to be approved by Fisheries and Oceans Canada.
Records of all licensed or approved activities should be incorporated into the MPA and AIA data management structure. The degree to which these activities could impact the MPA and AIA must be monitored.
In Musquash Estuary, threats may arise from proposed activities not only in the MPA and AIA, but also from activities outside of the MPA and AIA. As such, activities proposed for neighbouring lands, in the greater Musquash watershed, and in the adjacent coastal areas of the Bay of Fundy may also need to be evaluated for their zone of influence and perceived threats to the MPA and AIA prior to their approval. New or emerging threats to the conservation objectives of the MPA and AIA must be regularly identified and given consideration for need of additional monitoring and assessment. Development of monitoring indicators, strategies, and protocols to address new or emerging threats may be required. In addition, the Musquash Estuary is small and, as a result, outside events that happen quickly may cause large changes to the MPA and AIA ecosystem over a short time period (e.g. increased freshwater runoff may decrease salinity in the MPA). This too may require indicators, protocols, and strategies that support event-based monitoring.
Previous discussions of the potential threats to Musquash Estuary have occurred, which included a discussion of threats to the estuary beyond those identified above, (refer to Table 2 in Singh and Buzeta, 2007). A discussion of all threats to the Musquash Estuary did not occur at this Science Advisory Meeting, although the following recommendations were discussed and are proposed, to ensure that current and potential threats to the Musquash Estuary ecosystem are identified in a systematic and timely manner:
plan for a regular review of managed activities, zones of influence, and perceived threats to the estuarine ecosystem;
link the identified threats to the ecosystem to proposed indicators;
indicators in the proposed monitoring framework should be considered and prioritized in terms of greatest threats, management needs, and/or science needs (e.g. resolving existing data gaps) in the development of a monitoring plan;
acquire data on managed activities (e.g. fishery landings, commercial recreational harvest, vessel traffic, and scientific activity requests) on time scales and periodicity that are compatible with environmental data;
develop and implement a data management structure that facilitates use of information from multiple disciplines including management; and
analyze and assess managed activities as part of a periodic assessment cycle.
ASSESSMENT
Monitoring Indicators, Strategies, and Protocols
Priority ecological indicators for each ecosystem component were suggested by Davies et al. (2008) and have been used to form the basis of this monitoring framework. The priority ecological indicators include:
essential nutrient concentrations, water turbidity, phytoplankton concentration, and number of juvenile fish and bird hatchlings (Productivity);
estimates of species and abundance in each trophic level, where appropriate, including the abundance of keystone/dominant species (Biodiversity); and
historical and present physical features influencing the hydrodynamics of the estuary
(Habitat).
Davies et al. (2008) indicated that in order to carry out an effective monitoring program, there is a need for:
baselines for the indicators of the valued ecosystem components;
an understanding of potential ecosystem impacts from human activities (i.e. threats), the zone of influence, and subsequent relationships (or at least the connection) between the activity and the ecosystem indicators; and
an understanding of the “natural” spatial and temporal variability of the indicator, which is usually determined through comprehensive, long-term monitoring.
At present, a lack of baseline data exists for many aspects of the Musquash Estuary ecosystem, thus, indicators remain broad, with a range of monitoring strategies and protocols being proposed as a first step to evaluating the indicators. As baseline information improves and the proposed strategies and protocols are implemented, tested, and evaluated some indicators may be dropped and others may be added, as appropriate (Table 1). The monitoring framework provides examples of existing monitoring protocols that are currently being undertaken in the MPA and AIA or have been proposed as protocols that may reasonably be implemented at this time (Table 2).
Improving the understanding of the structure and functioning of the Musquash Estuary ecosystem is essential to establishing meaningful baseline reference points. Continued scientific investigation to improve understanding of the ecosystem structure and function is
recommended. In the absence of defensible scientific data, the default reference point for all indicators should be a statistically significant deviation from baseline variability. This emphasizes the importance of establishing valid baseline information that captures natural spatial and temporal variability. In order to track progress toward implementation of the proposed ecosystem-level monitoring framework, the linkage between the conservation objectives, indicators, reference points, monitoring strategies, and protocols should be identified and periodically evaluated against managed and perceived threats to the ecosystem.
Table 1. Linkages between conservation objectives and proposed indicators, reference points, monitoring strategies, and monitoring frequencies. An alpha-numeric designation has been assigned for each indicator based on its conservation objective (P–productivity, B–biodiversity, H–habitat). The designations are used to link monitoring strategies and protocols with the general objectives and indicators that are listed in this table.
Conservation Objectives Indicator Reference Point Monitoring Strategy Monitoring Frequency Productivity so that each
component (primary, community, population) can play its role in the functioning of the ecosystem by maintaining abundance and health of harvested species
Total biomass and spatial distribution of species in each trophic level within each ecotype (P1)
To be determined through baseline measurement
Survey of species within each ecotype through standardized per area sampling such as transect or quadrats
To be determined
Abundance of juvenile fish within the estuary (P2)
To be determined through baseline measurement
Survey of juvenile fish species in the estuary using beach seines and/or fyke nets
To be determined
Phytoplankton concentration within
the estuary (P3)
To be determined through baseline measurement
Survey of phytoplankton concentration within the estuary, including chlorophyll-a
To be determined
Commercial and recreational fishery landings (P4)
To be determined through baseline measurement
Survey of landings by fishery and species that occur in and adjacent to the MPA, if available (note: data must be at appropriate resolution to assess landings in and adjacent to the Musquash Estuary)
Annual review
Biodiversity by maintaining the diversity of individual species, communities, and populations within the different ecotypes
Number of species in each trophic level within each ecotype, and the abundance of keystone and/or dominant species (B1)
To be determined through baseline measurement
Survey of species within each ecotype through standardized per area sampling such as transect or quadrats (visual surveys where applicable)
To be determined
Number of exotic species within each ecotype, relative to exotic species in region (B2)
To be determined through baseline measurement
Survey of exotic species within each ecotype, and estimate of exotic species in region through standardized per area sampling such as transect or quadrats (visual surveys where applicable)
To be determined
Number of species at risk within each ecotype (B3)
To be determined through baseline measurement
Survey of species within each ecotype through standardized per area sampling such as transect or quadrats (visual surveys where applicable)
To be determined
By-catch number, size, age, and sex per impacted species (B4)
To be determined through baseline measurement and review of historical fishery records, if available (note: data must be at appropriate resolution to assess landings in and adjacent to the Musquash Estuary)
Survey of by-catch number, size, age, and sex of captured individuals per fishery
Table 1. Cont’d
Conservation Objectives Indicator Reference Point Monitoring Strategy Monitoring Frequency Habitat in order to safeguard the
physical and chemical properties of the ecosystem by maintaining water and sediment quality
Total area and location of each ecotype within the estuary, and the proportion and frequency that it is disturbed or lost (H1)
To be determined through baseline measurement
Map area distribution of each ecotype within the estuary using aerial photographs and GIS software
To be determined
Total area and location within estuary of species that provide biogenic structure (e.g. marsh and rockweed) (H2)
To be determined through baseline measurement
Map area distribution that supports species that provide biogenic structure
To be determined
Hydrodynamic and sediment
regime within the estuary (e.g. sediment infilling) (H3)
To be determined through baseline measurement.
Field sampling coupled with hydrodynamic and sediment models that predict the
deposition/erosion of sediment, as well as the hydrodynamic regime
To be determined
Degree of human induced habitat perturbation or loss (H4)
To be determined through baseline measurement
Survey of shoreline activities such as construction and dumping
To be determined
Temperature and salinity within the estuary (H5)
To be determined through baseline measurement and records from NB Power
Survey of temperature and salinity within estuary To be determined
Nutrient concentrations within the estuary (H6)
To be determined through baseline measurement, as well as CCME* and literature-based guideline levels
Survey of nutrient concentrations within estuary (dissolved oxygen, silicon, iron, carbon, nitrogen, and phosphorus)
To be determined
Contaminant concentrations within the estuary (H7)
To be determined through baseline measurement, as well as CCME* and literature-based guideline levels
Survey of contaminant concentrations within bottom sediment and water column (dissolved and particulate bound trace metals and organics)
To be determined
*
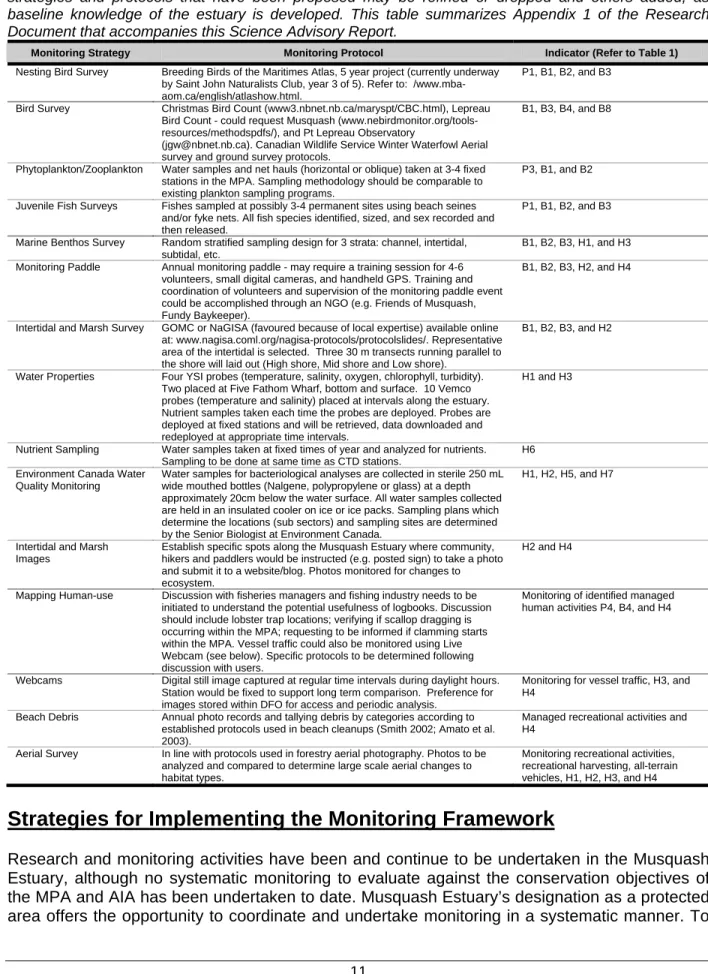
Table 2. Linkages between proposed monitoring strategies, protocols, and indicators. The alpha-numeric designations are those identified in Table 1 above (P–productivity, B–biodiversity, H–habitat). Monitoring strategies and protocols that have been proposed may be refined or dropped and others added, as baseline knowledge of the estuary is developed. This table summarizes Appendix 1 of the Research Document that accompanies this Science Advisory Report.
Monitoring Strategy Monitoring Protocol Indicator (Refer to Table 1)
Nesting Bird Survey Breeding Birds of the Maritimes Atlas, 5 year project (currently underway by Saint John Naturalists Club, year 3 of 5). Refer to: /www.mba-aom.ca/english/atlashow.html.
P1, B1, B2, and B3
Bird Survey Christmas Bird Count (www3.nbnet.nb.ca/maryspt/CBC.html), Lepreau Bird Count - could request Musquash (www.nebirdmonitor.org/tools-resources/methodspdfs/), and Pt Lepreau Observatory
(jgw@nbnet.nb.ca). Canadian Wildlife Service Winter Waterfowl Aerial survey and ground survey protocols.
B1, B3, B4, and B8
Phytoplankton/Zooplankton Water samples and net hauls (horizontal or oblique) taken at 3-4 fixed stations in the MPA. Sampling methodology should be comparable to existing plankton sampling programs.
P3, B1, and B2
Juvenile Fish Surveys Fishes sampled at possibly 3-4 permanent sites using beach seines and/or fyke nets. All fish species identified, sized, and sex recorded and then released.
P1, B1, B2, and B3
Marine Benthos Survey Random stratified sampling design for 3 strata: channel, intertidal, subtidal, etc.
B1, B2, B3, H1, and H3 Monitoring Paddle Annual monitoring paddle - may require a training session for 4-6
volunteers, small digital cameras, and handheld GPS. Training and coordination of volunteers and supervision of the monitoring paddle event could be accomplished through an NGO (e.g. Friends of Musquash, Fundy Baykeeper).
B1, B2, B3, H2, and H4
Intertidal and Marsh Survey GOMC or NaGISA (favoured because of local expertise) available online at: www.nagisa.coml.org/nagisa-protocols/protocolslides/. Representative area of the intertidal is selected. Three 30 m transects running parallel to the shore will laid out (High shore, Mid shore and Low shore).
B1, B2, B3, and H2
Water Properties Four YSI probes (temperature, salinity, oxygen, chlorophyll, turbidity). Two placed at Five Fathom Wharf, bottom and surface. 10 Vemco probes (temperature and salinity) placed at intervals along the estuary. Nutrient samples taken each time the probes are deployed. Probes are deployed at fixed stations and will be retrieved, data downloaded and redeployed at appropriate time intervals.
H1 and H3
Nutrient Sampling Water samples taken at fixed times of year and analyzed for nutrients. Sampling to be done at same time as CTD stations.
H6 Environment Canada Water
Quality Monitoring
Water samples for bacteriological analyses are collected in sterile 250 mL wide mouthed bottles (Nalgene, polypropylene or glass) at a depth approximately 20cm below the water surface. All water samples collected are held in an insulated cooler on ice or ice packs. Sampling plans which determine the locations (sub sectors) and sampling sites are determined by the Senior Biologist at Environment Canada.
H1, H2, H5, and H7
Intertidal and Marsh Images
Establish specific spots along the Musquash Estuary where community, hikers and paddlers would be instructed (e.g. posted sign) to take a photo and submit it to a website/blog. Photos monitored for changes to ecosystem.
H2 and H4
Mapping Human-use Discussion with fisheries managers and fishing industry needs to be initiated to understand the potential usefulness of logbooks. Discussion should include lobster trap locations; verifying if scallop dragging is occurring within the MPA; requesting to be informed if clamming starts within the MPA. Vessel traffic could also be monitored using Live Webcam (see below). Specific protocols to be determined following discussion with users.
Monitoring of identified managed human activities P4, B4, and H4
Webcams Digital still image captured at regular time intervals during daylight hours. Station would be fixed to support long term comparison. Preference for images stored within DFO for access and periodic analysis.
Monitoring for vessel traffic, H3, and H4
Beach Debris Annual photo records and tallying debris by categories according to established protocols used in beach cleanups (Smith 2002; Amato et al. 2003).
Managed recreational activities and H4
Aerial Survey In line with protocols used in forestry aerial photography. Photos to be analyzed and compared to determine large scale aerial changes to habitat types.
Monitoring recreational activities, recreational harvesting, all-terrain vehicles, H1, H2, H3, and H4
Strategies for Implementing the Monitoring Framework
Research and monitoring activities have been and continue to be undertaken in the Musquash Estuary, although no systematic monitoring to evaluate against the conservation objectives of the MPA and AIA has been undertaken to date. Musquash Estuary’s designation as a protected area offers the opportunity to coordinate and undertake monitoring in a systematic manner. To
implement a coordinated and systematic monitoring plan for Musquash Estuary MPA and AIA, the following strategies are recommended:
identify and maintain existing monitoring activities that address the indicators that have been discussed above;
build baseline knowledge where needed and identify knowledge gaps;
form partnerships to monitor the estuary, in order to reduce a duplication of effort;
routinely review, refine, and improve linkages between threats to the estuary and the
indicators that have been discussed above; and
implement a scientific approach to monitor both threats to the ecosystem and the natural state of the ecosystem, as proposed in the Research Document that accompanies this Science Advisory Report.
Sources of Uncertainty
Sources of uncertainty exist when attempting to understand the functioning of a complex marine ecosystem such the Musquash Estuary, as well as understanding the potential impacts that anthropogenic activities may have on an ecosystem’s natural processes and variability. In terms of monitoring the Musquash Estuary, the following sources of uncertainty currently exist:
lack of knowledge of the functioning of the Musquash Estuary ecosystem, including its
keystone and/or dominant species;
lack of knowledge of the natural variability surrounding baseline conditions;
lack of knowledge of appropriate spatial and temporal scales of monitoring protocols;
lack of statistical certainty surrounding appropriate sample sizes and frequencies of
monitoring protocols; and
lack of certainty regarding the suitability of a proposed monitoring indicator, strategy, and protocol to accurately reflect the ecosystem structure or function that it is intended to represent.
OTHER CONSIDERATIONS
A governance structure that ensures the best use of expertise, coordination between managers and science advisors, and facilitates a systematic approach to the implementation and evaluation of monitoring indicators and results in a timely manner should be considered. In addition, data management is an essential component of a successful monitoring program. Further thought may be required as to the best means of securing long-term data management, such that data accessibility and database design facilitate the sharing, assessment, and reporting of monitoring data relevant to the management of the MPA and AIA. Governance and data management is discussed in more detail in the Research Document that accompanies this Science Advisory Report. In practice, the success of monitoring to evaluate the conservation
objectives for the MPA and AIA may be dependent on the availability of resources that permit monitoring of appropriate scale and resolution.
CONCLUSIONS
Monitoring MPAs is new to DFO, and the first few years of monitoring the Musquash Estuary MPA and AIA will likely be a learning process. In some cases, baseline information of select ecosystem components does not exist. Considering this, priority monitoring activities should: 1. monitor existing managed activities in the Musquash Estuary MPA and AIA;
2. establish at least one baseline in each ecosystem component (productivity, biodiversity, habitat); and
3. investigate zones of influence for perceived threats in and adjacent to the Musquash Estuary MPA and AIA.
At present, baseline data collection is occurring simultaneously with design of the proposed monitoring framework.
The Musquash Estuary ecosystem framework of Singh and Buzeta (2007) identified existing monitoring activities that have been undertaken in the estuary. Many of the monitoring activities were established by stakeholder groups, individual researchers, and interested government departments, and would generally fall under establishing baselines for ecosystem components. These activities are considered to be a valuable source of information and expertise and, in most circumstances, offer a cost-effective means of baseline data collection. Although the spatial and temporal extent of natural variation has yet to be determined for the current and proposed monitoring indicators, the results of baseline data should be incorporated into a monitoring plan, as they become available.
As is anticipated with all of the monitoring strategies and protocols discussed above, the potential for continued community involvement may improve with iterative cycles of monitoring. Current and proposed monitoring activities must be adequately described and linked to the conservation objectives and proposed indicators. In addition, an estimate of costs, protocols, and organization(s) that may contribute to the implementation of monitoring should be identified for each activity, in order to evaluate the effectiveness of an overall monitoring plan.
SOURCES OF INFORMATION
This Science Advisory Report is from the Fisheries and Oceans Canada, Canadian Science Advisory Secretariat, regional advisory meeting of 9-10 December 2010 on the review of the draft Musquash Estuary Marine Protected Area (MPA) and Administered Intertidal Area (AIA) Monitoring Framework Additional publications from this process will be posted as they become available on the DFO Science Advisory Schedule at
http://www.dfo-mpo.gc.ca/csas-sccs/index-eng.htm.
Amato, M.T., M. Hanson-Lee, and M.-I. Buzeta. 2003. Shoreline debris assessment in the Quoddy Region, Southwestern New Brunswick. Can. Man. Re. Fish. Aquat. Sci. 2633: viii + 24pp.
Davies, J., R. Singh, and M.-I. Buzeta. 2008. Musquash Estuary Marine Protected Area ecosystem framework and monitoring workshop report. Can. Tech. Rep. Fish. Aquat. Sci. 2787: 23pp.
DFO (Fisheries and Oceans Canada). 2008 (Draft). Musquash Estuary: a Management Plan for the Marine Protected Area and Administered Intertidal Area. Published by Fisheries and Oceans Canada, Maritimes Region. Publication number DFO/2008-1457: 44pp.
Gratto, G.W. 1986. Interactions between vertebrate predators and their benthic prey on an intertidal mudflat. Ph.D. Thesis, University of New Brunswick, Fredericton, New Brunswick.
Hunter and Associates. 1982. Coastal Zone Management Study, Bay of Fundy, New Brunswick, Technical Report, Vol. 1. Prepared for Mineral Resources Branch, Department of Natural Resources, New Brunswick: 290pp.
Jamieson, G., R.N. O’Boyle, J. Arbour, D. Cobb, S. Courtenay, R. Gregory, C. Levings, J. Munro, I. Perry, and H. Vandermeulen. 2001. Proceedings of the National Workshop on Objectives and Indicators for Ecosystem-based Management. DFO Can. Sci. Advis. Sec. Proc. Ser. 2001/09: 140pp.
Kristmanson, D.D. 1974. Salinity distributions in the Musquash Estuary. Fish. Res. Board Can. Man Rep. 1329: 14pp.
McDonald-Madden, E., P.W.J. Baxter, R.A. Fuller, T.G. Martin, E.T. Game, J. Montambault, and H.P. Possingham. 2010. Monitoring does not always count. Trends in Ecology and Evolution. 25: 547-550.
Rangeley, R., and R. Singh. 2000. Biological Monitoring in Marine Protected Areas: A Proposal for the Musquash Estuary. A Report in Support of the Musquash MPA Campaign. Conservation Council of New Brunswick, Marine Conservation Program, Fredericton, NB.
Singh, R., and M.-I. Buzeta. 2007. An ecosystem framework for the management of Musquash Estuary Marine Protected Area. Can. Tech. Rep. Fish. Aquat. Sci. 2702: v + 27pp.
Singh, R., M.-I. Buzeta, M. Dowd, J.L. Martin, and M. LeGresley. 2000. Ecological overview of Musquash Estuary: a Proposed Marine Protected Area. Can. Tech. Rep. Fish. Aquat. Sci. 2538: 39pp.
Smith, C.A. 2002. Persistent industrial marine debris in Charlotte County and the Passamaquoddy area. Prepared for Eastern Charlotte Waterways Incorporated and
Fisheries and Oceans Canada. Website http://www.ecwinc.org/Publications/pimd.pdf
(cited 4 January 2011): 88pp.
Wildish, D.J. 1977. Sublittoral macro-fauna of Musquash Estuary. Fish. Mar. Serv. Man Rep. 1463: 13pp.
FOR MORE INFORMATION
Contact: Eddy Kennedy
Ecosystem Research Division Fisheries and Oceans Canada Bedford Institute of Oceanography P.O. Box 1006, Dartmouth
Nova Scotia B2Y 4A2 Tel: Fax: E-Mail: 902-426-9917 902-426-6695 Eddy.Kennedy@dfo-mpo.gc.ca
This report is available from the: Centre for Science Advice (CSA)
Maritimes Region Fisheries and Oceans Canada
Box 1006, Stn. B203 Dartmouth, Nova Scotia
Canada B2Y 4A2 Telephone: 902-426-7070
Fax: 902-426-5435
E-Mail: XMARMRAP@mar.dfo-mpo.gc.ca
Internet address: www.dfo-mpo.gc.ca/csas
ISSN 1919-5079 (Print) ISSN 1919-5087 (Online)
© Her Majesty the Queen in Right of Canada, 2011
CORRECT CITATION FOR THIS PUBLICATION
DFO. 2011. Musquash Estuary: A Proposed Monitoring Framework for the Marine Protected Area and Intertidal Area Administered by Fisheries and Oceans Canada. DFO Can. Sci. Advis. Sec. Sci. Advis. Rep. 2011/040.