Who Benefits from the “Sharing” Economy of Airbnb?
Giovanni Quattrone
Dept. of Geography University College London, UK
g.quattrone@cs.ucl.ac.uk
Davide Proserpio
Dept. of Computer Science Boston University, USA
dproserp@bu.edu
Daniele Quercia
Bell Laboratories Cambridge, UKquercia@cantab.net
Licia Capra
Dept. of Computer Science University College London, UK
l.capra@ucl.ac.uk
Mirco Musolesi
Dept. of Geography University College London, UK
m.musolesi@ucl.ac.uk
ABSTRACT
Sharing economy platforms have become extremely popular in the last few years, and they have changed the way in which we com-mute, travel, and borrow among many other activities. Despite their popularity among consumers, such companies are poorly regulated. For example, Airbnb, one of the most successful examples of shar-ing economy platform, is often criticized by regulators and policy makers. While, in theory, municipalities should regulate the emer-gence of Airbnb through evidence-based policy making, in prac-tice, they engage in a false dichotomy: some municipalities allow the business without imposing any regulation, while others ban it altogether. That is because there is no evidence upon which to draft policies. Here we propose to gather evidence from the Web. Af-ter crawling Airbnb data for the entire city of London, we find out where and when Airbnb listings are offered and, by matching such listing information with census and hotel data, we determine the socio-economic conditions of the areas that actually benefit from the hospitality platform. The reality is more nuanced than one would expect, and it has changed over the years. Airbnb demand and offering have changed over time, and traditional regulations have not been able to respond to those changes. That is why, fi-nally, we rely on our data analysis to envision regulations that are responsive to real-time demands, contributing to the emerging idea of “algorithmic regulation”.
Categories and Subject Descriptors
J.4 [Social and Behavioral Science]: MiscellaneousGeneral Terms
Sharing economy, regulation, policy
1.
INTRODUCTION
In the last few years, we have seen the proliferation of sharing economy platforms. These platforms leverage information technol-ogy to empower users to share and make use of underutilized goods
Pre-print Version
WWW 2016,April 11–15, 2016, Montréal, Québec, Canada. .
and services. Services covered by the sharing economy range from transportation to accommodation to finance. One of the most com-pelling example of the sharing economy is Airbnb, a peer-to-peer accommodation website. Airbnb defines itself as “A social website that connects people who have space to spare with those who are looking for a place to stay”. The company, founded in 2008, grew exponentially in the past few years, and by now it lists over 1.5 mil-lion properties, with a presence in over 190 countries and 34,000 cities. By the end of 2014, the company had more than 70M nights booked.1
The explosive growth of the sharing economy has led regulatory and political battles around the world. Proponents of the sharing economy argue that it will bring many benefits, including extra in-comes from the users of such services, better resource allocation and utilization, and new economic activities for cities and munici-palities.2 On the other side, detractors argue that the negative exter-nalities generated by the sharing economy far outpace the benefits. Most of the critics denounce the sharing economy for being about economic self-interest rather than sharing, and for being predatory and exploitative. Indeed, the predatory aspect of such economy has already seen its first victims: after Uber entered the New York City market, the price of taxi medallion fell down by about 25%,3 and in [21] the authors show that Airbnb entry in the state of Texas negatively impacted hotel revenue.
Because of such negative externalities, the sharing economy and its regulation have become highly popular policy topics. Many mu-nicipal governments are attempting to impose old regulations on these new marketplaces without much thought about whether these laws apply to these companies, and without a complete understand-ing of the benefits and drawbacks generated by these new services. Furthermore, such a debate has resulted into little academic work, as we shall see in Section 2. We aim to fill this gap by perform-ing the first socio-economic analysis of Airbnb adoption. We do so by using the city of London as case study. London is particular well-suited because of its high diversity in socio-economic and ge-ographic terms, and of its enthusiastic adoption of Airbnb (by June 2015, London had over 14,000 Airbnb properties listed). We show which areas benefit from Airbnb, and how the insights related to
1See:
http://www.reuters.com/article/2015/09/28/us-airbnb-growth-idUSKCN0RS2QK20150928
2
Airbnb itself released several studies quantifying the positive eco-nomic impact of the company in many cities around the world. For more details see: https://www.airbnb.com/economic-impact
3
See: http://www.nytimes.com/2015/01/08/upshot/new- york-city-taxi-medallion-prices-keep-falling-now-down-about-25-percent.html
that inform policy making. More specifically, we make two main contributions:
• We crawl Airbnb data in London from 2012 to 2015 and study the adoption of the platform across the UK census ar-eas in the city (Section 4).
• We analyze such data (Section 5) and contrast the socio-economic conditions of the areas that benefit from Airbnb to those of the areas that do not (Section 6).
We then conclude by putting forward five recommendations on how Airbnb might be regulated based on our insights (Section 7).
2.
RELATED WORK
Our work relates to the growing literature on the regulation of the sharing economy. Research in these area comes from many disciplines, from law to economy to policy. In [3], the authors, after enumerating the efficiencies that the sharing economy pro-vides for both service providers and consumers, discuss regulation and policies for such software platforms. They suggest the need to adapt law and regulations to allow those platforms to operate legally. This will ensure that service providers, users and third par-ties are adequately protected from any harm that may arise. Of the same opinion are the authors in [8]. They argue that when market circumstances change dramatically – or when new technology or competition alleviates the need for regulation – then public policy should accordingly evolve. Einavet al.[4] provide a discussion about licensing, employment regulation, data, and privacy regula-tion of the sharing economy. They do so by considering the cur-rent regulations adopted by a few municipalities, and discussing the pros and cons. In [12], the author critiques the existing regu-lation of Airbnb. [20] presents a taxonomy of “sharing”, including formality and gratuity, and examines doctrinal responses to sharing situations. [16] compares Uber’s efficiencies with its regulatory ar-bitrage. [15] analyzes the challenges of regulating the sharing econ-omy from an “innovation law perspective” by arguing that these in-novations should not be stifled by regulation, but should also not be left totally unregulated. [2] argues for self-regulatory approaches and reallocation of regulatory responsibility to parties other than the government. Finally, [7] studies how financial incentives are mediated by hospitality and sociability in Airbnb.
While the above works do an excellent job in defining the bases upon which the sharing economy should be regulated, none of them does so upon empirical evidence of what the sharing economy re-ally is, how it has been adopted, and who benefits from it. By con-trast, this work argues for evidence-informed policy making, and provides answers to the above questions by empirically investigat-ing Airbnb adoption.
3.
OVERVIEW
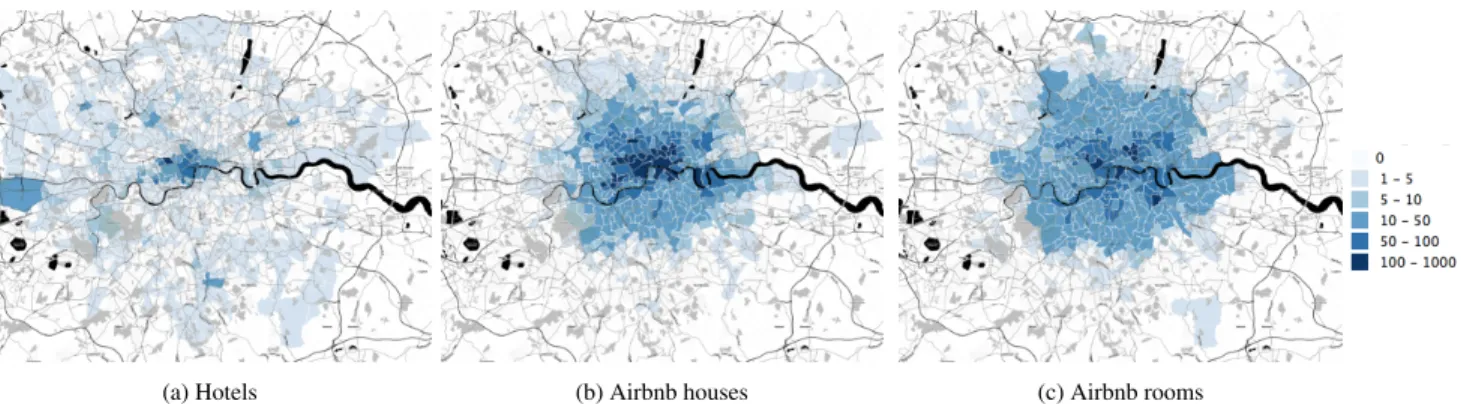
Where are Airbnb listings located? This is one of the most fre-quently asked questions by municipalities, hoteliers and travellers. To start answering it, we crawled extensive data about Airbnb prop-erties (from 2012 to 2015) and hotels for the city of London (which the next section will describe in detail), and we simply map the presence of hotels and Airbnb listings in the city. A clear distinction that the Airbnb website makes is betweenentire home/apartment
(case where the whole home/apartment is rented) andprivate room
(case where only a private room is rented and all the other spaces of the house are shared with others). Given that distinction, we sep-arately map the offering of Airbnb houses (Figure 1b) and Airbnb
Airbnb Rooms
Year hotel_in_bnb_areas bnb_in_hotel_areas
2012 0.14 0.64
2013 0.14 0.67
2014 0.12 0.71
2015 0.12 0.71
Airbnb Houses
Year hotel_in_bnb_areas bnb_in_hotel_areas
2012 0.24 0.64
2013 0.23 0.64
2014 0.24 0.64
2015 0.24 0.63
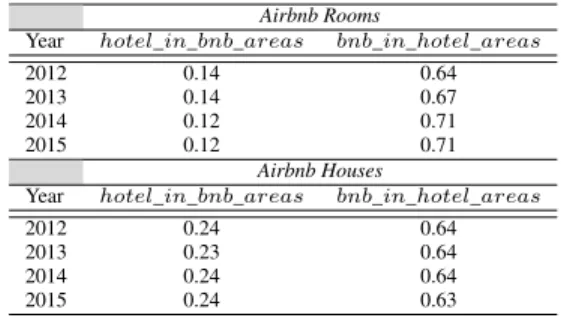
Table 1: Fraction of London areas that have hotels and Airbnb properties (roomsvs.houses).
rooms (Figure 1c), and contrast them to the offering of hotels (Fig-ure 1a). Fig(Fig-ure 1 shows that hotels have spotty coverage throughout the city of London, and they are mostly concentrated in the center and near the main airport (Heathrow) on the west side. Airbnb houses have a heavy presence in the city center (like hotels), but they also reach adjacent areas up to around 10 miles from the cen-ter. Airbnb rooms massively cover – almost uniformly – the great-est part of the city of London instead, including suburban areas.
To go beyond visual inspection, we compute the overlap between Airbnb adoption and hotel adoption. Since each area can be cov-ered at various levels of strengths by Airbnb and hotels, we adopt the fuzzy logic functions. Specifically letbnbandhotelbe two fuzzy sets such thatbnbi ∈[0,1]andhoteli ∈[0,1]denote, re-spectively, the strength of Airbnb’s offering in areaiand of hotels’. The strength is zero if Airbnb listings (hotels) are totally absent from areai, is one if they show maximum presence (with respect to the entire dataset), and, otherwise, assumes intermediate values proportional to the presence. Upon those two sets, we compute the ratio of areas covered by Airbnb that are also covered by hotels, and the ratio of areas covered by hotels that are also covered by Airbnb as follows:
hotel_in_bnb_areas=|bnb∩hotel|
|bnb|
bnb_in_hotel_areas=|bnb∩hotel|
|hotel|
(1)
Where the intersection(bnb∩hotel)of two fuzzy sets is defined
by(bnb∩hotel)i =min{bnbi, hoteli}, and the cardinality of a
fuzzy setbnbis defined by|bnb|=P
ibnbi. We compute these ratios for every year, from 2012 to 2015, for the two Airbnb list-ings categories: rooms and houses (Table 1). Airbnb properties (especially rooms) tend to be located in areas where there are ho-tels. That has been true over the years and, from 2012 to 2015, has increased for Airbnb houses as well (specifically, by 7%). On the contrary, hotels do not tend to be in areas where there are Airbnb properties. Therefore, we can safely conclude that Airbnb listings cover a much broader city area than what hotels do.
Since the spatio-temporal dynamics behind Airbnb are quite unique (and definitely different than those behind hotels), we set out to study it in detail and answer four main questions:
RQ1 – What are the main socio-economic characteristics of areas with Airbnb listings?
RQ2 – Are all types of listings equal? Is there any difference be-tween, for example, Airbnb listings of rooms and those of entire houses?
(a) Hotels (b) Airbnb houses (c) Airbnb rooms
Figure 1: Heat maps of the number of hotels, Airbnb houses, and Airbnb rooms in each London ward. The darker the ward, the higher the number. The legend reflects the actual (not normalized) numbers, which are thus comparable across the three maps.
RQ4 – Where do Airbnb customers actually go? That is, what are the main socio-economic characteristics of areas where Airbnb customers go?
4.
DATASETS AND METRICS
To answer those questions, we need to collect information from various data sources. On one hand, we need detailed records of Airbnb properties; on the other hand, we need to collect socio-economic data and derive neighborhood metrics from it.
4.1
Airbnb Data
We have periodically collected, since mid 2012, consumer-facing information fromairbnb.comon the complete set of users who had listed their properties in the city of London for rental on Airbnb. We refer to these users ashosts, and their properties as theirlistings. Each host is associated with a set of attributes including a photo, a personal statement, their listings, guest reviews of their properties, and Airbnb-certified contact information. Similarly, each listing displays attributes including location, price, a brief textual descrip-tion, photos, capacity, availability, check-in and check-out times, cleaning fees, and security deposits.
Our collected dataset contains detailed information on 14,639 distinct London hosts, 17,825 distinct London listings, and 220,075 guest reviews spanning a period from March 2012 to June 2015. From this data we measure:
Airbnb offering per area (bnb_offering): the ratio between the number of Airbnb listings registered in a given London area over the surface of the same area in square kilometers. We have also considered two types of normalization other than surface – number of inhabitants and number of dwellings. For all the three types, the results are comparable.
Airbnb demand per area (bnb_demand):the total number of Airbnb reviews registered in a certain area of London over the size of the area in square kilometers. We use reviews as a proxy for demand, not least because it has been shown that people leave reviews after staying at a place more than 70% of the times [6].
4.2
Socio-economic Conditions
We used two different data sets that reflect socio-economic con-ditions of London areas.
4.2.1
Census Data
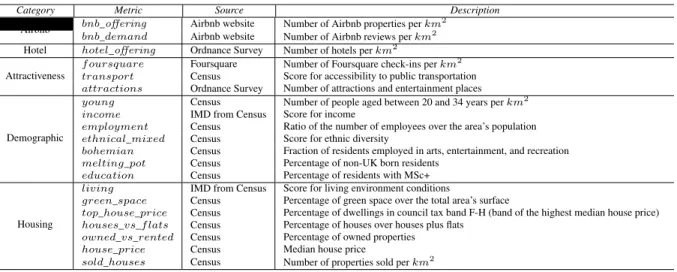
We gather the 2011 official UK census data4containing demo-graphic information about small areas defined by the UK Govern-ment and known aswards. This includes the population density of the area, how many young people live there, the number of ed-ucated people, as well proxies concerning how pleasant a partic-ular area is to live in (e.g., the percentage of green space). From this dataset, we also collect housing information. This includes the number of flats and houses present in an area, the number of proper-ties sold, the number of dwellings that are owned rather than rented, and the median house price. This information is useful to have an accurate picture of the type of housing available in each London area, as well as the fluidity of the housing market there. Most of those metrics have been widely used. By contrast, a few have been used in a limited number of papers and need to be illustrated:
Diversity of Ethnic Groups(ethnical_mixed). The idea for this diversity index was taken from Chris von Csefalvay’s data blog [19]. In the blog, the author describes a method of mea-suring diversity in England and Wales with a metric taken from mathematical ecology. This metric is calculated as the Gini-Simpson diversity index5of the ethnic groups living in each area. The census data contains five different categories of ethnicity (number of white, black, Asian, mixed and other individuals in an area). These five categories were used to calculate the Gini-Simpson index. This index represents the probability that two individuals chosen at random from an area are of a different ethnicity (high values are associated with multi-ethnic areas).
Bohemian Index(bohemian). We start from the work of Richard Florida [5] on the effect of the bohemian, artistic and gay population on regional house prices. The author found that a newly derived “Bohemian-Gay Index” has a substantial ef-fect on house prices. We can thus hypothesize that a similar metric may have an interesting effect on the number or price of Airbnb offerings. Unfortunately, since gender is not part of the UK census information, we are not able to recreate this metric. We therefore followed the same approach adopted by Nick Clifton [1] that analyzed the creative class in the UK instead. By following Florida’s work, Clifton computed a
4
See:
http://data.london.gov.uk/dataset/ward-profiles-and-atlas
5
The Simpson diversity index is a measure that reflects how many different entries there are in a data set and the value is maximized when all entries are equally high [18].
Category Metric Source Description
Airbnb bnb_offering Airbnb website Number of Airbnb properties perkm
2 bnb_demand Airbnb website Number of Airbnb reviews perkm2
Hotel hotel_offering Ordnance Survey Number of hotels perkm2
Attractiveness
f oursquare Foursquare Number of Foursquare check-ins perkm2 transport Census Score for accessibility to public transportation attractions Ordnance Survey Number of attractions and entertainment places
Demographic
young Census Number of people aged between 20 and 34 years perkm2
income IMD from Census Score for income
employment Census Ratio of the number of employees over the area’s population ethnical_mixed Census Score for ethnic diversity
bohemian Census Fraction of residents employed in arts, entertainment, and recreation melting_pot Census Percentage of non-UK born residents
education Census Percentage of residents with MSc+
Housing
living IMD from Census Score for living environment conditions
green_space Census Percentage of green space over the total area’s surface
top_house_price Census Percentage of dwellings in council tax band F-H (band of the highest median house price) houses_vs_f lats Census Percentage of houses over houses plus flats
owned_vs_rented Census Percentage of owned properties
house_price Census Median house price
sold_houses Census Number of properties sold perkm2
Table 2: Description of the variables used in our analyses.
cultural metric (the Bohemian Index) by only using the data made available in the UK census. This metric is defined as the fraction of people employed in arts, entertainment and recreation.
Melting Pot Index(melting_pot). This is the second metric used by Nick Clifton [1] to describe the creative class in the UK and is the number of people born outside the UK divided by the total number of people in the area.
4.2.2
IMD Score
We also collect the UK Index of Multiple Deprivation (IMD) data6available at the level of small census areas known as Lower-layer Super Output Areas (LSOAs). LSOAs are defined to roughly include always the same number of inhabitants (around 1,500).7
IMD is a composite score, comprising seven distinct domains:(i) in-come, (ii)employment, (iii)health, (iv)education,(v)barrier to housing and services,(vi)crime, and(vii)living environment. For the purpose of our study, we collected the values of two indexes, called income and living environment, as we hypothesize that these two factors, jointed with the ones collected with the census data, may have an impact on the number and type of Airbnb offerings.
4.3
Attractiveness
A traditional metric often used to describe London areas is trans-portation accessibility (transport): the higher the value, the more accessible the area by public transport. This metric is ready avail-able from the UK Census. To capture more nuanced facets of at-tractiveness of London areas other than transport accessibility, we compute three further metrics from two other data sets.
4.3.1
Foursquare
Foursquare has been launched in 2009 and it is one of the most popular location-based social networking website.8 Using Foursquare, 6 See: https://www.gov.uk/government/uploads/system/ uploads/attachment_data/file/6871/1871208.pdf 7 See: https://www.gov.uk/government/statistics/ english-indices-of-deprivation-2010 8 See:https://foursquare.com/about
registered users that visit a location can “check-in” on the appli-cation to share their real-time loappli-cation with friends. In Decem-ber 2013, Foursquare surpassed 45 million registered users and currently male and female users are equally represented.9 Janne Lindqvistet al. studied why people check-in and found that indi-viduals tend to use Foursquare to see where they have been in the past and ultimately curate their own location history [11]. For this reason, we hypothesize that, in cities where Foursquare has high penetration such as London, the number of Foursquare check-ins may be considered as an approximate measure of the attractiveness of areas (i.e., areas where city dwellers prefer to visit and spend time in). We use the official Foursquare API to crawl Foursquare check-ins.10 We perform this step between 04/03/2014 and 08/04/2014, resulting in the collection of 26,344,115 users check-ins in the whole London metropolitan area. We then compute our first measure of area attractiveness as the number of Foursquare check-ins in a specific area over the area’s surface in square kilo-meters. We denote this variable asf oursquare.
4.3.2
Ordnance Survey
Ordnance Survey11 is the national mapping agency for Great Britain. OS mapping is usually classified as the more detailed map-ping of the country and covers not only roads but also millions of Point of Interests (POIs) of varying nature, from restaurants to hos-pitals and hotels. Ordnance survey data is freely available.12 We downloaded the data in July 2015, collecting 513,786 POIs in the whole metropolitan London area. For the purpose of this study, we considered the number of Ordnance Survey POIs that fall under one of the categories of “eating and drinking”, “attractions”, “re-tail”, “sports and entertainment” – to capture London areas that are covered by attractions – normalized by the size of the area in square kilometers. We denote this variable asattractions.
4.4
Hotel Data
To study whether Airbnb offerings are located in areas with pres-ence of traditional forms of accommodation, we consider the num-ber of Ordnance Survey POIs that fall under one of the categories of “hotels”, “motels”, “country houses and inns” normalized by the
9See:https://en.wikipedia.org/wiki/Foursquare 10See:https://api.foursquare.com 11 See:www.ordnancesurvey.co.uk 12 See:www.ordnancesurvey.co.uk/resources
Figure 2: London Wards.
size of the area in square kilometers. We denote this variable as
hotel_of f ering. Table 2 lists all the metrics that we have
com-puted so far, and that we use next.
5.
METHOD
This section describes the method we have developed to answer the four questions we put forward in the final part of Section 3.
5.1
Unit of Analysis
The goal of this work is to measure the number and the type of Airbnb offerings in different areas of a city (London, in our case) and study their relationship between offering and neighbor-hood socio-economic conditions.
To do so, we need to define aspatial unitof analysis that is rep-resentative of the different London areas. We therefore choose a spatial unit calledward. Using official geographic definitions of wards in the UK,13we computed 625 wards for Greater London
il-lustrated in Figure 2. Although we are aware that wards might not be completely homogeneous in terms of their characteristics, the size of wards allows for the collection of a statistically significant number of data points, which is not possible to obtain by using smaller geographic units such as LSOAs. From now on, for the sake of simplicity, we will refer to wards as “areas”. Whenever data was available at a different level of granularity, we aggregated it to have the information at ward level. This was the case, for ex-ample, of IMD data, which was available at level of LSOA; in such case, we computed the IMD score of a ward as the average of the IMD scores of the ward’s LSOAs. Very little information was lost during such an aggregation step, as IMD scores for LSOAs in the same ward are very consistent (the standard deviation is less than the corresponding average value, for all wards).
In terms oftemporal unitof analysis, we must concede that there is a four-year gap between the UK census data of 2011 and the other sets of data that refer to 2014/2015. However, even in the presence of this gap, a cross-comparison of all sets is still possible. That is because the collection of census data is conducted every 10 years in the UK and, as such, the census indicators are bound to remain unchanged in a 4-year time window.
13
See: https://geoportal.statistics.gov.uk/Docs/
Boundaries/Wards_(E+W)_2011_Boundaries_(Full_ Extent).zip
5.2
Approach
The aim of this paper is to give insights about who benefits from the economy generated by Airbnb. As a first step, we study which of the socio-economic factors associated with the London areas are significantly correlated with Airbnb offering. We use a linear re-gression model in the form of Ordinary Least Squares (OLS):
Yi=β0+β1Xi+i , (2)
whereYiis one of the first three metrics in Table 2 (i.e.,bnb_of f ering,
bnb_demand, andhotel_of f eringfor areai), andXiis the set of
the remaining metrics in the table, which reflect the socio-economic conditions of areai.
Since we are dealing with geographic data, for each produced model, we test for the presence of spatial autocorrelation. This is the tendency for measurements located close to each other to be correlated, a property that generally holds for variables observed across geographic spaces [10]. We test our OLS models for spatial auto-correlation by computing the Moran’s test14on the residuals
i.
Finally, since most of our metrics are skewed and therefore do not conform with the normality assumption of the variance, we im-prove the normality of such variables by applying a log transfor-mation. Further, since our metrics are on very different scales, we standardize them by computing theirz-scores. This transformation enables us to compareβscores that are from different distributions.
6.
RESULTS
This section is subdivided in two parts: in the first, we present some preliminary results coming out from a cross-correlation anal-ysis performed on the adopted metrics; in the second, we describe the results we have collected to answer our four research questions.
6.1
Preliminary Analysis
To know which of our variables in Table 2 are correlated with each other, we compute the cross-correlation matrix (Figure 3). Take the first row. It shows which variables are correlated with Airbnb offering. We see that Airbnb listings tend to be in areas that are attractive and accessible by public transport, and that have resi-dents who are young, employed, and born outside UK. By contrast, Airbnb listings tend not to be in areas where there are more houses than flats and where there are more owned properties than rented ones (these areas are likely to be suburban areas). Similar results can be found when looking at the second row of Figure 3, which looks at Airbnb demand.
These initial results suggest that our conjecture that specific neigh-borhood socio-economic conditions are related to Airbnb demand and offering is well-grounded. To now go into the details, we per-form a regression analysis. Since some of our independent vari-ables exhibit levels of cross-correlations (Figure 3), we expect that not all the variables that are now correlated with Airbnb offering and demand will maintain the same significance levels in the next regression analysis.
6.2
RQ1. Socio-economic Conditions
After mapping the Airbnb listings (Figure 1), we have observed that the offering seems to be highly correlated with the distance from the city center. For this reason, we regress the cumulative values of Airbnb offeringbnb_offering per London area against
14The Moran’s test is a measure of spatial autocorrelation
devel-oped by Patrick Alfred Pierce Moran [13]. Values range from−1 (indicating perfect spatial dispersion) to+1(perfect spatial auto-correlation). A zero value indicates a random spatial pattern.
Figure 3: Pearson cross-correlation matrix of the metrics in Table 2 with significance levels (crossed circles indicatep-value>0.01). The cross-correlations are grouped according to the classification in the table.
the socio-economic variables described in Section 4 plus distance from the city center. A previous study has found that London has 10 different polis [17]. In this work, we thus computeddistance, which is the Euclidean distance from the geographic center point of each ward to the geographic center point of each of the 10 polis. We then used the shortest distance as our “distance from the center” factor, and tested the hypothesis that the closer to the poly-center, the higher the offering and the demand of Airbnb.
The estimates of the regression model are reported in Table 3. Indeed, in the second row, one sees that the farther the distance from the center, the lower the number of listings. Also, Airbnb properties are, again, associated with attractive and well-to-do areas with young and tech-savvy residents.
6.3
RQ2. Airbnb Rooms vs. Houses
So far we have provided evidence that, when treating Airbnb listings homogeneously, properties are more likely to be concen-trated in tech-savvy and well-to-do areas with young renters. In practice, Airbnb listings are very different among them though. A clear distinction that the website makes is betweenentire homes/ apartmentsandprivate rooms. Therefore, in this section, we re-peat the above analysis by separating Airbnb listings into those two categories (Table 4). We observe significant differences: Airbnb
roomstend to be offered in areas with highly-educated non-UK born renters, whilehomestend to be offered in areas with owners of high-end homes in terms of house price.
6.4
RQ3. Temporal Adoption
Since our Airbnb data unfolds over four years, we are able to study its temporal characteristics. To this end, we regress the num-ber of Airbnb listings that appear every year since 2012 (year in which Airbnb first entered the London market) against our set of socio-economic metrics. By doing so, we are able to undercover how Airbnb offering evolved over time: which characteristics con-sistently explain Airbnb growthvs. which ones change over time
Indep. var p-val β Hotel hotel_offering -0.02 Geography distance *** -0.25 Attractiveness f oursquare ** 0.14 transport -0.05 attractions 0.02 Demographics young *** 0.40 income *** -0.16 employment 0.00 ethnical_mixed ** 0.09 bohemian -0.01 melting_pot * -0.07 education -0.01 Housing living . 0.05 green_space 0.03
top_house_price 0.03 houses_vs_f lats . -0.10 owned_vs_rented *** -0.23 house_price *** 0.15 sold_houses ** 0.07 Adjusted R-squared 0.90 Moran’s test 0.03
Table 3: Analysis of Airbnb offering. Blue (resp., red) bars reflect positive (resp., negative) slope coefficients.
Airbnb Rooms Airbnb Houses Indep. var p-val β p-val β
Hotel hotel_offering -0.02 . -0.04
Geography distance *** -0.33 *** -0.16 Attractiveness f oursquare ** 0.15 * 0.12 transport . -0.07 -0.04 attractions 0.03 0.01 Demographics young *** 0.44 *** 0.29 income ** -0.13 * -0.12 employment -0.06 0.03 ethnical_mixed *** 0.13 ** 0.10 bohemian -0.01 0.00 melting_pot *** -0.11 -0.05 education * 0.10 0.01 Housing living 0.03 * 0.08 green_space 0.03 0.01
top_house_price . 0.08 0.05
houses_vs_f lats 0.00 * -0.14 owned_vs_rented *** -0.27 *** -0.25 house_price -0.01 *** 0.22 sold_houses . 0.05 ** 0.09 Adjusted R-squared 0.87 0.86 Moran’s test 0.02 0.03
Table 4: Analysis of Airbnb offering by category (rooms vs.
houses).
instead. In Table 5, we report the estimates obtained for the four years, from2012to2015.
2012. At early stages of adoption, the most important predictor is geography, i.e., Airbnb penetrated areas close to the city center first. Early adopters were likely young and ethnically-diverse residents living in central neighborhoods. A certain percentage of these early adopters might be composed of stu-dents, given the negative correlation with employment.
2013. The coefficient for the variable distance from the center decreases in magnitude, and FourSquare check-ins stop be-ing statistically significant, suggestbe-ing that, at a second stage, Airbnb penetrated areas whose residents are not necessarily tech-savvy youngsters. Those residents tend to be of two types: the first tend to own their own houses, while the sec-ond tend to struggle financially (the income variable becomes negatively correlated).
2012 2013 2014 2015 Indep. var p-val β p-val β p-val β p-val β
Hotel hotel_offering 0.00 -0.02 ** -0.09 . -0.08
Geography distance *** -0.32 *** -0.19 * -0.12 * -0.13 Attractiveness f oursquare *** 0.20 . 0.12 -0.06 -0.11 transport -0.07 . -0.09 0.05 0.02 attractions 0.06 0.04 -0.04 -0.01 Demographics young *** 0.27 *** 0.32 *** 0.31 ** 0.24 income 0.05 *** -0.21 *** -0.42 *** -0.62 employment ** -0.12 -0.02 0.07 0.06 ethnical_mixed *** 0.17 ** 0.12 0.01 0.02 bohemian -0.03 -0.01 0.00 -0.01 melting_pot ** -0.09 ** -0.12 -0.03 -0.02 education 0.07 0.05 -0.10 ** -0.25 Housing living . 0.06 0.03 0.03 -0.01 green_space -0.02 0.01 0.01 0.00
top_house_price 0.03 * 0.13 ** 0.21 0.07
houses_vs_f lats -0.07 . -0.13 0.02 -0.15 owned_vs_rented -0.11 *** -0.32 *** -0.64 *** -0.59 house_price *** 0.20 * 0.13 0 .04 0.04 sold_houses . 0.05 0.03 *** 0.19 *** 0.20 Adjusted R-squared 0.84 0.80 0.70 0.54 Moran’s test 0.03 0.02 0.04 0.05
Table 5: Temporal analysis of Airbnb offering.
2014 and 2015. The trends described for the year 2013 continue. In particular, the strongest predictors of Airbnb offering are two: low income and number of rented houses. Again, this indicates the possibility that Airbnb is helping people who might be struggling economically.
To sum up, we spell out three main insights. First, central ar-eas become consistently less predominant year after year: the co-efficientdistancefrom the center decreases in magnitude, and the
foursquaremetric stops being statistically significant. Second, the correlation withincomebecomes increasingly negative year after year – late-adopting hosts joined Airbnb for extra income. Finally, the correlation withownedproperties becomes increasingly nega-tive too – late-adopting hosts did not tend to own their properties.
6.5
RQ4. Where Do Airbnb Customers
Actu-ally Go?
We are aware that number of listings does not fully reflect the number of hosting events. Therefore, in this section, we study Airbnb demand by using the number of user reviews as a proxy. According to [6], the completion rate for reviews is high in Airbnb: the number of reviews over the number of stays is more than 70%, making the number of reviews a good proxy for demand.
Using the same regression model of the previous analyses, we study how demand is associated with neighborhood socio-economic conditions over the past four years, from 2012 to 2015. In Sec-tion 6.4, when looking at the offering, we showed that Airbnb is first adopted in central areas, but it then moves to more diverse ar-eas of the city. By contrast, we do not observe such an evolution pattern for Airbnb demand. Instead, reviewing patterns year after year are very similar, if not constant. Because we did not observe a temporal difference, we report the estimate for the year 2015 only in Table 6: areas with high Airbnb demand are touristic (as one would have expected); they are close to the city center, and have high number of FourSquare check-ins and high population density. From the heat map of Figure 4, we confirm that areas of high Airbnb demand are closer to the center. Interestingly, by compar-ing the distribution of Airbnb rooms (Figure 1c) with that of Airbnb demand, we observe that Airbnb rooms cover a larger portion of the city. This indicates that many properties that are listed, but are too far form touristic areas, are not being rented out. Therefore, while, in theory, Airbnb allows travelers to be flexible when choosing the
Figure 4: Heat map of the number of Airbnb reviews in each Lon-don ward. The darker the ward, the higher the number of reviews.
locations for their stays (which has the potential to distribute trav-elers among more diverse areas of the city), in practice, such flexi-bility is not fully exploited at the moment.
7.
DISCUSSION
Based on our results, we now provide five main recommenda-tions about how municipalities should set (Section 7.1), enforce (Section 7.1) and refine regulations (Section 7.3). We conclude this section by pointing out some limitations (Section 7.4).
7.1
Regulating
To properly regulate short-term rentals, a city needs to think about how, where, when, and what to regulate.
How. We envision a regulatory framework similar to that pro-posed by Stephen Miller in which short-term rental market is legal-ized through “transferable sharing rights” [12]. Each house owner has the right to engage in a short-term rental for a given period of time. To ensure market efficiency, the transfer of rights needs to be effective, and entrepreneurs might be able to help. In fact, one
Indep. var p-val β Hotel hotel_offering -0.02 Geography distance *** -0.18 Attractiveness f oursquare *** 0.24 transport -0.07 attractions 0.02 Demographics young *** 0.38 income * -0.12 employment 0.07 ethnical_mixed ** 0.12 bohemian 0.00 melting_pot *** -0.13 education 0.00 Housing living . 0.07 green_space 0.05
top_house_price 0.06 houses_vs_f lats -0.09 owned_vs_rented ** -0.22 house_price ** 0.12 sold_houses 0.01 Adjusted R-squared 0.85 Moran’s test 0.01
Table 6: Analysis of Airbnb demand.
way of ensuring effectiveness is to create web platforms that sell transferable sharing rights in a way similar to what StubHub does when selling tickets [12]. Web platforms make it possible to adjust prices based on market demand in real-time. That demand might be altered to some degree by municipal policy, not least because the rental terms would change depending on the city’s tourism market. Since our analyses have shown that Airbnb has impacted different areas in very different ways (Section 6.2), a neighborhood’s sharing rights might also be allocated depending on the plan of the neigh-borhood’s economic development. This right can be sold to others, if the owner does not wish to engage. The revenues generated by the sharing right market would go to both the city council, which would be able to raise revenues without raising taxes any further; and to neighborhood groups, which would be compensated for any externality.
Recommendation 1:New web platforms should be built to of-fer schemes of “transof-ferable sharing rights” in which prices are based on both real-time market demand and municipal poli-cies. Policies should deal with the externalities created by the short-term rentals while capitalizing on the opportunities offered by them (e.g., decentralization of economic activity). Also, policies might be neighborhood dependent, in that, they might change across the neighborhoods of the same city.
Where & When. It is important for municipalities to regulate where the permits get allocated because:
1. Initial conditions matter. Based on our temporal analysis (Section 6.4), we have found that initial geographic condi-tions greatly influence which areas tend to benefit from the sharing economy in the end, and which do not.
2. Local economies benefit.Airbnb can be used as an economic development tool. It has been shown that Airbnb guests spend a considerable part of their money in the hosting communi-ties [3].
3. Tourism should be sustainable. One of the main priorities of local governments is to make tourism sustainable. In large cities, tourists tend to congregate in central areas, and resi-dents often cannot cope with the increasing demand. Local governments are studying strategies for distributing tourism
across the entire city. Our analysis has shown that, as op-posed to hotels, Airbnb listings have a wider geographic cov-erage (Section 3) and, consequently, naturally load balance tourists across the city.
4. Concentration of short-term rentals has to be avoided. If a neighborhood has an excessive number of short-term rentals, then its character and ambiance are bound to be compro-mised. Within the framework we are envisioning, munici-palities should be able to limit the number of sharing rights.
Recommendation 2:Transferable sharing rights should be allo-cated while considering four main factors: future consequences for adoption, development of local economies, sustainability of tourism, and avoidance of short-term rental “hot-spots”.
What.Sharing economy platforms are quite different from each other, and regulations should be tailored to each situation. The taxi industry and the hotel industry do not have the same legal frame-work; neither should Uber and Airbnb. Additionally, as we have seen in the case of Airbnb for different categories of listings, im-portant differences exist even within the same platform. It is there-fore crucial to understandwhatto regulate. Based our findings, we think that listings of rooms and houses should be regulated differ-ently because:
1. The socio-economic conditions are different.As opposed to houses, rooms tend to concentrate in low-income yet highly educated part of town (likely students) with a predominant non-UK born population (Section 6.3). Houses, instead, tend to be in wealthy areas.
2. The social consequences are different.Central neighborhoods are increasingly becoming places in which properties are rented by wealthy people (Section 6.2). As a consequence, in the long term, the social fabric of those neighborhoods is likely to be compromised, if the situation is left unregulated. Stud-ies have shown that it takes time (years) to build what Put-nam calls “social capital” among neighbors [14], and hav-ing a critical mass of short-term renters does not help. Also, happiness might be affected, as a good predictor of it is the number of people one personally knows and regularly meets in his/her neighborhood [9].
Recommendation 3: The terms of transferable sharing rights should change depending on whether a room or an entire apart-ment is rented.
7.2
Enforcing
Regulations are effective only if they are enforced. An impor-tant part of such an enforcement is to be able to identify offenders. One way of doing so is to automatically spot anomalous behav-ior from data, as the retail banking usually does. By matching Airbnb data with census data, we have been able to find out that Airbnb rooms tend to be offered disproportionately in areas where people rent (Section 6.4). In London, this means that tenants en-gaging in such short-term letting almost certainly violated general “rental agreements” on subletting. One could easily build an index of “subletting violation” by cross-correlating the two data sources of Airbnb rentals and of house ownership. However, this would be possible only if municipalities incentivize the creation of a data sharing ecosystem. Sharing economy companies can and should share part of their data too. This data should be sufficiently specific to inform policies, but also fairly vague to protect the privacy and safety of customers.
Recommendation 4:Municipalities should incentivize the cre-ation of a data sharing ecosystem.
7.3
Refining
After defining and enforcing regulations, a city needs to engage in a dialog with citizens. Sharing economy platforms could provide data upon which the city evaluates the impact of the short-term rental market (e.g., the increasing demand on public services) and refines its responses to it.
Recommendation 5:Municipalities should constantly evaluate the impact of short-term rentals based on data, and they should accordingly refine their regulations.
7.4
Limitations
Our study has two main limitations. The first is that the analy-sis is limited to the city of London. Therefore, generalization of our results to other cities might be inappropriate, as both Airbnb adoption and socio-economics characteristics are very heteroge-neous across cities. Second, while we do have longitudinal data for Airbnb, and therefore we observe temporal and geographical varia-tion of its adopvaria-tion over time, we only have cross-secvaria-tional data for the socio-economic metrics. This makes it difficult to study causal mechanisms. In the future, to partly address that issue, we plan to extend our study to a variety of cities by resorting to the Airbnb data made freely available onhttp://insideairbnb.com/, and by further collecting longitudinal socio-economic data.
8.
CONCLUSION
Only a few efforts (isolated cases, e.g., Portland, Oregon)15have
been devoted to the regulation of the sharing economy, and, even in those cases, hard-and-fast rules have been laid out. By contrast, this work has called for evidence-informed policy making. Cities should rely on data analysis to envision and revise their local ordi-nances, and here we have shown the way by analyzing data about short-term rentals to offer regulatory recommendations.
We have used London as a living lab. We have studied data col-lected unobtrusively on how Airbnb has turned out to be in a fairly unregulated context. A lot of the demand for short-term rentals comes from touristic areas. Those areas change over time, and so traditional regulations are unlikely to be able to respond to those changes. That is why, based on our findings, we have drafted five main recommendations for regulating Airbnb.
Our attempt contributes to the general idea of “algorithmic reg-ulation”, which argues for the analysis of large sets of data to pro-duce regulations that are responsive to real-time demands. Such an approach might be used to regulate any civic issue independent of the sharing economy.
Future work should propose comprehensive evidence-informed legal frameworks, thanks to which a city is able to welcome both the sharing economy and visitors from all over the world, while still feeling home to its residents.
Acknowledgement
We thank Stephen Miller for his extremely helpful feedback.
9.
REFERENCES
15See: http://www.oregonlive.com/front-porch/index.
ssf/2014/07/portland_legalizes_airbnb-styl.html
[1] N. Clifton. The “creative class” in the uk: an initial analysis.
Geografiska Annaler: Series B, Human Geography, 90(1):63–82, 2008.
[2] M. Cohen and A. Sundararajan. Self-regulation and innovation in the peer-to-peer sharing economy.U Chi L Rev Dialogue, 82.
[3] B. G. Edelman and D. Geradin. Efficiencies and Regulatory Shortcuts: How Should We Regulate Companies like Airbnb and Uber?Harvard Business School NOM Unit Working Paper, (16-026), 2015.
[4] L. Einav, C. Farronato, and J. Levin. Peer-to-peer markets. Technical report, National Bureau of Economic Research, 2015.
[5] R. Florida and C. Mellander. There goes the neighborhood: How and why bohemians, artists and gays affect regional housing values.Journal of Economic Geography, 15(6), 2008.
[6] A. Fradkin, E. Grewal, D. Holtz, and M. Pearson. Bias and Reciprocity in Online Reviews: Evidence From Field Experiments on Airbnb. InProceedings of EC’15, pages 641–641. ACM, 2015.
[7] T. Ikkala and A. Lampinen. Monetizing Network Hospitality: Hospitality and Sociability in the Context of Airbnb. InProceedings of CSCW’15, CSCW, pages 1033–1044, New York, NY, USA, 2015. ACM.
[8] C. Koopman, M. D. Mitchell, and A. D. Thierer. The sharing economy and consumer protection regulation: The case for policy change.Available at SSRN 2535345, 2014. [9] R. Layard.Happiness: Lessons from a New Science. Icon
Books, 2005.
[10] P. Legendre. Spatial autocorrelation: trouble or new paradigm?Ecology, 74(6):1659–1673, 1993. [11] J. Lindqvist, J. Cranshaw, J. Wiese, J. Hong, and
J. Zimmerman. I’m the mayor of my house: examining why people use foursquare-a social-driven location sharing application. InProceedings of CHI’11, pages 2409–2418. ACM, 2011.
[12] S. R. Miller. First principles for regulating the sharing economy.Available at SSRN, 2015.
[13] P. A. Moran. Notes on continuous stochastic phenomena.
Biometrika, pages 17–23, 1950.
[14] R. Putnam.Bowling Alone: The Collapse and Revival of American Community. Simon & Schuster, 2001. [15] S. Ranchordás. Does sharing mean caring: Regulating
innovation in the sharing economy.Minn. JL Sci. & Tech., 16:413, 2015.
[16] B. Rogers. Social costs of uber, the.U. Chi. L. Rev. Dialogue, 82:85, 2015.
[17] C. Roth, S. M. Kang, M. Batty, and M. Barthelemy. Structure of Urban Movements: Polycentric Activity and Entangled Hierarchical Flows.PLoS ONE, 6(1), 01 2011.
[18] E. H. Simpson. Measurement of diversity.Nature, 164, 1949. [19] C. von Csefalvay. Doodling in data: Mapping diversity in
England and Wales.
http://www.chrisvoncsefalvay.com. [20] K. Zale. Sharing property.University of Colorado Law
Review (Forthcoming), 2015.
[21] G. Zervas, D. Proserpio, and J. W. Byers. The Impact of the Sharing Economy on the Hotel Industry: Evidence from Airbnb’s Entry Into the Texas Market. InProceedings of EC’15, pages 637–637. ACM, 2015.