Massive Open On-line Courses in Engineering
Dr. Nafia Al-Mutawaly
Industry Research Chair, Energy Technologies
Mohawk College
[email protected]
Michael Piczak, Project Manager, Energy Research Programs
Mohawk College
[email protected]
Abstract –
A spectrum of terms including remote, distance, blended and massive on line courses (MOOCs) capture the latest trends in teaching/learning from JK to the Ph.D. level. These pedagogical approaches involve combinations of face-to-face, asynchronous, and synchronous delivery of courses to class sizes that can surpass 300,000 students per offering. MOOCs, typically asynchronous, represent an attractive delivery paradigm for small and large institutions alike as economies of scale hold out visions of significant cashflows, promotion of a School’s brand to previously unreachable audiences, democratization of higher education, and enrichment of the planet’s knowledge capital. MOOCs, however, are not without their challenges including: significant commitment and up-front costs, wading into uncharted territory, defense of academic integrity/brand image, handling of hands-on laboratory content and poor completion rates. From students’ perspectives, MOOCs present an attractive and viable alternative permitting study in the convenience of their home accessing resources from the world’s finest academic institutions at competitive costs. This paper will examine the concept of MOOCs with a focus on course completion rates (dependent variable) as a function of class size, academic discipline, evaluation methods, delivery platform and course duration (independent variables). The presented data set (n= 111) is partitioned into three knowledge domains: engineering, management and others to quantify completion rate differences across the three identified categories, with emphasis on the engineering discipline. The paper will also present best practices for delivering engineering courses/labs based on a MOOCs model. Lessons learned from blended/distance course delivery experiences at McMaster University, Bachelor of Technology Program, are extended into the MOOC environment.Keywords:academic delivery platforms, blended learning, engineering labs, MOOCs, on-line courses, pedagogy, completion rates
1.0 INTRODUCTION
Oxford dictionary provides a concise working definition for a MOOC:
“a course of study or degree made available over the internet without charge to a very large number of people. Anyone who decides to take a MOOC simply logs on to the website and signs up.” [1]
Per the Oxford definition, MOOCs can be viewed as an extension of an on-line delivery with class sizes that go beyond what is generally accepted as a “large class”. Class sizes with this on-line modality routinely exceed 50,000 students.
Taking each part of the acronym provides a common frame of reference for this paper:
M – “massive” class cohorts numbering from tens to hundreds of thousands with unlimited scalability
O – “open” to anyone who wishes to participate with no prerequisites, entrance exams, applicant interviews or tuition fees
O – “on-line” delivery over the internet possibly involving the distribution of video clips and downloadable readings, supplemented by plenary discussions, segregated social media activity, and the occasional synchronous event such as a live chat or tutorial
C – “courses” in the form of a series or collection of instructional content delivered over a period of time; courses can be connective (cMOOC) versus transmissive (xMOOC) [2].
While MOOCs are considered to be new, the first broadly acknowledged massive open on-line course was delivered by Stephen Downes and George Siemens to an audience of 2300 at the University of Manitoba on the subject of Connectivism and Connective Knowledge in 2008 [3]. Since then, MOOC style courses have proliferated around the world and grown in size with Udacity recently
delivering an Introduction to Computer Science to 314,000 students in 168 countries. [4]
2. FROM TRADITIONAL CLASSROOM TO
MOOCs
Stable predictors of academic achievement within the traditional face-to-face classroom have long been identified across many studies with selected success factors elevated to the level of mantra. A selective list of positive academic achievement correlates include: self efficacy, degree to which the student remains on task, personal life factors, instrumentality perceptions, vocational intent, co-op, tutoring, academic advice and interventions, communication/feedback frequency and quality, collegiate career centers and class size [5 - 7].
Using early meta analytic methods, Bloom summarized the empirical research that has come to be known as the 2- Sigma problem [8]. In a seminal paper, Bloom set out twenty factors as contributing to improvement in student success. Tutorial instruction as an independent factor contributed two standard deviations of improvement while one sigma improvements were delivered with reinforcement, corrective feedback, cues and explanations, classroom participation, time on task and improved reading skills.
Considerable research has been devoted to understanding the impact of class size on educational outcomes. Large class size as an independent variable can be considered the antithesis of the small group, one-to-one tutorial. Overall findings lean in the direction of suggesting the class size variable is complex with literature review results consistently reported as ‘mixed’ with respect to the relationship between class size and academic achievement [9]. Under selected conditions, it is possible to obtain higher academic outcomes with larger class formats where professors are organized and natural communicators. Where provision is made for small group interaction, rote memory is de-emphasized, and support is provided for independent learning, larger class formats can be accommodated. Despite the empirical evidence and particularly when findings reveal a negative correlation between class size and academic outcomes, most experienced educators would argue that class size is a barrier to academic success for any number of ‘favourite’ reasons. Bottom line: as class sizes become larger, the probability of passing/completing a course is placed at risk. MOOCs appear to represent an attractive delivery option where: class sizes are traditionally large with limited instructor contact or access, course material lends itself to paper and pencil demonstrations of cognitive ability preferably through multiple choice testing, tuition costs represent obstacles or where students are not able to
physically present themselves at distant campuses. With internet availability and affordable computing, MOOCs provide access for millions of students to learn many subjects via distance education. Except where certification of completion is needed, MOOCs represent the no cost option.
For post-secondary academic institutions, MOOCs and on-line delivery represent emerging pedagogical paradigms. The promise of extending an institutional brand to distant locales, generating new sources of cashflow and avoiding capital expenditures for on-campus bricks and mortar facilities represent strong drivers toward this brave new world of education. Nobler objectives include the democratization of education and elevating the level of human capital across the world, with the hope to solve mankind’s challenges. In North America, schools such as Stanford, Harvard, MIT, Georgia Tech and many other post-secondary institutions demonstrate interest in this model of distance education by offering courses/degrees ranging from the arts to engineering from undergraduate to masters level via MOOC format.
The transition to the massive, on-line environment necessitates that factors contributing to sound instructional design and learning/education be understood as the promise and potential damage delivered by MOOCs are amplified by magnitudes in excess of a thousand when on-line class sizes dwarf usual definitions of what constitutes the ‘large class’.
Despite the identified attractions, MOOCs fall short along a number of dimensions particularly where courses aim to build capabilities beyond the accumulation of facts, discussion/argument is required, peer interaction is necessary, and hands-on skills development is critical. Since problem solving, lab components and design concepts represent key elements in most engineering disciplines, MOOCs may not provide the optimal platform for engineering program delivery. For engineering courses, the challenge is to replicate traditional course delivery, typically complemented with labs, in the on-line/MOOC environment by adapting and employing face-to-face success factors within the distance/remote modality. Taken together, factors contributing to academic achievement in the on-line/MOOC environment should be studied, quantified and understood from a number of different perspectives, prior to wholesale implementation of non-traditional delivery of engineering courses and programs.
4.0 MOOC – ADVANTAGES, LIMITATIONS
From a student’s perspective, aside from financial considerations, a number of advantages are delivered by MOOCs including:• study flexibility and convenience
• reviewing a body of knowledge repeatedly in the pursuit of mastery
• connecting with people from across the globe and • taking pride in presenting credentials from world
renowned institutions
Institutionally, the arithmetic is inviting. With course completion rates variously reported at an average of approximately 10% for courses where class sizes typically average tens of thousands and assuming $100 for the issuance of certificates of completion, revenues to be derived from MOOCs often require the aid of a calculator. Despite the potential benefits of MOOCs, numerous concerns have been identified [3, 10]:
•Inability to probe deeply into issues
•Questionable ability to achieve learning outcomes •Value of completion certificates
•High dropout/non-completion rates
•Long term ability to monetize ‘free’ education •Grading is challenging for thousands
•Technical difficulties
•Isolation and lack of attachment to the classroom, campus and institution
•The prospect of millions of individuals being influenced by a single person
5.0 STUDENT COMPLETION RATES
The focus of the immediate study is to examine the experience of MOOC completion rates in the areas of engineering and management, a structure quite typical of many engineering programs in Canada.This study makes use of a comprehensive data set presented through a Ph.D. thesis where the candidate accumulated MOOC completion rates across a range of schools worldwide [11, 12]. Study findings from this thesis were adopted within a report published by the British Department of Business Innovation and Skills and referenced by Open Education Europa, a Division from the European Commission [2, 13].
The dataset used in the immediate analysis (n=111) was clustered into three broad categories: engineering, management and ‘other’. Since the dataset presented only course titles, it was necessary to exercise the authors’ judgments in clustering the courses into engineering, management or ‘other’. The final sample was comprised of 30 engineering courses, 16 management courses and 65 courses classified as ‘other’ (music, education, health care, philosophy).
5.1 Completion Rate Variable Deficiencies
The primary dependent variable in the immediate study is completion rates. Average MOOC completion rates have been reported by various studies ranging from 4% to 15% [2] with individual course completion rates reported at less than 1% and maximums in excess of 50% [12].
Poor completion rates can be attributed to enrollees who are:
• Free riders; no cost enrollment (possibly up to 25%) • Stay-at-home-retirees, parents
• Students seeking an alternate information source • Better than TV
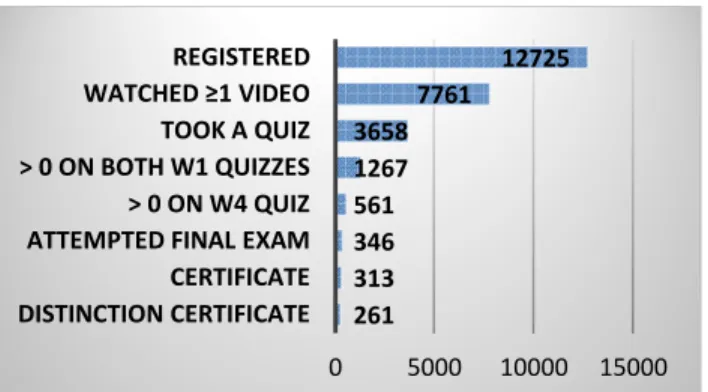
• Looking for knowledge/education rather than credit According to the British Department of Business Innovation and Skills report, a no show rate of 50% was reported for Coursera style MOOCs [2]. A similar no show rate (40%) was recently published by Duke University for a Bioelectricity MOOC [14]. Figure 1.
Figure 1: Duke University Persistence
The no show rates reported above validate educators’ arguments that course completion rates are suppressed by students possessing no intention to even start a course of study. Traditional metrics of higher education therefore may not apply to MOOCs. Stanford mathematician, Keith Devlin, argues that MOOCS are a very different kind of educational package in need of different metrics – metrics that have yet to be constructed [15].
An alternate way to view MOOC success is to measure the absolute number of individuals exposed to a body of knowledge than would otherwise be the case. The argument proceeds from the notion that society benefits by providing free access to thousands of course completers rather than limit access to a small handful of people. A statement made by Rosanna Tamburri summarizes MOOC success rates as follows: “in one Coursera course I’ll teach as many students as I’ve taught in my entire lifetime” [16].
261 313 346 561 1267 3658 7761 12725 0 5000 10000 15000 DISTINCTION CERTIFICATE CERTIFICATE ATTEMPTED FINAL EXAM > 0 ON W4 QUIZ > 0 ON BOTH W1 QUIZZES TOOK A QUIZ WATCHED ≥1 VIDEO REGISTERED
6.0 RESULTS
The dataset used for this study permits an examination of factors that may account for the variation in completion rates across a broad cross selection of courses delivered at a spectrum of institutions across the globe. Sample size totaled 4,043,956 students initially enrolled across 111 courses. Smallest class size was 168 while the largest was 226,652 students.
The primary dependent variable, completion rates, was provided in the dataset along with potential explanatory variables: class size, academic discipline, evaluation methods, delivery platform and course duration.
6.1 Descriptive Data
Table 1 captures the full dataset including the three academic disciplines – engineering, management and other where completion rates reflect considerable variation: 14% for full dataset, 12.7% for engineering, 19.3% for management and 13% for other.
Table 1: Descriptives Study Dataset
Statistic Full Eng. Mgmt. Other
Courses 111 30 16 65 Students 4034956 1452708 416044 2175204 Class size 36432 48424 26002 33464 Std. dev. 43055 45220 34611 43304 Max. 226652 160000 87000 226652 Min. 168 573 391 168 Compl’n Rate 14.0% 12.7% 19.3% 13.3% Std. dev. 11.3% 10.7% 11.9% 11.3% Min. .7% .9% 4.4% .7% Max. 52.1% 52.1% 35.8% 41.6%
6.2 Class Size and Academic Discipline
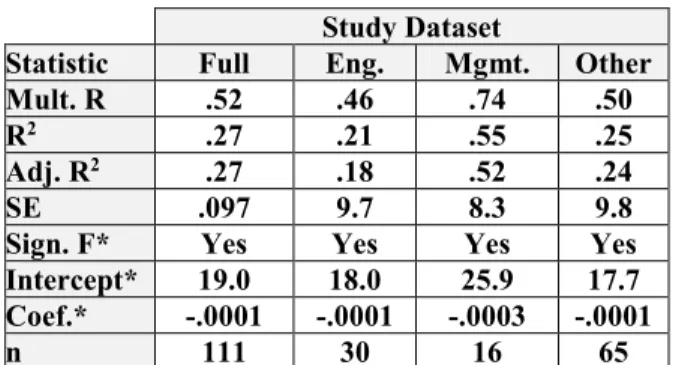
Table 2 shows regression results for completion rates versus class size and academic discipline.
Table 2: Class Size Regression Results Study Dataset
Statistic Full Eng. Mgmt. Other
Mult. R .52 .46 .74 .50
R2 .27 .21 .55 .25
Adj. R2 .27 .18 .52 .24
SE .097 9.7 8.3 9.8
Sign. F* Yes Yes Yes Yes
Intercept* 19.0 18.0 25.9 17.7 Coef.* -.0001 -.0001 -.0003 -.0001
n 111 30 16 65
* All values were significant at the .01 level or less
Findings in Table 2 suggest that class size was a significant factor across all disciplines in affecting completion rates. The analysis leads to the conclusion that class size imparts a negative influence on completion rates. The R2 value for
the full dataset was observed to be 27% suggesting that 73% of the observed variation in completion rates is accounted for by other variables. It might be simplistic to suggest that class size is causal of completion rates particularly in an on-line setting where students may be fully unaware of how many students actually are in a given class. Notwithstanding such a warning, there is no denying that class size is correlated with completion rate, a finding fairly consistent across the various cohorts including the full dataset.
6.3 Evaluation Methods and Delivery Platform
Difference of means tests were conducted comparing completion rates versus evaluation methods and delivery platform. Results showed no significant differences in completion rates across these two variables mainly due to small sample sizes.
6.4 Course Duration
The dataset permitted an examination of completion rates relative to course duration (as measured in weeks). Average course duration in the sample was 6.7 weeks with standard deviation of 3 weeks. It can be noted that engineering courses, as designed, were of the longest duration compared to all other courses.
Table 3: MOOCs Course Duration Study Dataset
Statistic Full Eng. Mgmt. Other Duration
(weeks)
6.7 8.2 5.3 6.3
Std. dev. 3.0 4.08 3.6 2.5
n 111 30 16 65
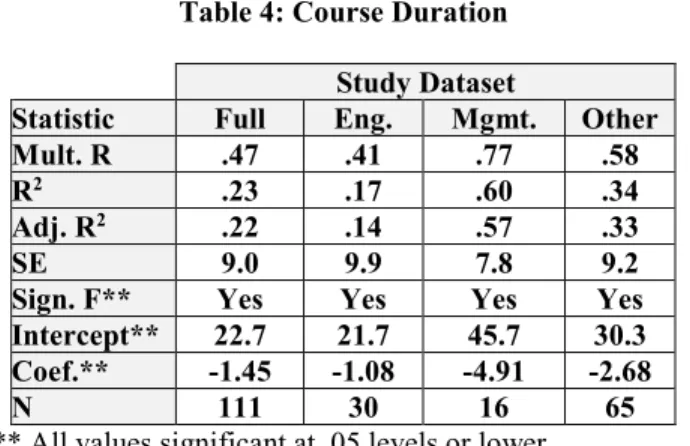
Analysis of course duration versus completion rate is presented in Table 4 with results indicating that completion rates are negatively correlated with course duration (the longer a course lasts, the higher the attrition rate). Results in Table 4 also indicate that course duration has the least impact on engineering course completion rates compared to other disciplines (-1.08 vs. -4.91 and -2.68). Extending a management course by one week results in a reduction of course completion by 4.91%.
Table 4: Course Duration Study Dataset
Statistic Full Eng. Mgmt. Other
Mult. R .47 .41 .77 .58
R2 .23 .17 .60 .34
Adj. R2 .22 .14 .57 .33
SE 9.0 9.9 7.8 9.2
Sign. F** Yes Yes Yes Yes
Intercept** 22.7 21.7 45.7 30.3 Coef.** -1.45 -1.08 -4.91 -2.68
N 111 30 16 65
** All values significant at .05 levels or lower
7.0 CONCLUSIONS AND DISCUSSION
7.1 MOOC Completion RatesCompletion rates in this study (14%) were consistent with outcomes identified in previous studies. The University of Pennsylvania (n = 1 million) and Harvard/MIT (n = 841,000) found completion rates to be 4% and 5% respectively [17, 18]. Literature reviews report MOOC completion rates in the 7%-15% range [2, 19].
While other studies conducted analyses at higher levels of aggregation masking variation across disciplines, the immediate study focused on engineering and management completion rates. It was found that engineering completion rates were somewhat lower than other disciplines (Table 1) perhaps as a reflection of the nature and challenge of the domain.
7.2 Class Size
Class size demonstrated a significant influence on completion rates for all subjects with larger class sizes negatively impacting completion rates. Compared to engineering (R2 = .21) and others (R2 = .25), it was also
noted that class size exerts the highest impact (R2 = .55) on
completion rates for management courses (Table 2). For engineering courses, class size may pose an even greater problem, particularly where labs are involved, as MOOCs may not be capable of delivering hands-on learning outcomes.
7.3 Discipline
Discipline exerted a differential impact on completion rates however, these differences were not significant with engineering reporting the lowest rate (Table 1). For engineering courses, on-line delivery and MOOCs may well work for selected subjects including mathematics, statistics, engineering economics, project management, software, dynamics, and basic electric circuits among others. However, courses involving labs may not be well served by an on-line environment [10]. This applies to courses such as: heat transfer, strength of materials,
thermodynamics, statics, fluids, solids, and power systems engineering and others.
7.4 Evaluation Method and Platform
No significant effects were found for evaluation method and delivery platform on completion rates. Small sample sizes and the absence of theoretical rationale may account for the lack of effect.
7.5 Course Duration
Consistent with other researchers’ findings [2, 12], the study has shown that courses of longer duration impede the completion rate across all subject domains. However, engineering, courses were found to possess the longest course durations along with the lowest attrition rates over time. Table 4 illustrates that each week of engineering course duration results in a 1% loss in completion rate, compared to 5% for management and 2.7% for others. 7.6 Impact of No Shows
The conducted analysis made no attempt to correct or adjust for bias introduced by no shows. It is felt that coefficients found and significant effects noted would not be affected by the ‘no show’.
8.0 RECOMMENDATIONS
1. MOOCs may lend themselves to the delivery of theoretical and qualitative engineering courses. 2. For basic engineering courses, educators should
consider experiment kits and simulation software to capture lab components.
3. To accommodate advanced engineering courses with lab components, a compressed lab format with a number of days on campus may convey the expected learning outcomes.
4. Although some institutions are aggressively adopting MOOCs (Georgia Tech’s recent masters degree), it is recommended that institutes move carefully and deliberately in adopting this new delivery model. 5. Movement in the direction of on-line/MOOC
delivery should be mindful of accreditation body concerns related to the achievement of learning outcomes.
6. It is recommended that more MOOC research and analysis be conducted.
ACKNOWLEDGEMENTS
This work was done with the support of NSERC IE grant awarded September 2011 to Mohawk College, Hamilton, Ontario.
REFERENCES
[1] The Oxford English Dictionary, 2014.[2] Department for Business Innovation and Skills, BIS Research Paper 130, The Maturing of the MOOC, Literature Review of Massive Open Online Courses and Other Forms of Online Distance Education Learning, 2013 [3] Yuan, L., Powell, S.,
MOOCs and Open Education:
Implications for Higher Education, A White Paper,
Center
for
Educational
Technology
and
Interoperability Standards, University of Bolton,
2013.
[4] Junn, E., Challenges & Opportunities in Adopting Online Learning Platforms, UC Berkeley-Harvard-MIT-Stanford Online Learning Summit
March 8, 2014
[5] Hein, V., Smerdon, B., Sambolt, M., Predictors of Post Secondary Success, American Institutes for Research, 2013.
[6] Almaraz, J., Bassett, J., Sawyer, O. (2010). Transitioning Into a Major: The Effectiveness of an Academic Intervention Course. Journal of Education for Business.
[7] Breso, E., Schaufeli, W.B., Salanova, M.M. (2010). Can a self-efficacy-based intervention decrease burnout, increase engagement, and enhance performance? A quasi-experimental study. Published with open access at Springerlink.com.
[8] Bloom, B., The Two Sigma Problem: The search for Methods of Group Instruction as Effective as One-to-One Tutoring Educational Researcher, 1984
[9] Monks, J. & Schmidt, R. (2010). The impact of class size and number of students on outcomes in higher education[Electronic version]. Retrieved [insert date], from Cornell University, School of Industrial and Labor Relations site:
http://digitalcommons.ilr.cornell.edu/workingpapers/114/ [10] Educause, What Campus Leaders Need to Know About MOOCs, 2013
[11] Jordan, K., Dataset
http:/the/www.katyjordan.com/moocproject.html [12] Jordan, Katy (2014). Initial trends in enrolment and completion of massive open online courses. International Review of Research in Open and Distance Learning, 15(1) pp. 133–160.
[13] Open Education Europa, European Commission, European MOOCs Scoreboard, 2014
[14] Belanger, Y., Thornton, J., Bioelectricity: A Quantitative Approach Duke University’s First MOOC February 5, 2013, Duke Center for Instructional Technology.
[15]Devlin, K., MOOCs and the Myths of Dropout Rates and Certification, 2013
http://www.huffingtonpost.com/dr-keith-devlin/moocs-and-the-myths-of-dr_b_2785808.html
[16] Gaebel, M., MOOCs – Massive Open Online Courses, January 2014, European University Association.
[17] Perna, L., Boruch, R., Wang, N., Scull, J., Evans, C., Ahmad, S.,The Life Cycle of a Million MOOC Users, University of Pennsylvania, 2013
MOOC Research Conference,
http://www.gse.upenn.edu/pdf/ahead/perna_ruby_boruch_ moocs_dec2013.pdf
[18] Ho, A. D., Reich, J., Nesterko, S., Seaton, D. T., Mullaney, T., Waldo, J., & Chuang, I. (2014). HarvardX and MITx:, The first year of open online courses (HarvardX and MITx Working Paper No. 1).
[19] Gaebel, M., MOOCs – Massive Open Online Courses, January 2013, European University Association.