University of Kentucky University of Kentucky
UKnowledge
UKnowledge
Theses and Dissertations--Agricultural
Economics Agricultural Economics
2013
Financial Inclusion and Natural Disasters
Financial Inclusion and Natural Disasters
Benjamin L. CollierUniversity of Kentucky, [email protected]
Right click to open a feedback form in a new tab to let us know how this document benefits you. Right click to open a feedback form in a new tab to let us know how this document benefits you. Recommended Citation
Recommended Citation
Collier, Benjamin L., "Financial Inclusion and Natural Disasters" (2013). Theses and Dissertations--Agricultural Economics. 14.
https://uknowledge.uky.edu/agecon_etds/14
This Doctoral Dissertation is brought to you for free and open access by the Agricultural Economics at UKnowledge. It has been accepted for inclusion in Theses and Dissertations--Agricultural Economics by an authorized administrator of UKnowledge. For more information, please contact [email protected].
STUDENT AGREEMENT: STUDENT AGREEMENT:
I represent that my thesis or dissertation and abstract are my original work. Proper attribution has been given to all outside sources. I understand that I am solely responsible for obtaining any needed copyright permissions. I have obtained and attached hereto needed written permission statements(s) from the owner(s) of each third-party copyrighted matter to be included in my work, allowing electronic distribution (if such use is not permitted by the fair use doctrine).
I hereby grant to The University of Kentucky and its agents the non-exclusive license to archive and make accessible my work in whole or in part in all forms of media, now or hereafter known. I agree that the document mentioned above may be made available immediately for worldwide access unless a preapproved embargo applies.
I retain all other ownership rights to the copyright of my work. I also retain the right to use in future works (such as articles or books) all or part of my work. I understand that I am free to register the copyright to my work.
REVIEW, APPROVAL AND ACCEPTANCE REVIEW, APPROVAL AND ACCEPTANCE
The document mentioned above has been reviewed and accepted by the student’s advisor, on behalf of the advisory committee, and by the Director of Graduate Studies (DGS), on behalf of the program; we verify that this is the final, approved version of the student’s dissertation including all changes required by the advisory committee. The undersigned agree to abide by the statements above.
Benjamin L. Collier, Student Dr. Jerry R. Skees, Major Professor Dr. Michael Reed, Director of Graduate Studies
Financial Inclusion and Natural Disasters
Dissertation
A dissertation submitted in partial fulfillment of the requirements for the degree of Doctor of Philosophy in the College of Agriculture, Food and Environment at the University of
Kentucky
By
Benjamin L. Collier
Co-Directors: Dr. Jerry Skees, H.B. Price Professor of Policy and Risk
and Dr. Mario Miranda, Andersons Professor of Finance and Risk Management
Lexington, KY
Abstract of Dissertation
Financial Inclusion and Natural Disasters
This dissertation explores the implications of natural disaster risk for access to financial services, especially credit. Its results show that disasters can dramatically undermine the ability of financial intermediaries (FIs) to lend after an event, increasing the cost of the dis-aster and delaying recovery. Moreover, the risk of natural disdis-asters discourages investment in vulnerable regions and economic sectors and so slows economic development. Financial risk transfer mechanisms such as insurance can help maintain lending following an event. While many international development projects have targeted disaster insurance markets to households, managing disaster-related credit risk may be done more effectively through insurance products for FIs. Additionally, prudential supervision and the credit risk rating methods of investors in developing and emerging economies are dominated by developed country standards that overlook natural disaster risks. Public and private interests align in the need to tailor such standards and so enhance the effectiveness with which vulnerable FIs manage disaster risk.
Keywords: Inclusive Finance, Natural Disasters, Risk and
Insurance, International Development, Banking Policy
Benjamin Collier Student’s Signature April 19, 2013 Date
Financial Inclusion and Natural Disasters By Benjamin L. Collier Dr. Jerry Skees Co-Director of Dissertation Dr. Mario Miranda Co-Director of Dissertation Dr. Michael Reed Director of Graduate Studies April 19, 2013
To Brittany Collier for your consistent and generous kindness, love, and support.
To Jane Collier for making my life brighter. You were born two days before my defense and, ever since, have made the world spin faster.
To Robert and Joan Collier for modeling how to live with love, wisdom, compassion, and integrity.
ACKNOWLEDGEMENTS
The following dissertation, while an individual work, benefited from the insights and di-rection of several people. First, I want to acknowledge Jerry Skees, Dissertation Co-chair, adviser, boss, and friend. Jerry, you have an unmatched ability to see the next step first. I will always be grateful to you for taking a chance on me and helping me flourish. Also, Mario Miranda, Dissertation Co-chair, enhanced the technical quality of this work. Mario, you made the dissertation more interesting and fun, thanks. Finally, I wish to thank the complete Dissertation Committee, and outside reader, respectively: Leigh Maynard, Paul Shea, and Dwight Denison. Each individual provided insights that guided and challenged my thinking, substantially improving the finished product.
TABLE OF CONTENTS
Acknowledgements . . . .
List of Tables . . . iv
List of Figures . . . v
Chapter 1 Introduction . . . 1
1.1 Introduction and objectives . . . 1
1.2 Methodology . . . 5
1.3 Structure . . . 7
Chapter 2 Natural Disasters and Credit Supply Shocks . . . 10
2.1 Introduction . . . 10
2.1.1 Background and literature review . . . 11
2.1.2 Model . . . 16
2.2 Methods . . . 18
2.2.1 Financial intermediary calibration . . . 19
2.2.2 Risk survey and expected losses . . . 20
2.2.3 Probability of severe El Ni˜no . . . 22
2.2.4 El Ni˜no insurance . . . 25
2.2.5 Solution techniques . . . 25
2.3 Results . . . 26
2.3.1 Lender simulation, retaining risk . . . 26
2.3.2 Capital constraints and the 1998 El Ni˜no . . . 26
2.3.3 Lender simulation, transferring risk . . . 29
2.4 Discussion . . . 29
Chapter 3 Household Production, Disasters, Credit and Insurance . . 33
3.1 Introduction . . . 33
3.1.1 Background and paper structure . . . 34
3.1.2 Northern Peru and severe El Ni˜no . . . 37
3.2.1 Households . . . 38
3.2.2 Lender . . . 39
3.2.3 Insurer . . . 40
3.2.4 Summary . . . 42
3.3 Household production and credit in northern Peru . . . 42
3.4 Relaxing assumptions . . . 46
3.4.1 Increased short-term borrowing costs . . . 47
3.4.2 Index insurance and basis risk . . . 48
3.4.3 Index insurance under limited default . . . 53
3.4.4 Summary . . . 58
3.5 Conclusion . . . 58
Chapter 4 Inclusive Finance and Systemic Risk Policy . . . 60
4.1 Introduction . . . 60
4.2 The Basel Accords and international standards . . . 62
4.3 Inclusive finance in developing and emerging economies . . . 63
4.3.1 Lending model . . . 64
4.3.2 International investments and inclusive finance . . . 65
4.3.3 Systemic credit risks in developing and emerging economies . . . 66
4.3.4 Inclusive finance summary . . . 71
4.4 Determinants of IFI capital reserves . . . 71
4.4.1 Model Estimation . . . 71
4.4.2 Results . . . 73
4.5 Inclusive finance and public and private supervision . . . 74
4.5.1 Flexibility in systemic risk management . . . 76
4.5.2 Risk sensitivity . . . 77
4.5.3 Implications of the Basel Accords for IFIs . . . 78
4.6 Alternatives to the status quo and recommendations . . . 82
4.6.1 Enhancing risk estimates . . . 83
4.6.2 Increasing flexibility in risk management . . . 84
4.7 Conclusion . . . 88
Chapter 5 Conclusion . . . 89
5.2 Limitations and extensions . . . 93
References . . . 106
LIST OF TABLES
2.1 Calibration summary . . . 19
2.2 Expected loan losses . . . 21
3.1 Cash flow for loan with deferment clause . . . 40
3.2 Household cash flow for loan with forgiveness clause . . . 41
3.3 Summary statistics . . . 43
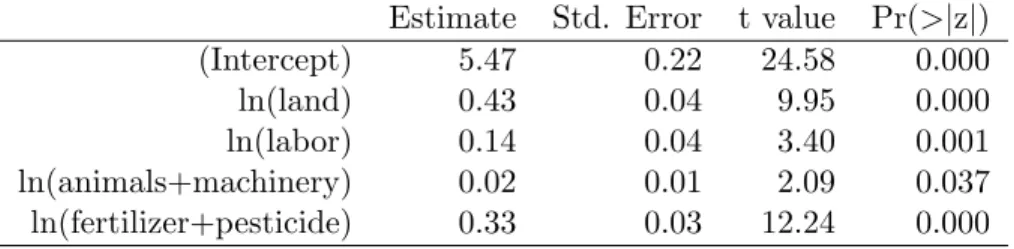
3.4 Agricultural production function . . . 43
3.5 Sample means before and after propensity score matching . . . 46
3.6 Effect of credit constraints on production allocations . . . 46
3.7 Effect of Distance on Rainfall Estimation Error . . . 51
3.8 Reasons identified for distressed land sales . . . 55
3.9 Logit predicting distressed land sales. . . 57
4.1 Legal status of MIX Market sample . . . 64
4.2 Systemic Risks by Development Category . . . 68
4.3 Likelihood ratio test . . . 72
LIST OF FIGURES
2.1 Deterministic solution . . . 18
2.2 Ni˜no 1+2 Index . . . 23
2.3 Histogram and GEV distribution . . . 24
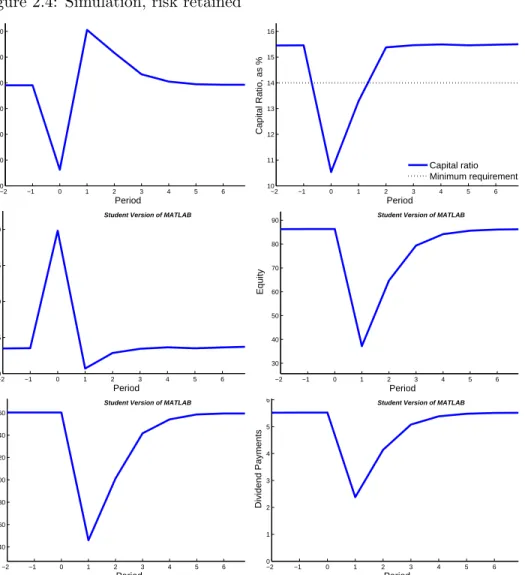
2.4 Simulation, risk retained . . . 27
2.5 Financial intermediary capital ratios and the 1998 El Ni˜no . . . 28
2.6 Simulation, insured . . . 30
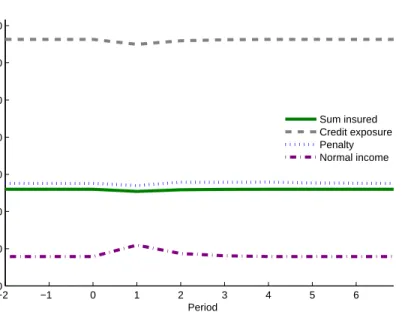
2.7 Risk and sum insured . . . 31
3.1 Weather Stations . . . 50
3.2 Lender Index and Error . . . 52
Chapter 1. Introduction
1.1. Introduction and objectives
This dissertation is part of my broader research program regarding the effects of natu-ral disasters on development-oriented investment in developing and emerging economies. Specifically, the dissertation explores the implications of natural disaster risk for access to financial services, especially credit. Its results show that disasters can dramatically under-mine the ability of financial intermediaries (FIs) to lend after an event, increasing the cost of the disaster and delaying recovery. Moreover, the risk of natural disasters discourages investment in vulnerable regions and economic sectors and so slows economic development. Financial risk transfer mechanisms such as insurance can help maintain lending following an event. While many international development projects have targeted disaster insurance markets to households, managing disaster-related credit risk may be done more effectively through insurance products for FIs. Additionally, prudential supervision and the credit risk rating methods of investors in developing and emerging economies are dominated by developed country standards that overlook natural disaster risks. Public and private inter-ests align in the need to tailor such standards and so enhance the effectiveness with which vulnerable FIs manage disaster risk. The dissertation is organized around four objectives.
Objective 1: Identify the challenges that natural disasters create for FIs because of their important role in channelling investments.
Natural disasters challenge development in developing and emerging economies. A variety of microeconomic and institutional foundations may explain the increased vulnerability of these economies. First, they tend to participate in at-risk sectors such as agriculture and tourism (Loayza et al., 2012). Agriculture accounts for 22% of GDP and 53% of the labor force for countries ranked “low” on the United Nations Human Development Index (HDI), compared to 2% of GDP and 5% of the labor force for “very high” HDI countries.1 Second,
1
due to limited access to financial risk management mechanisms, especially insurance, house-holds tend to be more interdependent, especially in rural communities (Townsend, 1994). Some communities develop complex risk sharing arrangements that facilitate management of idiosyncratic risks (Dercon, 2002; Fafchamps and Lund, 2003). These arrangements tend to break down during natural disasters as many individuals in the community need help concurrently (Dercon, 2004; Townsend, 1994). Third, many cities in developing and emerg-ing economies are strugglemerg-ing to accommodate rapid urbanization, leademerg-ing the urban poor to settle undesirable land such as in low-lying areas and steep hillsides (Stern, 2007). These communities are also vulnerable due to members residing in less durable structures as well as a lack of public sanitation and other services. Fourth, the outreach of social safety nets is often limited. While international aid agencies partially offset insufficient developing coun-try relief budgets, aid can be slow. For example, Lentz et al. (2013) estimate emergency food aid shipments arrive over five months, on average, after aid is requested. Finally, not only are these countries more vulnerable to disaster events but severe weather tends to occur more frequently. Many developing countries are in tropical regions, which experience higher temperatures but also greater rainfall variability (Brown and Lall, 2006). Rainfall is often concentrated in a single season, increasing the risk of drought and excess rain and flooding.
Macroeconomic research generally suggests that severe natural disasters negatively af-fect growth. Previous literature reports conflicting results, that disasters have negative (Rasmussen, 2004), positive (Skidmore and Toya, 2002), or neutral (Cavallo et al., 2010) effects on growth; however, recent studies use more detailed datasets to disaggregate effects and explain these results (Loayza et al., 2012; von Peter et al., 2012; Noy, 2009). For ex-ample, Loayza et al. (2012) demonstrate that individual economic sectors differ regarding their vulnerability to natural disasters. Agricultural growth is more vulnerable to drought; industrial growth to flood. More generally, this literature identifies two offsetting effects of disasters on growth. First, disasters reduce the stock of productive capital and so reduce total output. Following neoclassical models, the marginal product of capital increases as its absolute level falls. This dynamic leads to the second effect: reinvestment after the event stimulates the economy and generates higher returns. Noy (2009) finds that the net effect of a disaster is significantly determined by the ability of an economy to mobilize reinvestment. This reinvestment capacity is positively associated with literacy rates, income per capita, openness to trade, government size, and institutional quality. Thus, recent research
sug-gests that severe disasters tend to negatively affect growth because losses exceed a country’s capacity to reconstruct (Loayza et al., 2012; von Peter et al., 2012; Hallegatte et al., 2007). This research also demonstrates that the negative consequences of disasters are greater in developing and emerging economies, likely because of 1) increased vulnerability as described above, and 2) a limited capacity to mobilize reinvestment.
These results suggest that the resilience of investment channels to natural disasters may have significant implications for the effects of these events on an economy. Macroeconomic evidence from Noy (2009) indicates that while domestic stock market capitalization does not improve disaster recovery, domestic credit markets do. Thus, mobilizing investments for micro, small, and medium enterprises may be particularly important for recovery. A clearer understanding of microeconomic mechanisms that drive these macroeconomic results is needed.
Objective 2: Evaluate the potential of insurance to reduce disaster-related dis-ruptions in credit provision.
Not only do natural disaster events reduce growth, but the risk of these events delays development. For example, Skidmore and Toya (2002) note that disaster vulnerability motivates economies to substitute away from physical capital investments toward human capital. Given the Cobb-Douglas production functions typically used in production and growth theory (e.g.,f =kαhβ wherekis physical capital,hhuman capital, f total output, and α+β ≤1), constraints on one factor will tend to reduce overall productivity. At the producer level, disaster risk has also been shown to lead to production decisions that reduce overall output. For example, Rosenzweig (1992) demonstrates that lower risk strategies reduced farmers’ expected returns by one third in Andhra Pradesh. Disaster risk reduces credit investment in vulnerable regions and sectors such as agriculture, as well (Boucher et al., 2008; Hazell et al., 1985). Socially oriented investments intended to increase financial inclusion have increased exponentially in recent years (Consultative Group to Assist the Poor, CGAP, 2011b); however, vulnerable regions and sectors often remain excluded.
Risk transfer mechanisms such as insurance may be particularly helpful in facilitating access to credit for vulnerable groups (Skees et al., 2007). While a variety of risk manage-ment strategies, such as diversification and holding excess reserves, can reduce disaster risk, financial mechanisms such as insurance seem particularly well-suited to complement credit. Moreover, von Peter et al. (2012) show that it is uninsured losses that lead to negative
growth after a disaster. Perhaps because insurance facilitates reconstruction, well-insured disasters neutrally or even positively affect growth. Thus, insurance may play a dual role by both reducing disaster losses for the insured and increasing investment opportunities and output more generally.
Objective 3: Compare the developmental implications of designing insurance products for households versus FIs to manage disaster-related credit risk.
The international development community has invested a great deal in testing the poten-tial of insurance markets to address disaster risks in developing and emerging economies (Miranda and Farrin, 2012; Murphy et al., 2011). These projects have primarily used index insurance, a type of insurance that bases payments on an objective measure of a disaster (e.g., weather station data to estimate drought) and so can be used in a variety of contexts where traditional insurance is infeasible. Insurance for households predominate donor-funded index insurance projects, and some have tested bundling insurance with credit contracts to address disaster-related credit risk (Carter, 2009; Global Facility for Disaster Reduction and Recovery, GFDRR, 2011).
Experience suggests that many institutional constraints and high costs challenge the de-velopment of insurance markets for households. The costs include household-level capacity building and delivery of small-value insurance products. With some exceptions, the scalabil-ity and sustainabilscalabil-ity of household-level index insurance projects are unclear; many markets will not survive when donor support ends. Moreover, emphasis has been placed on index insurance as a developing country proxy for developed country agricultural insurance. That model focuses on protecting insureds from yield risk associated with a single crop in a single season, but often ignores what the growth literature indicates is the primary economic con-sequence of natural disasters, physical capital losses. The focus on income for specific crops is over emphasized and has limited the relevance of index insurance for managing disaster risks, leading to serious questions regarding its value for development (Binswanger-Mkhize, 2012). These observations have motivated some researchers to rethink their approach in recent years by orienting it toward conditions that lead to viable markets (e.g,. Miranda and Gonzalez-Vega, 2011; Skees and Barnett, 2006; Skees, 2008)
Because of the flexibility of index insurance, these contracts can be used directly by FIs rather than their borrowing households and firms. Targeting disaster insurance to FIs has the potential to overcome the challenges to private-sector viability described above.
Insurance for FIs would not address many of the economic hardships that households and firms experience because of a disaster. Still, insurance that manages the disaster-related loan losses experienced by FIs may preserve their ability to provide credit to these households and firms after a disaster. Because lower income households and small firms are often the targeted beneficiaries of development projects, a better understanding of the effects of lender-level disaster insurance on credit markets is needed.
Objective 4: Evaluate the incentives of FIs to manage disaster risk in socially desirable ways.
FI resilience has positive public externalities; likewise, FI failure can adversely affect de-positors, create contagion in the financial sector, and reduce economic productivity. FIs also tend to be highly leveraged firms, increasing incentives of liability holders to manage large losses. As a result, the priorities and approaches FIs adopt for managing systemic risk are largely influenced by regulating supervisors and FI investors. Regulating supervisors impose prudential standards to align the incentives of FIs with those of the public (Basel Committee on Banking Supervision, BCBS, 2006, 2011b). While the financial sectors of developing and emerging economies may face quite different risks, these economies tend to adopt the Basel Accords, international banking standards developed for the largest banks in developed countries (Financial Stability Institute, 2010). Those standards focus on the role of large FIs in the global economy and so tend to overlook risks with regional effects such as natural disasters. Similarly, credit rating agencies and investors often use credit risk protocols designed for developed country FIs (e.g., those from Standard & Poor’s and Moody’s) to evaluate FIs in developing and emerging economies, despite differences in the risks faced by these firms. This practice of adopting developed country approaches would seem to create a paradigm in vulnerable developing and emerging economies where manag-ing disaster-related credit risk has private and public benefits but FIs are not incentivized to do so.
1.2. Methodology
Addressing these objectives requires a combination of theoretical and empirical research and policy analysis. The theoretical research involves two elements. First, I intend to specify a dynamic model of a representative FI that allows for examining FI performance under risk
while simulating natural disasters. This model is intended to identify a mechanism that helps explain the empirical macroeconomic results described above. Second, I intend to ap-ply neoclassical growth models to evaluate the contribution to development of alternative insurance products. Regarding policy analysis, I intend to review international banking standards and research on how it is applied in developing and emerging economies to eval-uate its implications for managing disaster risk. If possible, this analysis will also include evaluation of private sector monitoring mechanisms such as credit risk rating methodologies; however, access to private sector mechanisms is likely more difficult to acquire.
The empirical research in this dissertation draws heavily from my field work in northern Peru where severe El Ni˜no events cause torrential rains and flooding. Along the Pacific coast, northern Peru is arid with good soils and irrigated agriculture, making it one of the most productive agricultural regions in Peru, employing 37% of the workforce, which almost exclusively works on small farms of less than 10 hectares (Instituto Nacional de Estad´ıstica e Inform´atica, 2007; Trivelli, 2006). Moving from the coast eastward, the region is dominated by tree crops such as coffee and cocoa as the terrain changes quickly to semi-tropical small mountains. Farther east are the high Andes where agriculture supports local consumption. Fifty-four percent of the population in Piura, a large region in the north, is at or below the poverty line (Instituto Nacional de Estad´ıstica e Inform´atica, 2007). Credit is an important component of livelihood enhancement for households in the region, and organizations providing micro- and small-enterprise loans have grown significantly in recent years. For example, the loan portfolio of Caja Piura, one of the largest municipal banks in the region, grew from USD 3 million in January 1994 to USD 566 million in December 2012.2 During the last severe El Ni˜no, which occurred in 1998, rainfall in northern Peru was roughly forty times normal levels for the months January to April (Skees and Murphy, 2009). As a result, agricultural production declined by 30 percent (Cruzado Silveri, 1999). Extreme flooding damaged or destroyed roads, bridges, reservoirs, irrigation systems, and other public infrastructure, disrupting trade and creating additional losses for enterprises in the region. This diverse set of consequences translated into poor loan performance for FIs.
1.3. Structure
The dissertation is structured as three papers. The first paper, Chapter 2, pursues the objective of identifying the challenges that natural disasters create for FIs. It models the disruptions in credit markets created by disaster-related loan losses that constrain FIs. In this paper, I develop a dynamic, stochastic model to evaluate FI performance under risk and simulate disaster events. Investors and regulating supervisors monitor FIs using minimum capital requirements. These standards require that the size of risky investments such as loans held by an FI do not exceed its equity holdings by a certain factor. Minimum capital requirements have the effect of limiting the size of an FI based on its stock of equity. The model is calibrated for a representative Peruvian FI that specializes in microfinance and is vulnerable to severe El Ni˜no. Using the results from Collier (2010) as a reference, I update exposure estimates for this FI, developing and implementing a survey instrument administered to its credit risk managers operating in the vulnerable region. Solving the specified model requires numerical techniques. Its results show that loan losses erode the equity of an FI and because of minimum capital requirements, FIs contract credit after a natural disaster. Because of the risk of falling below capital minimum requirements, FIs hold a capital buffer in excess of the required minimum. This buffer has the result of reducing the level of loans supplied under non-disaster conditions.
Chapter 2 also addresses the second objective of the dissertation by modeling the effect of insuring against severe El Ni˜no on FI operations. By protecting the FI, the insurance mo-tivates it to reduce its capital buffer and so increase lending during non-disaster conditions. When a disaster leads to loan losses, an insurance payment protects the equity of the FI and so maintains the provision of credit after the event. This result provides additional in-sight into the macroeconomic findings by Noy (2009) and von Peter et al. (2012) and seems to suggest that if FIs manage disaster-related loan losses through insurance, it is likely to reduce the total cost of a disaster by enhancing an economy’s reinvestment capacity.
Chapter 3, the second paper, addresses the third objective of the dissertation, compar-ing the implications for development of managcompar-ing disaster-related credit risk uscompar-ing products designed for households versus those for FIs. I use a neoclassical growth model as a foun-dation for evaluating household cashflows under different product structures. This paper considers several scenarios. The first is that financial markets are unconstrained and FIs can access additional investments if borrowers fail to repay. Under this condition, FIs can
fully manage disaster-related credit risk through access to international markets. Insurance does not add value. In the second scenario, FIs face high short-term borrowing costs so that if households must delay loan repayment, FIs incur additional costs of meeting their own liabilities. Under this condition, insurance reduces the cost of providing credit to borrowers vulnerable to disasters, lowering borrower interest rates. This benefit is the same regardless of whether insurance is designed to be purchased by borrowing households or the FI. In the third scenario, I formulate the insurance product as index insurance and so introduce basis risk — the risk that the measurement of the disasters will differ from that experi-enced by the insured. Products designed for borrowing households would use the weather station closest to their property as their index while FIs would use a network of weather stations weighted based on their loan allocations. Using properties of estimators, I show that the FI index has lower basis risk than the index for households. Reducing basis risk reduces the cost of the event for households so the insurance for FIs, who pass costs and benefits to households through the loan contract, is preferred. Fourth and finally, I evalu-ate a condition of limited default in which the disaster causes only a portion of vulnerable borrowers to default, but which vulnerable borrowers will default is not known ex ante. In some index insurance pilots, microfinance institutions require all borrowers to insure. Under this scenario, insurance designed for borrowing households will tend to over insure credit losses from the disaster. Model comparisons show that insurance for FIs reduces the cost of managing disaster-related credit risk for households when compared to household-level insurance.
Chapter 4, the third paper, addresses the fourth objective of the dissertation, evaluating the incentives of FIs to manage disaster risks. This paper describes the evolution of invest-ment in inclusive finance — financial services targeted at groups traditionally underserved by financial markets, such as the poor, agricultural producers, women, the disabled, etc. — and demonstrates that developing countries, the primary focus of financial inclusion, are most vulnerable to natural disasters, making disaster risk an important issue for sustain-able development. The paper also reviews international banking standards such as the Basel Accords, their intended purpose, and how they are implemented. It explores the question of how well these standards protect FIs specializing in inclusive finance from the systemic risks to which they are exposed, especially natural disaster risk. By relying so heavily on minimum capital requirements, international standards may actually exacerbate disaster losses by motivating FIs to contract lending after the event. The paper also examines the
determinants of capital reserves using data on over 900 FIs specializing in inclusive finance. Paper results show theoretically and empirically that prudential standards do not tend to be sensitive to risks faced by these FIs. Vulnerable developing and emerging economies would likely benefit from public and private banking policies that recognize a broader set of approaches to managing natural disaster risk, including ones that are less disruptive to the provision of credit. The paper concludes with specific recommendations for investors and regulating supervisors.
Chapter 2. Natural Disasters and Credit Supply Shocks
2.1. Introduction
This paper explores the consequences of natural disaster risk for financial intermediaries (FIs), particularly in the context of developing and emerging economies where financial markets are underdeveloped. We model a representative, dynamically optimizing lender managing a stock of equity capital to maximize divided payments to its shareholders. The model is calibrated using data from a Peruvian FI that specializes in microfinance and is vulnerable to the risk of severe El Ni˜no, an event that brings torrential rains and flooding to northern Peru. The model demonstrates that loan losses from the event destroy the capital of the lender. Following the disaster, the lender reduces loan allocations, bringing them in line with a smaller capital base but also limiting access to credit for borrowing households and firms. Retained earnings allow the lender to recover after several periods, returning to pre-disaster levels of lending. Because of the business disruptions created by disaster losses, the risk of these events leads the lender to maintain capital reserves in excess of the amount required by the regulating supervisor. This strategy has the effect of reducing the supply of credit in non-disaster conditions and limiting profits and growth of the FI.
Additionally, we consider an insurance-like mechanism that would transfer the disaster risk of the FI. FIs in Peru can now purchase El Ni˜no insurance, and we evaluate this mechanism in the model calibrated for the Peruvian microfinance intermediary. Results indicate that, when a severe El Ni˜no occurs, insurance payouts offset capital losses. By protecting the lender’s equity capital, insurance prevents the credit contraction described above. As a result of managing its disaster risk with insurance, the lender maintains a lower capital ratio, increasing its loan allocations. Insurance against natural disasters seems to facilitate the lender’s objective of maximizing shareholder dividends. It also leads to the desirable public policy outcome of more consistent access to credit. Based on this research, a large microfinance intermediary in Peru has insured against El Ni˜no for the past two years.
2.1.1. Background and literature review
A substantial body of theoretical and empirical research demonstrates that the financial system can play an important role in promoting economic growth (e.g., King and Levine, 1993). These benefits are seen across stages of development and firm size (Alfaro et al., 2004; Beck and Levine, 2004; Beck et al., 2008). For example, Fafchamps and Sch¨undeln (2013) demonstrate that credit increases firm growth and firm entry and reduces the likelihood of firm exit in Morocco. Moreover, while microfinance will not solve the challenges of poverty and inequality, access to financial services for poor households and other underserved mar-kets also seem to contribute to productivity and other socially desirable outcomes (Banerjee et al., 2009; Bauchet et al., 2011; Kaboski and Townsend, 2011). Thus, this paper is built on the premise that broad, accessible credit markets benefit communities and their economies and that increasing the resilience of these markets against systemic shocks is in the interest of both public and private stakeholders.
Capital reserves and systemic risk
In banking, capital is the value of the FI held by its long-term investors with subordinated claims. This capital is primarily shareholder equity; however, international banking stan-dards identify several other forms such as long-term subordinated debt (Basel Committee on Banking Supervision, BCBS, 2011b; 2006).
Capital is an important concept in the context of managing systemic risk as it identifies the losses an FI can sustain and remain solvent. Central to prudential banking standards are minimum capital requirements, a rule that the ratio of capital to risky investments such as loans cannot fall below a certain level (e.g., 8%). This rule has the effect of limiting the size of an FI based on its stock of capital. Unregulated or limitedly regulated FIs may face similar requirements from their liability holders. FIs operating with low capital ratios will tend to pay high borrowing rates or may be refused credit altogether. As a point of reference, 44% of FIs reporting to MIX Market (2013), an international database of FIs offering microfinance, are not regulated.
Capital is a binding constraint for many FIs in developing and emerging economies. Socially oriented investing has rapidly increased access to funds for FIs targeting under-served markets. For example, cross-border investments in financial inclusion grew from about $2 billion in 2005 to $25 billion in 2011 (Consultative Group to Assist the Poor,
CGAP, 2012). Yet, these investors are primarily holding liabilities and only willing to invest equity in the largest, most secure FIs (MicroRate, 2011). To grow, FIs that cannot attract new capital must reinvest income in the firm.
Systemic credit risks are those events which create repayment problems for many bor-rowers concurrently, such as a macroeconomic crisis. Systemic events create loan losses that erode the capital of FIs. Peek and Rosengren (1995) use a static model to consider the response of an FI when its capital ratio falls below some minimal threshold. They demon-strate that as the capital constraint becomes binding, the FI must reduce the size of its assets and liabilities. In a dynamic context, FIs experiencing a low capital ratio will tend to originate fewer new loans. Reducing the level of loans originated reduces income, slowing recovery. This dynamic leads Van den Heuvel (2009) to conclude that: “The main cost of under-capitalization to the bank is thus that it must forgo profitable lending opportunities.”
Capital supervision and its opportunity cost
Prudential standards relying on capital requirements can create moral hazard, depending on how they are enforced. Calem and Rob (1999) describe a U-shaped pattern in risk taking where FIs operating close to the specified minimum capital requirements take less risk. Those operating with high capital ratios have incentives to increase risk taking which can improve returns as their excess capital insulates them from insolvency. FIs that are severely undercapitalized engage in the highest level of risk taking as the probability of insolvency is higher for these FIs so a high risk strategy may be the best possibility for recapitalizing. This moral hazard motivates regulating supervisors to impose progressive penalties, in-creasing as the stock of FI capital falls farther below the minimum capital requirement. For example in the United States, supervisors impose “prompt corrective action,” a set of in-creasingly invasive responses to undercapitalization. FIs operating just below the minimum capital requirement are required, among other things, to provide a capital restoration plan and limit their asset growth. For significantly undercapitalized FIs, supervisors may also limit payments of dividends and management fees, dismiss directors and senior executives, and require the FI to divest from holdings in risky subsidiaries. For critically undercap-italized FIs, supervisors may also restrict payments on subordinated debt and place the FI under the management of another institution such as the Federal Deposit Insurance Corporation (United States Office of the Law Revision Counsel, 2013).
Given the threat of supervisory intervention, FIs often hold capital reserves in excess of minimum requirements. For example, Rime (2001) and Ediz et al. (1998) show that banks operating in Switzerland and the United Kingdom, respectively, actively managed their capital to remain above the regulated minimum. The amount held above the regulated minimum is related to the level of risk under which FIs operate. These findings imply that FIs are holding additional capital to minimizing the costly risk of supervisory intervention that may emerge from a systemic event. This strategy comes at the opportunity cost of reducing loan allocations and so reducing income.
Natural disasters as systemic shocks
International banking standards, including those for minimum capital requirements, focus on the role of large, international banks in the global economy. While these standards are written for the biggest banks in developed countries, they are often used to regulate a wide variety of FIs across diverse jurisdictions. For example, a survey of banking supervisors in 2010 indicated that 84% of jurisdictions had implemented or planned to implement Basel II, the contemporary version of international banking standards (133 jurisdictions completed the survey, Financial Stability Institute, 2010).
Because of their focus, these standards sometimes overlook important systemic risks affecting certain types of FIs and jurisdictions. We believe this is the case regarding natural disaster risks in the financial sectors of many developing and emerging economies. These economies are more vulnerable to disasters for a variety of reasons, including greater partic-ipation in vulnerable sectors such as agriculture and tourism, lower insurance penetration, less resilient public and private infrastructure, and more limited public safety nets.
Macroeconomic research generally suggests that severe natural disasters negatively af-fect growth in developing and emerging economies. Previous literature reports conflicting results, that disasters have negative (Rasmussen, 2004), positive (Skidmore and Toya, 2002), or neutral (Cavallo et al., 2010) effects on growth; however, recent studies use more detailed datasets to disaggregate effects and explain these results (Loayza et al., 2012; Noy, 2009; von Peter et al., 2012). For example, Loayza et al. (2012) demonstrate that economic sectors differ regarding the types of disasters to which they are vulnerable. Agricultural growth is more vulnerable to drought; industrial growth to flood. More generally, this literature identifies two offsetting effects of disasters on growth. First, disasters reduce the stock of productive capital and so reduce total output. Following neoclassical models, the marginal
product of capital increases as its absolute level falls. This dynamic leads to the second effect: reinvestment after the event stimulates the economy and generates higher returns. Noy (2009) notes that the net effect of a disaster is significantly affected by the ability of an economy to mobilize reinvestment. This capacity to mobilize investment is positively associ-ated with the size of domestic credit markets, literacy rates, income per capita, openness to trade, government size, and institutional quality. Thus, recent research suggests that severe disasters tend to negatively affect growth because losses exceed a country’s reconstruction capacity (Hallegatte et al., 2007; Loayza et al., 2012; von Peter et al., 2012). This research also demonstrates that the negative consequences of disasters are greater in developing and emerging economies, likely because of 1) increased vulnerability as described above, and 2) a limited capacity to mobilize reinvestment.
Given the importance of FIs in allocating investments, a clearer understanding of the effects of disasters on these institutions is needed. Little is known about disaster-related credit risk, especially in developing and emerging economies. Following this logic, this paper demonstrates the significant challenges that disasters create for FIs and illustrates that these events affect vulnerable FIs in a fashion similar to other systemic risks. Natural disasters are spatially correlated events that affect many households and firms concurrently, leading to large loan losses. Thus, these events destroy the capital of FIs, and because of minimum capital requirements, lead to a credit contraction in the period following a severe event, slowing recovery for affected communities.
We illustrate these dynamics for an FI in Peru that specializes in microfinance and is vulnerable to severe El Ni˜no events. El Ni˜no creates catastrophic flooding in northern Peru (McPhaden, 2002). During the severe events of 1983 and 1998, rainfall was roughly 40 times normal levels for the months January to May (Skees and Murphy, 2009). This extreme weather leads to deaths and permanent injuries; destroys roads, bridges, homes, and businesses; inundates crops; and increases food prices, water-borne illnesses, and pests. Roughly 20% of the portfolio of this FI is in the vulnerable region. We participated in several development projects in Peru and collected data in collaboration with this FI during that field work.1
1These projects were conducted by GlobalAgRisk, Inc. and were funded by USAID, the Bill & Melinda
Insurance and disaster recovery
von Peter et al. (2012) also find that transferring risk to insurance markets may reduce the consequences of natural disasters. Their results suggest that it is only the uninsured por-tion of the loss that creates negative economic consequences. For well-insured events, the economic effect is neutral or even positive. These macroeconomic results motivate an exam-ination of the underlying microeconomic mechanisms contributing to the value of insurance. We propose that this effect is partially explained by insurance reducing disruptions in the banking sector and so increasing the supply of credit after an event. Insured borrowers may be less likely to default after a severe event. By reducing loan losses, insurance preserves the capital of FIs. This capital can then be directed toward lending for reconstruction. We add insurance to the banking model in this paper and demonstrate that it protects lender capital and increases the supply of credit after the event.
In recent years, the development community has invested in a variety of projects to cul-tivate insurance markets in developing and emerging economies, including those to address natural disaster risk. These projects have tended to focus on insurance for households, especially the poor. While a variety of fascinating case studies have emerged, so have many challenges including limited demand and high transaction costs that threaten the viability of these markets (Murphy et al., 2011; Skees, 2008).
We took a different approach in Peru by using donor support to develop insurance products for FIs and other firms. For FIs, insuring against severe El Ni˜no does not reduce the loan losses of its borrowers, but it offsets the resulting capital losses with an insurance payout. Thus, while the use of insurance by FIs would not directly address the disaster-related hardships of borrowing households and firms, it may prevent credit contractions that exacerbate disaster losses.
Some research also suggests that for managing disaster-related credit risk, insurance for FIs may be more effective than that for households. For example, Miranda and Gonzalez-Vega (2011) model a representative, dynamically optimizing microfinance borrower also using the case of a Peruvian microfinance market vulnerable to El Ni˜no. Their results in-dicate that insurance purchased by individual borrowers is likely to increase credit risk by reducing their capacity to manage idiosyncratic risks. Evaluating the potential of subsi-dized insurance for individual borrowers, they note that the subsidies must be so large to improve borrower repayment that the cost likely outweighs the benefit. Finally, Miranda
and Gonzalez-Vega examine a scenario in which the FI insures against its disaster exposure. Insurance slightly reduces the expected value but greatly reduces the volatility of the equity of the FI over the evaluation period.
After modeling the consequences of El Ni˜no risk for the Peruvian microfinance interme-diary, we evaluate the effects of El Ni˜no insurance — whether the modeled lender chooses to insure and how insurance affects its performance. Unlike Miranda and Gonzalez-Vega (2011) who examine the case of a fully capitalized FI (i.e., one with a capital ratio of 100%), we consider a lender operating in the vicinity of its minimum capital requirement to evaluate the effects of capital constraints on the supply of credit in this risky environment.
2.1.2. Model
A representative lender operating in a competitive market attempts to maximize current and discounted future dividend payments to shareholders over an infinite horizon. This lender manages a stock of equityk, held by international investors, and is unable to attract additional equity investments. Lender income comprises three elements: revenues, expenses, and adjustments in asset values. Each period, the lender generates revenue by making loans
l at interest rate r. Lending is exposed to the production risks of borrowers, leading to an exogenous, random nonrepayment rate ˜ξ ∈[0,1]. Nonrepayment occurs due to idiosyncratic shocks as well as the realization of a natural disaster to which production is vulnerable. The lender borrows from international markets at raterdand incurs origination costs associated with finding and evaluating borrowers. Because of the limited supply of good borrowers, this cost increases as the market grows, taking the formαl2. Finally, the lender adjusts its value based on loan losses ˜ξl. Thus, its income function is
π=r(1−ξ˜)l−rd(l−k)−αl2−ξl.˜ (2.1)
The regulating supervisor and equity and liability holders monitor the lender by its capital ratio c, which takes the form
c= k+π
(1−ξ˜)l. (2.2)
The lender is motivated to keep the ratio at a target level ¯c. If the lender’s capital ratio falls below this target, the regulating supervisor intervenes, restricting operations and implicitly
sending a signal to liability holders of the lender’s risk. If the lender operates above the target, equity holders lose confidence in the lender and begin divesting. Thus, deviations from the target lead to the penalty g(k, l) ≡ β(¯c−c)2l such that deviations are punished at an increasing rate.
Lender income, penalties, and dividend payments affect lender equity, leading to the equity evolution equation
k0 = (1−ν)k+π−g (2.3)
where ν is the dividend rate. Given these conditions, we formulate the lender’s problem with the Bellman equation
V(k) = max
l≥0 νk+δEξ˜[V(k
0
)] (2.4)
whereδ is the lender’s discount rate.
Deterministic steady state
The model structure prevents describing its mechanics analytically; therefore, we solve the deterministic version of this model to demonstrate the lender’s behavior. Let ¯ξ ≡E[ ˜ξ]. The Euler conditions are
Vl: δk0lVk0 ≤µ (2.5)
l≥0, µ≤0, l >0 =⇒ µ= 0 (2.6)
Vk: ν+δk0kVk0 =Vk. (2.7)
Assuming an interior solution, (2.5) leads to the result that the lender originates loans until marginal revenue equals marginal cost
r(1−ξ¯) =rd+ 2αl+ ¯ξ+gl. (2.8)
This inverse supply function can be solved forl, leading to an optimal policy functionl∗(k). The supply of loans is increasing in the interest rate r and decreasing in loan losses ¯ξ, borrowing costs rd, and origination costs α. At the steady state, economic profits equal zero so that r(1−ξ¯) = rd+ (ν−rd)k l + ¯ξ+ αl+β(¯c−c)2 . (2.9)
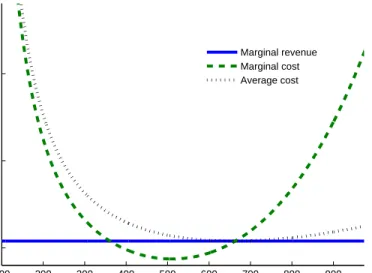
Thus, the model adheres to the result from production theory that competitive markets lead marginal revenue to equal marginal cost and average cost. This result is shown in Figure 2.1 based on the model calibration described in the next section. Equation (2.9) also demonstrates that interest rates comprise three elements: 1) average financing costs for the lender, 2) loan losses, and 3) operational costs.
Figure 2.1: Deterministic solution
100 200 300 400 500 600 700 800 900 1000 0 5 10 Loans Revenue,Cost Marginal revenue Marginal cost Average cost
Student Version of MATLAB
Note: The optimal level of lending in the deterministic model equates the marginal revenue, marginal cost, and average cost of lending.
Model with insurance
We additionally consider a case in which the lender can use an insurance-like mechanism to transfer its disaster risk. This insurance provides a payment based on an occurrence of the disaster, which is measured by indicator t. The lender can buy a sum insured q ≥ 0 at premium rate p and receive a payout based on the function i(t). Thus, the insurance protects against the disaster event but does not directly reduce the loan losses of the lender. The lender’s new income function is
π=r(1−ξ˜)l−rd(l−k)−αl2−pq−ξl˜ +qi(t). (2.10)
2.2. Methods
This section describes model calibration and the numerical solution techniques used to solve the model. Mapping disaster severity to economic exposure is a non-trivial task. For exam-ple, Strobl (2012) models GDP losses from hurricanes using data on population data and the
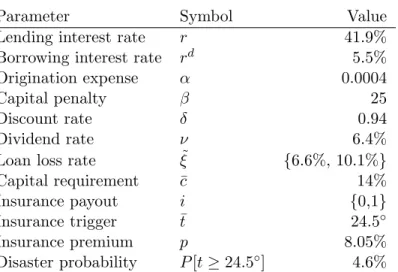
Table 2.1: Calibration summary
Parameter Symbol Value
Lending interest rate r 41.9%
Borrowing interest rate rd 5.5%
Origination expense α 0.0004
Capital penalty β 25
Discount rate δ 0.94
Dividend rate ν 6.4%
Loan loss rate ξ˜ {6.6%, 10.1%}
Capital requirement c¯ 14%
Insurance payout i {0,1}
Insurance trigger t¯ 24.5◦
Insurance premium p 8.05%
Disaster probability P[t≥24.5◦] 4.6%
Note: Brackets indicate values under non-disaster and disaster conditions, respectively.
wind speeds and paths of hurricanes. El Ni˜no-related loan loss data from Peru are available for a single severe event and at the portfolio level, limiting opportunities to observe portfolio losses across events of different severities. Moreover, because the last severe event occurred more than 15 years prior to the current risk assessment, the capacity of historical losses to predict current exposure is greatly reduced. Given the paucity of data, we elicit the expert judgement of risk managers in the representative lender, using historical loss data as one reference point, to estimate the current exposure of this intermediary. Additionally, using current primitive financial parameters for the representative lender such as its lending and borrowing interest rates and origination expenses, we evaluate the financial and operational consequences of the estimated disaster-related loan losses. Table 2.1 summarizes calibration values.
2.2.1. Financial intermediary calibration
The representative lender is calibrated for one of several FIs with whom the authors col-laborated in risk assessment and stress-test modeling. This FI specializes in microfinance with an average loan size of USD 1600. Its stated mission is to provide financial services to micro and small enterprises with the hope of improving quality of life for lower income people.
Data from the monthly income statement and balance sheet of the FI are available form the Peruvian banking regulator’s website.2 We calibrate financial performance parameters
2
such as the effective annual lending interest rate (41.9%), borrowing interest rate (5.5%), and dividend rate (6.4%) using the average values from July 2009 to June 2012. During the evaluation period, the regulating supervisor required this type of FI to maintain a capital ratio of at least 14%, which we treat as the target capital ratio ¯c.
Origination expensesα result from a combination of administrative expenses, including investments in human resources, management information systems, research and develop-ment for new financial products, and geographic expansion. Identifying these expenses in the historic data is not possible; however, model stationary is a result of the convexity of origination expenses. We assume that the lender is operating in the vicinity of the mean of its steady state distribution of equity. Thus, by examining the level of equity held by the FI, we can infer the approximate origination expenses that lead to this outcome. We scale the model by a factor of one over one million so that equity is roughly USD 80 (instead of USD 80 million), leading to an α of 0.0004.
The parameter β on the capital penalty requires some logical constructs to calibrate. Deviating from the capital requirement may have direct financial implications (e.g., higher borrowing costs) and indirect ones (e.g., the supervisor dismissing board members). Both direct and indirect implications contribute to the value of β for the representative lender, making it difficult to measure. We consider a desirable penalty calibration one in which the risk of the penalty affects lender behavior (e.g., holding capital in excess of the minimum requirement), yet the penalty is not so stringent that it leads the modeled lender to insol-vency when shocks occur. A calibration ofβ= 25 meets these conditions. Finally, following Mendoza and Quadrini (2010), we set the discount rate δ at 0.94.
2.2.2. Risk survey and expected losses
The FI surveyed its office and credit risk managers regarding their perceived vulnerability of outstanding loans to severe El Ni˜no. Twenty seven participants completed the survey from four vulnerable regions: Piura, Lambayeque, La Libertad, and Ancash. The survey included an open-ended question asking participants whether they are concerned about the risk of a severe El Ni˜no. The expert responses offer a nuanced perspective on the diverse credit risks associated with these events:
• “If a similar event occurs as that in 1998, we would certainly have negative conse-quences for the entire economy, especially because the area we serve depends heavily
on the viability of roads. These roads being blocked or interrupted by landslides would affect significantly the normal operations of our commerce and transport clients.”
• “We are concerned by severe El Ni˜no. Our agency is in the Piura office and the city-level infrastructure is unable to prevent flooding because the main channel of the river runs through the city. Also, we have loans in grape production and other export products which are the main source of income for the rural area around the city, including an important source of income for dependent laborers. At the office in Uni´on, the river floods the farmland, as it has no proper outlet, and the rain affects agricultural products such as cotton, corn, and rice that provide the main income in the area.”
• “As the waters warm from El Ni˜no, the aquatic species and fishing industry will move away from our coastline, leading to a shortage of fish.”
• “El Ni˜no brings torrential rains that would cause serious harm to people, especially to the thousands of low income families living in mat huts.”
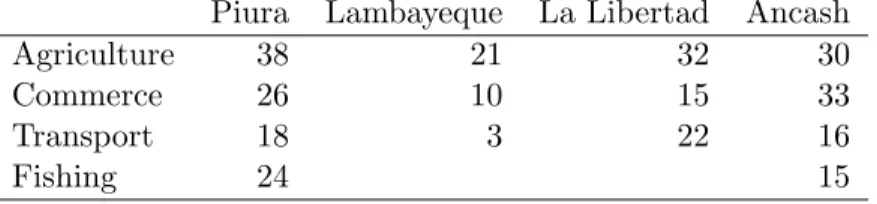
The survey respondents reported agriculture, commerce (i.e., firms in retail), transporta-tion, and fishing as the most vulnerable sectors. Table 2.2 provides the average expected loan losses for each sector and region. Combining these estimates with its portfolio allo-cations indicates that the FI expects to lose 15% of the value of its loan portfolio in the vulnerable regions if a severe El Ni˜no occurs. This type of FI anticipates to recoup about 60% of loan losses through exercising rights to collateral, implying that the expected default rate in the region for this event is 25%. Aggregating these results to the total portfolio, across all regions, the FI expects to lose 3.5% of the value of its outstanding loans from a severe El Ni˜no event. This estimate is consistent with historical performance during the last severe El Ni˜no of 1997–1998 and risk assessment results for other FIs in the region (Collier, 2010; Collier et al., 2011; Collier and Skees, 2012).
Table 2.2: Expected loan losses (%)
Piura Lambayeque La Libertad Ancash
Agriculture 38 21 32 30
Commerce 26 10 15 33
Transport 18 3 22 16
2.2.3. Probability of severe El Ni˜no
Severe El Ni˜no events are the result of a disruption in ocean and atmospheric circulation along the equatorial Pacific. This disruption increases the Pacific surface temperature, cre-ating convection. As this warm, moist air moves west, it meets the cool air descending from the Andes in the east. The result is an extended period of torrential rainfall and flooding in northern Peru and southern Ecuador (Lagos et al., 2008). Because of this physical process, Pacific ocean temperatures are the key measure of El Ni˜no used by climate scientists (e.g., see Wolter and Timlin, 1998) and the method we use to estimate the probability of El Ni˜no. Ni˜no 1+2 is a measure of ocean temperatures near the coast of Peru and Ecuador collected by the National Oceanic and Atmospheric Administration (NOAA) of the United States. Khalil et al. (2007) find that rainfall in northern Peru is highly related to Ni˜no 1+2. Ocean temperatures in this region follow an annual cycle. If El Ni˜no emerges, flooding in northern Peru generally begins in February. Elevated ocean temperatures predate extreme rains. Our analyses suggest that average reported temperatures for Ni˜no 1+2 for November and December are a strong predictor of impending torrential rains in northern Peru and so serve as the index by which we measure El Ni˜no severity.
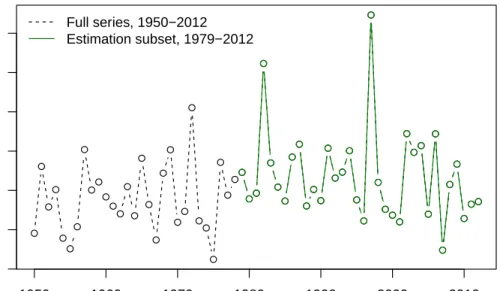
NOAA measures Ni˜no 1+2 using a combination of data from ocean buoys, satellite sensors, and transocean liners. Data are available from 19503; however, the amount of buoys increased significantly in the 1970s and satellite readings were not available until the early 1980s. As a result, we use data from 1979 to 2012. Figure 2.2 shows the full time series and the data subset used in our probability estimations. Long-term historic data show multi-decade cycles in El Ni˜no events; and significant debate exists in the scientific community on the effects of anthropogenic climate change on El Ni˜no (Collins, 2005; McPhaden, 2002; Merryfield, 2006; van Oldenborgh et al., 2005; Yeh et al., 2009). Regarding our Ni˜no 1+2 Index, no time trend is present in either series, and the augmented Dickey-Fuller test reports that neither the full time series (aDF=-4.19, p<0.01) nor the estimation subset (aDF=-4.21, p=0.01) has a unit root, an indication of stationarity.
Two severe El Ni˜no events occur in the data series, in years 1982 and 1997. These ele-vated ocean temperatures in November and December correspond with flooding in northern Peru several months later, beginning in approximately February of 1983 and January of 1998, respectively. Both severe events caused significant damage, leading to many problems
3
Figure 2.2: Ni˜no 1+2 Index ● ● ● ● ● ● ● ● ●● ● ● ● ● ● ● ● ● ● ● ● ● ● ● ● ● ● ● ●● ●● ● ● ● ● ● ● ● ● ● ● ●● ● ● ● ● ● ● ● ● ● ●● ● ● ● ● ● ● ●● 1950 1960 1970 1980 1990 2000 2010 20 21 22 23 24 25 26 Year Niño 1+2 Inde x, ° C ● ●● ● ● ● ● ● ● ● ● ● ● ●● ● ● ● ● ● ● ● ● ● ●● ● ● ● ● ● ● ●● Full series, 1950−2012 Estimation subset, 1979−2012
Note: The Ni˜no 1+2 Index is generated from the average Pacific surface temperatures in the region Ni˜no 1+2 during November and December each year. Elevated temperatures such as those in 1982 and 1997 are associated with an impending severe El Ni˜no. We use a subset of the total time series for which data quality is higher.
in the financial sector. Because the economy and financial system have changed so signif-icantly since their occurrence, comparisons of the consequences of these two severe events are difficult. As a result, we treat severe El Ni˜no as a binary outcome. Based on discussions with climate scientists and reports on what ocean temperatures lead to significant losses in Peru, we define a temperaturetexceeding 24.5◦on the Ni˜no 1+2 Index as a severe El Ni˜no event.
We assess the probability of severe El Ni˜no using maximum likelihood estimation (MLE) of the generalized extreme value (GEV) distribution. This distribution is commonly used for estimating infrequent events with limited data due to its flexibility as its parameters allow it to approximate a variety of long-tailed distributions. It is derived from an assumption of the data’s asymptotic convergence, namely it is the limiting distribution of the maxima of
N independently and identically distributed, random variables drawn from a distribution as
N → ∞ (Cameron and Trivedi, 2005). The cumulative distribution function for the GEV distribution is G(x;µ, σ, κ) = exp ( − 1 +κ(x−µ) σ −1/κ) (2.11) where µ, σ, and κ parameterize the location, scale, and shape of the distribution,
respec-tively (Jenkinson, 1955). The GEV distribution has three types, which depend on the value ofκ. Type 1, the Gumbel distribution, occurs whenκ= 0 and is the most familiar for many economists as the logit model is derived from it (Cameron and Trivedi, 2005). Its tail de-creases exponentially, similar to the normal distribution. Type II, the Fr´echet distribution, occurs when κ > 0 and is similar to Student’s t, Pareto, and Cauchy distributions whose tails decrease more gradually. Type III, the reverse Weibull distribution, occurs whenκ <0 and is marked by relatively short tails, similar to the beta distribution (Woo, 1999).
Smith (1985) demonstrates that the GEV distribution can be estimated using MLE, showing that the typical asymptotic properties of MLE estimators hold if κ ≥ −0.5. The results of our MLE using the Ni˜no 1+2 index for years 1979 to 2012 provide GEV distribu-tion parameters ofµ= 21.861,σ= 0.809, andκ= 0.041, indicating that Fr´echet is the best fitting distribution for this index. Figure 2.3 provides a histogram of the index values and the estimated probability density function. Based on this analysis, the annual probability of severe El Ni˜no is
P[t≥24.5◦] = 1−G(24.5◦) = 4.6%. (2.12)
Figure 2.3: Histogram and GEV distribution
Niño 1+2 Index Density 20 21 22 23 24 25 26 27 0.0 0.1 0.2 0.3 0.4 0.5
Note: The histogram and MLE estimation of the generalized extreme value distribution for the Ni˜no 1+2 Index are shown. The shaded area under the curve identifies the probability of a severe El Ni˜no, which we estimate as 4.6% annually.
2.2.4. El Ni˜no insurance
A parametric insurance product is now sold in Peru to address the adverse consequences of event-related flooding. That contract uses the Ni˜no 1+2 Index as the sole basis of payments. Because the Ni˜no 1+2 Index measurements predate Ni˜no -related flooding in northern Peru, El Ni˜no insurance has the potential to make payments before disaster losses emerge. Thus, it is likely the first regulated forecast insurance in the world (Collier and Skees, 2012).
Following our treatment of El Ni˜no as a binary event, we use a simplified insurance contract structure in this paper such that the full sum insured is paid if severe El Ni˜no occurs i(t) = 1 ift≥24.5◦ 0 o.w. (2.13)
From discussions with insurers and reinsurers, we estimate that for this risk the loads for commissions, administration costs, etc., would be approximately 75% of the actuarially fair rate, resulting in an annual premium rate of about 8.05% of the sum insured for this stylized contract.4
2.2.5. Solution techniques
The Bellman equation (2.4) is solved using the method of collocation (Judd, 1998; Mi-randa and Fackler, 2002). The collocation method calls for the value function V(k) to be approximated using a linear combination ofn known basis functionsφj:
V(k)≈
n
X
j=1
zjφj(k). (2.14)
The unknown coefficients zj are then fixed by requiring the value function approximants to satisfy the Bellman equation (2.4), not at all equity levelsk, but rather atn judiciously chosen collocation nodeskj. The collocation method replaces the Bellman functional equa-tions with a set of n nonlinear equations withn unknowns that are solved using Newton’s method. The collocation method can generate highly accurate approximate solutions to the Bellman equation, provided the basis functions and collocation nodes are chosen
judi-4
We would like to thank Grant Cavanaugh for his contributions to estimating the probability of El Ni˜no. For an in-depth analysis on this topic, please see Cavanaugh (2013). Additionally, insurers in Peru offer a linearly increasing payout structure. For example, one contract has a trigger of 24◦and exhaustion point at 27◦, where the full sum insured is paid. As a result, the probability estimates developed here do not apply to those contracts.
ciously and their number n is set adequately high. We chose Chebychev polynomials and equally-spaced nodes to compute the approximate solutions for the Bellman equations. The solution was computed using the CompEcon 2012 Toolbox routine dpsolve (Miranda and Fackler, 2002).
2.3. Results
This section describes the optimal behavior of the lender and simulates the effects of a natural disaster on its operations. We also compare results in which the lender retains its disaster risk with those in which the lender transfers it using insurance.
2.3.1. Lender simulation, retaining risk
Figure 2.4 illustrates results for the model in which the lender retains its risk, the model without insurance. In the figure, each period represents a year, and the disaster occurs in Period 0. The figure shows that because of risk, the lender sets loan allocations so that it operates with a buffer above minimum capital requirements. This result is consistent with the behavior of the FI, which during the evaluation period, maintained an average capital ratio of 16.8%.
The disaster creates loan losses that lead to income losses. Income losses reduce the capital of the lender and push its capital ratio below the minimum requirements. Given this smaller equity base, the capital requirement motivates the lender to realign its balance sheet by originating fewer loans, disrupting the provision of credit in the market.
Recovery occurs as the lender retains earnings during the periods following the disas-ter. Facilitating this recovery is the ready supply of good borrowers created by the credit contraction, leading to lower origination expenses and so higher income. These results in-dicate that loan origination returns to pre-disaster levels after approximately four to five years, which is consistent with the expected recovery period communicated by credit risk managers in FIs in Peru.
2.3.2. Capital constraints and the 1998 El Ni˜no
These results motivate the question: did the 1998 El Ni˜no create the capital problems demonstrated in the simulation results? While the microfinance institution for which the model is calibrated was not operating during that event, we examine the performance of
Figure 2.4: Simulation, risk retained −2 −1 0 1 2 3 4 5 6 −30 −20 −10 0 10 20 30 Income Period
Student Version of MATLAB
−2 −1 0 1 2 3 4 5 6 10 11 12 13 14 15 16 Capital Ratio, as % Period Capital ratio Minimum requirement
Student Version of MATLAB
−2 −1 0 1 2 3 4 5 6 0 5 10 15 20 Penalty Period
Student Version of MATLAB
−2 −1 0 1 2 3 4 5 6 30 40 50 60 70 80 90 Equity Period
Student Version of MATLAB
−2 −1 0 1 2 3 4 5 6 540 560 580 600 620 640 660 Loan Origination Period
Student Version of MATLAB
−2 −1 0 1 2 3 4 5 6 0 1 2 3 4 5 6 Dividend Payments Period
Student Version of MATLAB
Note: Simulation results demonstrate the financial and operational consequences of a severe El Ni˜no event for the modeled lender.
other FIs in the region. Figure 2.5 shows the ratio of equity to loans, approximately the capital ratio, for three FIs operating in the region during 1998. Those FIs are owned by local municipalities and provide credit to households and firms of a variety of sizes.
This time series illustrates a common pattern that FIs in newly developed credit markets often operate with large capital reserves but reduce these reserves as markets grow. Lenders in nascent markets are managing a great deal of risk, such as lending to borrowers with no previous credit history and developing and testing underwriting procedures. These lenders are also building a clientele large enough to meet its lending capacity. As markets mature, the capital ratios of FIs converge toward minimum requirements.
During this maturation process in northern Peru, El Ni˜no occurred. The shaded area in Figure 2.5 is a four year period beginning with the approximate onset of the El Ni˜no
event in January 1998 and ending in December 2001. The months during and after the El Ni˜no event represent a period of high volatility in the capital ratios of each FI; however, the figure does not mimic the plummet and recovery of the capital ratio shown in Figure 2.4. Because these FIs were not operating near the minimum capital requirements, their operations were not constrained by capital losses. Instead, Collier and Skees (2012) report that these FIs used their excess capital to increase lending to improve their performance indicators following the disaster. For example, portfolio at risk (PAR) is an indicator describing the proportion of the portfolio on which loan payments are a certain number of days (e.g., 90) overdue. Assuming an FI can identify creditworthy borrowers, a dramatic increase in lending following a disaster would reduce PAR.
While the excess capital reserves held by these FIs in 1998 minimized the potential dis-ruptions of El Ni˜no on their operations, their reserves are now much closer to the minimum requirements. Thus, these FIs are no longer in a position to rely on a strategy of growing to recover from a severe event.
Figure 2.5: Financial intermediary capital ratios and the 1998 El Ni˜no
Year Capital Ratio , as % 1995 2000 2005 2010 20 30 40 50 FI A FI B FI C Minimum requirement
Note: During the severe El Ni˜no of 1998, financial intermediaries held large capital reserve; now they do not, increasing their vulnerability.