Masterthesis
Microfinance and RatingBy Alla Steffensen
The masterthesis is carried out as a part of the education at Agder University College and is therefore approved as such. However, this does not imply that the College answers for the methods that are used or the conclusions that are drawn.
Supervisor: Roy Mersland
Agder University, Kristiansand
Preface
Taking a master degree at Agder University has been an interesting and enriching experience. The study has come to an end and the only master thesis is left.
Konrad Adenauer once said: “We all live under the same sky, but we don’t all have the same horizon” (Quotegarden, 2007). Learning about how financial services can help the poor and the vulnerable opened a whole new perspective for me. It was the Nobel Peace Prize 2006 that first brought microfinance to my attention. It was fascinating to see how financial and social goals can be connected. Therefore I decided to write my master thesis about microfinance.
I would like to thank a Ph.D. student Roy Mersland for introducing me to the microfinance rating industry. He kindly agreed to be my supervisor and was very helpful in guiding me through this process. Furthermore, Roy Mersland developed the dataset used in this study. It was a big honor and pleasure to be working with him.
I would also like to thank my husband for his inspiration and support. Thank you very much for taking care of our junior.
Lyngdal, June 1st 2008
_________________ Alla Steffensen
Abstract
This master thesis starts by introducing the concept of microfinance. It shows that MFI rating is an important tool in achieving transparency.
The study attempts to determine the relationship between social and financial indicators and the MFI rating grade. These indicators are chosen based on previous studies on ratings and microfinance. The data comes from ratings reports performed by five major MFI rating agencies: MicroRate, Planet Rating, Microfinanza, Crisil and M-Cril. Data transformation was used to achieve normal distribution of the variables.
The empirical research was carried out using multiple regression analysis. A few equations were tested to find the optimal model. The findings of the study revealed that MFI size, risk, profitability, productivity and efficiency are significant determinants of rating grades. Larger and less riskier MFI tend to get better rating grades. Increasing profitability, productivity and efficiency of the MFI will increase the rating grade. No significant relationship between the social performance of MFI and the rating grade assigned was found. Control variables were used to account for the possible affect of MFI region, motive (profit or not) and agency that performed the rating. Only one out of six regions was significant in explaining the model - Europe and Central Asia. It didn’t matter whether MFI was a non-profit organization or not. The grade was, however, affected by the agency that performed the rating.
Table of Contents PREFACE... 1 ABSTRACT... 2 TABLE OF CONTENTS... 3 1. INTRODUCTION... 5 2. MICROFINANCE OVERVIEW... 6 2.1. THE “UNBANKED” ... 6 2.2. THE CLIENTS... 7
2.3. INCLUSIVE FINANCIAL SERVICES... 8
2.4. HISTORY OF MICROFINANCE... 10
2.5. GRAMEEN BANK... 12
2.6. NOBEL PEACE PRIZE 2006 ... 14
2.7. MICROFINANCE TODAY... 14
3. PROVIDERS OF FINANCIAL SERVICES ... 17
3.1. INFORMAL... 17
3.2. MEMBER-BASED... 18
3.3. NGOS... 18
3.4. FORMAL FINANCIAL INSTITUTIONS... 18
4. FUNDING OPTIONS ... 20
4.1. DONORS... 20
4.2. INVESTORS... 21
4.3. DOMESTIC CAPITAL MARKETS... 22
5. MICROFINANCE RATING ... 25
5.1. CREDIT RISK RATINGS? ... 25
5.2. MICROFINANCE RATINGS... 25
5.3. MICROFINANCE RATING AGENCIES... 31
6. THEORY ... 33 6.1. TRANSPARENCY... 33 6.2. AGENT THEORY... 34 7. PREVIOUS STUDIES ... 36 7.1. BOND RATINGS... 36 7.2. MICROFINANCE RATINGS... 37 8. HYPOTHESES... 39 8.1. HYPOTHESIS 1: SIZE... 40 8.2. HYPOTHESIS 2: RISK... 40
8.3. HYPOTHESIS 3: EFFICIENCY AND PRODUCTIVITY... 41
8.4. HYPOTHESIS 4: PROFITABILITY... 41
8.5. HYPOTHESIS 5: SOCIAL PERFORMANCE... 41
9.1. DATA COLLECTION... 43
9.2. RELIABILITY AND VALIDITY... 44
9.3. DATA PREPARATION... 44 9.4. DATA TRANSFORMATION... 45 9.5. DESCRIPTION OF VARIABLES... 47 9.5.1 Dependent Variable ... 48 9.5.2 Independent Variables... 50 9.6. CORRELATION... 61
10.1 BASIC REGRESSION MODEL... 67
10.2 MULTIPLE REGRESSION ANALYSIS... 68
10.3 COEFFICIENT OF MULTIPLE DETERMINATION R2... 70
10.4. R2 ADJUSTED... 70
10.5 REGRESSION ANALYSIS OF THE RATING FUNCTION... 71
11. RESULTS ... 84
12. DISCUSSION ... 88
13. CONCLUSION... 93
14. CRITICS ... 94
15. TABLE OF CONTENTS... 95
RAISING CAPITAL FOR MICROFINANCE: SOURCES OF FUNDING AND OPPORTUNITIES FOR EQUITY FINANCING ... 97
1. Introduction
In the past years more and more attention has been given to microfinance. Year 2005 was announced as international year of microcredit. In 2006 the Nobel Peace Prize was awarded to Grameen Bank and it’s founder Muhammad Yunus. Today MFIs can be found all over the world providing financial services to the poor. To many of us, the concept of microfinance is still rather new.
With the microfinance industry evolving and maturing, the need for transparency is increasing. Ratings are a part of a transparency sequence. They help MFIs to get funds, benchmark their position, compare it with peers and improve performance. Some MFI are, however, reluctant, of being rated in fear of getting a bad grade. The paper discusses the benefits of ratings and shows that achieving transparency in the microfinance industry benefits all.
This paper describes microfinance and the microfinance rating industry. It shows that ratings are an important step on the way to transparency. Little research has been done on the rating of MFIs. Based on previous studies, several financial and social indicators are chosen as determinants of ratings. The empirical research aims to identify the relationship, if such exists, between the rating grade assigned to MFI and its size, risk, productivity and efficiency, profitability and social performance.
2. Microfinance Overview
2.1. The “Unbanked”
Access to financial services is a part of our everyday life: we get our salary to a bank account, use it to pay bills, own a debit or a credit card (or often both), have a savings account, a loan and insurance. Now think if all this was unavailable… I know that for me, daily
transactions/chores would become much more time consuming, inconvenient and some simply impossible (like buying a house).
While the majority of the households in Europe (except Eastern Europe) have a bank account, the situation differs dramatically in developing countries (Figure 2.1):
Figure 2.1. Household Share with a Bank Account
Source: Beck, Demirguc-Kunt, Peria, 2005
The share of households with a bank account is highest for Western and Northern Europe 0,002 0,047 0,089 0,1 0,1220,137 0,161 0,250,284 0,4120,427 0,704 0,789 0,9160,927 0,9630,991 0,178 Bulgaria Nicaragua Armenia Kenya Pakistan Guyana Ecuador Guatemala Mexico Namibia Colombia Brazil Italy Greece Spain Belgium France Denmark
Italy). A bit less than half of households in Colombia and Brazil have a bank account. Furthermore, the number of households with a bank account drops to only 0,002 for Bulgaria or 0,047 for Nicaragua.
As we see, access to financial services is limited in many developing countries. There is a number of reasons why so many people are “unbanked”. The poor may simply find the products unattractive. Banks may be not willing to provide services due to high transaction costs and high risk. Even issues like culture and gender can limit the access to financial services (The Blue Book, 2006) But one thing is clear: “poor and low-income people want financial services that match their needs to better manage their households and businesses” (The Blue Book, 2006).
2.2. The Clients
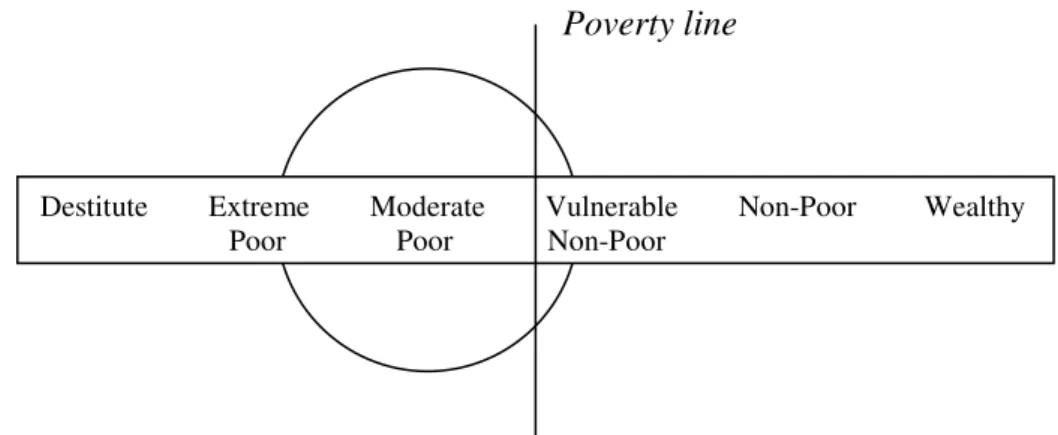
Microfinance aims to provide financial services to the poor. Research shows that typical microfinance clients come from moderately poor and vulnerable to non-poor households with some from extreme-poor households. Destitute households remain still unreached (Helms, 2006).
Figure 2.2 How Poor Are Microfinance Clients?
Poverty line
Source: Cohen, 2003
Microfinance clients are typically self-employed farmers, shopkeepers, vendors, service providers etc. (Mixmarket, 2008). Often they lack collateral and can’t apply for a bank loan.
Destitute Extreme Moderate Vulnerable Non-Poor Wealthy Poor Poor Non-Poor
Grameen Bank has a special program developed for beggars. They can apply for interest-free loans. The repayment installments are very small – for ex. 3,4 US cents per week (Rutherford, 2003). The program aims to improve living conditions of the beggars and the destitute by providing access to financial services.
2.3. Inclusive Financial Services
Previously microfinance (then microcredit) was about providing loans. But the poor showed that there exists a demand for a variety of financial services. That’s what modern microfinance is about:
providing inclusive financial services such as loans, savings, money transfer and insurance to the poor.
Brett Matthews (Matthews, ) provides a description of typical financial goals for poor households and the microfinance products that fit those needs. As we see, access to loans enables poor families to buy working capital and livestock, housing and helps in emergency situations. Deposit services enable customers to save for food, healthcare, transportation, livestock, education, pension etc. No less important is the ability to send money. While richer households usually use money transfer to pay bills (The Blue Book, 2006), poor households use remittances (migrant workers sending money home) or send money to (Helms, 2006). Poor families are more vulnerable to tragedies and disasters. Death or sickness of a breadwinner in the family can put the household in a serious financial trouble, while situation would be different if family had insurance.
u re 2 .3 . T y p es o f M ic ro fi n a n ce U se d b y P o o r P eo p le o u rc e: B re tt M at th ew s, M at h w o o d C o n su lt in g C o m p an y
2.4. History of Microfinance
We will look into the history of microfinance. The first concepts behind it have existed for decades and can be found already in Europe in the Middle Ages (figure 2.4).
In 1462 a Franciscan monk in Perousa, Italy established the first public pawnshops in Perousa, Italy. The "mont-de-pietes" or "Banks of Pity" were organized as a charity institution and provided loans to the poor without charging interest (Expressloan, 2006).
Jonathan Swift founded the Irish Loan Fund System in the beginning of 1700s. The system was characterized by providing small funds locally. The repayment rates were high and it grew to 300 funds by the early 1840s. It was one of the largest financial organizations in Ireland and at its peak 20% of Irish households had loans there annually (Eh, 2008).
The first credit cooperatives were organized in Germany by Herman Schulze-Delitzsch and Friedrich Raiffeisen. Herman Schulze-Delitzsch’s purpose was to provide cheaper bread (by organizing a cooperative-owned mill and bakery) and Friedrich Raiffeisen’s was to enable farmers to a credit. These unions spread furthers through Germany, Europe and reached Canada in 1900 (NCUA, 2008).
Various types of formal saving and credit institutions began to appear in Latin America in 1900s. Though the early European immigrants introduced them, they were government or private owned and not by the clients as in Europe (Britannica, 2008).
After the World War II countries focused on developing the agricultural sector. State owned development finance institutions and farmers’ cooperatives provided loans to the farmers. Providers were heavily subsidized and used below market interest rates. The demand for such loans increased a lot and loans ended up more and more often in the hands of government favored or better-off farmers. The repayment rates fell dramatically, since customers started to feel that these loans were more as a “gift” (Morduch, 2005).
In 1970s Grameen Bank in Bangladesh, ACCION International in Latin America and Self-Employed Women’s Association Bank in India start providing small credits to the poor. This
Figure 2.4 The History of Microfinance
Since the beginning of time…
Informal saving and credit groups have operated for centuries across the developing world.
Middle Ages
In Europe an Italian monk created the first official pawnshop in 1462 to counter usury practices.
In 1515 Pope Leon X authorized pawnshops to charge interest to cover their operating costs.
1700s
Jonathan Swift initiates the Irish Loan Fund System, which provides small loans to poor farmers who have no collateral. At its peak, it is lending to 20% of all Irish households annually.
1800s
The concept of the financial cooperative is developed by Friedrich Wilhelm Raiffeisen and his supporters in Germany. From 1865, the cooperative movement expands rapidly within Germany and other countries in Europe, North America, and eventually developing countries.
Early 1900s
Adaptations of these models begin to appear in parts of rural Latin America.
1950-1970
Efforts to expand access to agricultural credit use state-owned development financial institutions, or farmers’ cooperatives to channel concessional loans and on-lend to customers at below-market interest rates. These development banks lose most of all of their capital because their subsidized lending rates cannot cover their costs, including the cost of massive default.
Early 1970s
Experimental programs extend tiny loans to groups of poor women to invest in micro-business, and microcredit is born. Early pioneers include Grameen Bank; ACCION International and the Self-Employed Women’s Association Bank
1980s
Microcredit programs throughout the world improve on original methodologies. Microlenders, such as Bank Rakayat Indonesia defy conventional wisdom about financing the poor. Cost-recovery interest rates and high repayments permit them to achieve long-term sustainability and reach large numbers of clients.
Early 1900s
The term “microcredit” begins to be replaced by “microfinance”, which includes not only credit, but also saving and other services, such as insurance and money transfers.
Today
The borders between traditional microfinance and the larger financial system are starting to blur. In some countries, banks and other commercial actors are entering microfinance. Increasing emphasis is placed on building entire financial systems that work for the poor.
In 1980s microcredit programs showed that:
1) repayments rates (especially for women) are better than in commercial banks 2) MFI can cover their costs
This meant that MFI don’t have to depend on subsidies or government help. Bank Rakayat Indonesia (BRI) focused on covering its costs. Today BRI provides financial services to 30 million poor villagers.
Microcredit programs continue to expand in 1990s. The focus is being broadened from providing loans to also giving the poor a possibility to save, buy insurance, transfer and receive money. While MFI offer a whole range of microfinance services they also start thinking more about organization form. Earlier MFI were typically non-profit organizations, but more organizations are being organized or changed to for-profit MFI. Organization forms will be described later in this paper.
2.5. Grameen Bank
Grameen Bank is among pioneers in microfinance Furthermore, it’s probably the best know MFI. Therefore I would like to dedicate a special attention and tell its story. Information on the history is taken from Grameen Bank’s webpage (Grameen, 2008).
Bangladesh became independent from Pakistan in 1971. Over 80 % of the population were reported living in poverty in 1973-1974 (Morduch, 2005). Population suffers not only from famine, but also from shark moneylenders charging 10% interest a week. Professor Mohammed Yunus decides to start a radical experiment. One of his students makes a list with total of 42 people from a nearby village of Jobra that need totally less than 27 US$ to start for themselves (Grameen, 2008). Mohammed Yunus borrows his own money to the villagers. Not only are they able to improve their situation and start business, but they also repay well. Later Mohammed Yunus managed to get a loan and started to provide small loans to villagers. They were not given as a big sum, but as frequent small amounts. Grameen bank (Grameen = village) opened its official entity in 1983.
7 463 556 10 0 1 000 000 2 000 000 3 000 000 4 000 000 5 000 000 6 000 000 7 000 000 8 000 000 1976197819801982198419861988199019921994199619982000200220042006 2008 mar M e m b e rs Number of members
One of the innovations of Grameen Bank is group lending. Clients are organized in groups of 5. First only 2 members of the group get a credit, after that is repaid – the next 2 and the last 5th person at the end. The system encourages social responsibility by letting the whole group be responsible for all members. Failing to repay by one of the members excludes the whole group from future borrowing.
Mohammed Yunus noticed very fast that most of bank’s clients were women. They were the ones spending more on family and business than for personal wishes. There was however a challenge – in Muslim culture women were kept at home. Microcredit enabled women to get more power in making decisions at home and allowed them to handle money.
In my opinion, the success of Grameen Bank can easily be understood by looking at the membership growth. In 1976 there were only 10 members in the bank, while as of March 2008 the number reached 7 463 566customers (out of which 96,8 % are women).
Figure 2.5 Membership Growth in Grameen Bank, 1976-march 2008
Grameen Bank provides a complex of microfinance services such as loans (basic, flexible, educational, housing, etc), deposits, insurance and even scholarships. The number of outstanding loans is 559,79 million US$ and recovery rate is 98,22%. 81 574 villages have access to financial services through Grameen Bank according to Grameen monthly update, march 2008 (Grameen, 2008).
2.6. Nobel Peace Prize 2006
The Norwegian Nobel Prize Committee has awarded the Nobel Peace Prize for 2006 to Muhammad Yunus (Bangladesh) and his foundation - Grameen Bank (Dhaka, Bangladesh). The press release stated that:
”Muhammad Yunus has shown himself to be a leader who has managed to translate visions into practical action for the benefit of millions of people, not only in Bangladesh, but also in many other countries. Loans to poor people without any financial security had appeared to be an impossible idea. From modest beginnings three decades ago, Yunus has, first and foremost through Grameen Bank, developed micro-credit into an ever more important instrument in the struggle against poverty.” (Nobelprize, 2006).
In order to achieve lasting peace, we need to reduce poverty, continued the release. Though microfinance alone can’t do it, it is proven to be an effective tool for the economic and social development.
2.7. Microfinance Today
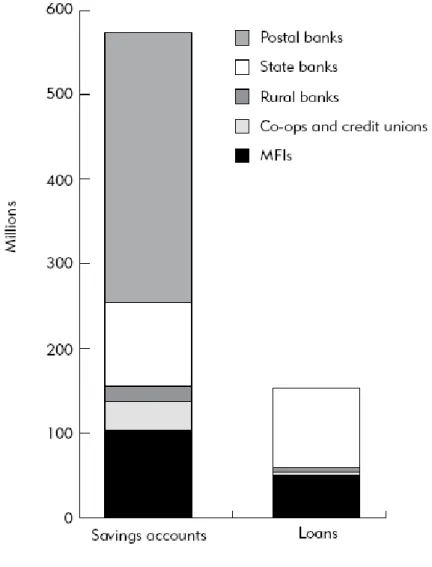
As of 2004, almost 100 million people are loan client at MFIs (The Blue Book, 2006). The table below shows that these institutions provide around 600 million savings accounts and more than 150 million loans (The Blue Book, 2006). Postal banks account for more than a half of all savings accounts, while state banks and MFIs account for one fifth each. Rural banks, co-ops and credit unions share the remaining ~10%. Situation in loans is quite different. State banks and MFI are the main providers with respectively 62% and 33%.
Figure 2.6. Alternative Financial Institution Activity in Developing Countries
Source: CGAP, The Blue Book, 2006
Now let’s look how these loans and saving accounts are distributed geographically. Asia and the Pacific stand for 83% of all accounts, more than a half of these accounts is concentrated in China and India. Middle East and North America, Sub-Saharan Africa, Europe and Central Asia and Latin America and Caribbean account each for only 2-8%.
Figure 2.7 Accounts by Region
Source: Helms, 2006
CGAP (Helms, 2006) provides an interesting report on each of these regions. The report includes general characteristics of the microfinance sector, trends and some statistics. Microfinance sectors differ by focus (social or commercial), organization forms, loan size etc. I found it quite interesting that Asia had the lowest cost per borrower in the US$ - 50,0 compared to 176,1 in Latin America, 237.7 in Sub-Saharan Africa, 309,8 in Eastern Europe and Central Asia. The microfinance industry in the latter was characterized by higher loan sizes (due to higher income and education). Asia was characterized by strong social orientation.
Testing the empirical evidence, we will account for the possible effect of these regions in our model (chapter 10).
83 % 3 %
2 %
8 % 4 %
Asia and the Pacific Europe and Central Asia Latin America and Caribbean Middle East and North Africa Sub-Saharan Africa
3. Providers of financial services
3.1. Informal
Many poor people can’t access financial services from local banks because due to high costs or lack of collateral. For many of them family and friends become the most common provider of financial services. They can help you out in difficult situations but their resources are limited. Moneylenders have existed long in most of the societies. They know the locals and understand their situation. Though they can provide you with money when needed, their services can be very expensive. For example, poor farmers in India have no other alternative, then to get a loan from individual moneylenders at 100 percent interest rate (Mukherjee/Bloomberg, 2008).
Pawnbrokers, saving collectors, traders, clubs like ROSCAs and ASCAs are other sources of financial sources.Most of us are familiar with pawnbrokers, they offer loans in exchange for valuable items. Saving collectors provide a safe hiding place for you money. But instead of paying the clients interest rate (like commercial banks do), they charge them interest rates for keeping their money safe. According to CGAP (Helms, 2006) these fees can be up to 30 percent annualized interest rate in India. Traders and input suppliers are common loan providers for farmers. They offer fertilizers, seeds, money in exchange for repayment after crops (Helms, 2006).
ROSCAs (rotating savings and credit association) consist of group of people who gather in order to borrow and save together. They usually consist of 10-30 members who save regularly over a period of time together. The money is then distributed between the members, so that each participant gets a loan during the lifetime of a group. ASCAs (accumulating savings and credit associations) offer more flexibility to its clients, but require more management in return. These two types of groups are simple, efficient and transparent, but have a major drawback: cheating. Roy Mersland (Mersland, 2007) during his presentation on ROSCAs informed that more than 95 percent of participants have experienced losses. Among other problems he pointed out inflexibility, elite capture and exclusion of vulnerable members.
3.2. Member-based
These consist of Self-Help Groups, FSAs (financial service associations), CVECAs (Managed Village Savings and Credit Banks) and financial cooperatives (Helms, 2006). Self-Help Groups is the most common form of microfinance in India (Nair, 2005). They are similar to ROSCAs and ASCAs, but these groups are also eligible for bank loans, which they lend further to their members. Self-help groups reach poorer people and more remote rural areas, as well as they have low cost of establishment, but these groups are very fragile (Mersland, 2007). FSAs and CVECAs are other hybrid models of member-based groups that are used in Africa.
Financial cooperatives offer financial services to their member and are usually ran as non-profit organizations. Studies show that member of credit unions account for 72 percent of borrowers and 86 percent of depositors in Central Asia (Helms, 2006).It is hard to measure whether financial cooperatives reach poorer clients compared to MFIs, but in order to be successful they need to be small enough to monitor the members and big enough to ensure that no single group dominates (Helms, 2006).
3.3. NGOs
NGOs have evolved as an answer to banks that failed to reach poor clients. The Nobel Prize Winner 2006 Grameen Money Bank is probably the most well known NGO example (presented earlier). It provides services to almost 7,5 million clients in 81 574 villages in Bangladesh. (Grameen, 2008). During the last decade, many MFI transform into regulated financial institutions (The Blue Book, 2006). Since many NGOs depend on donor funding, this would enable them to access more funds and be more efficient. This issue will be discussed in the next chapter.
3.4. Formal Financial Institutions
unsuitable products, high costs or lack of collateral. Among formal providers of financial services are different types of banks (state, commercial, rural or community) and non-bank financial institutions are. They are profit driven, and may prioritize their financial goals before social ones. (Helms, 2006).
Mersland conducted a study on the cost of ownership in MFI and found no support to promote for profit institutions at the expense of non-profit ones (Mersland, 2007). A study on MFI efficiency (Gutierrez-Nieto, Serrano-Cinca, Mar Molinero, 2007) finds that NGO status was related to the MFI efficiency. The issue between access to funds and the institution type will be discussed more in the next chapter.
4. Funding Options
In order to provide financial services MFIs need funds. The range of funding options for microfinance stretches from bi- and multilateral donors to commercial investors and domestic capital markets. The first ones put more focus on social objectives (welfarists) of the MFI while the latter (institutionalists) are more concerned with commercial motivations.
Figure 4.1. The Landscape of Funding Options of Microfinance
Note: IFI = international financial institutions Source: Helms, 2006
The MicroBanking Bulletin provides MFI benchmark tables. The study of 200 MFI in 2003-2005 shows that the number of financially sustainable MFI has changed from 126 MFI in 2003 (63%) to 141 in 2004 (70,5%) and to 142 in 2005 (71%) (MicroBanking Bulletin, 2007). Though many MFI have proven that it is possible to provide financial services to the poor and make money, there are still others who wouldn’t survive without subsidies.
Testing the research model, we’ll account for possible effects of profit and non-profit motivation of MFIs. 4.1. Donors Public/ Social Commercial/ Private
Bi- and multiratural donors
IFIs Private funds Commercial Investors Foundations Domestic capital markets
The role of donors has been widely discussed in the microfinance literature. Inefficient and badly organized programs can do more harm than good. Such was the evidence in the Philippines where heavy subsidies designed to provide access for poor borrowers ended up in the hands of favored residents and only worsened income distribution. India’s Integrated Rural Development Program (IRDP) is another example of inefficient subsidized credit. The program failed due to very low rates, which led to low repayment rates and bad institutional performance (Morduch, 2005).
Another study suggests that in order to break even without subsidies in 1985-1996 Grameen Bank would have to increase it’s lending rates by 75% (Morduch, 2005).
Liza Valenzuela (ACCION, 2002) studies two questions. What kind of commercial institutions should donors support (advantages and disadvantages by peer groups: large commercial banks, small banks, state banks, finance companies, and strategic alliances) and what kind support is the most appropriate (loan funds, guarantee funds, technical assistance and operating expense support). The survey showed that some institutional types might have a slight advantage in regards to special objectives (ex. large banks reach the most poorest clients for the least investment, small bank reach the most poorest clients, while state banks and finance companies reach the highest number of clients). Technical assistance showed to be the most fruitful of donor interventions. The author argues that there is clearly a role for donors in advancing downscaling efforts.
Main concerns are that by having access to cheap financial funds, MFI are not motivated to achieve full financial self-sufficiency and may adjust their programs to please donors. Morduch (Morduch, 2005) suggests to use “smart subsidies”. This means subsidies during start-up phase of the MFIs, loans that target poorest customers who can’t afford to borrow at market rates or subsidize the cost of small loans since they are more costly pr $ lent.
4.2. Investors
Most of the foreign investments (almost 90%) concentrate on 2 regions: ECA (46%) and LAC (42%). While private investors have invested mostly in LAC, public investors chose to invest in ECA. Unfortunately, investors tend to compete for well-established regulated MFI regions leaving doubts to whether sufficient market opportunities exist for small funds (CGAP, 2004).
Figure 4.2. Disbursed Foreign Investment (in US$ millions)
All Investors
Region Total $ Total %
Eastern Europe and Central Asia (ECA) 502,2 46 Latin America and Caribbean (LAC) 457,9 42 Sub-Saharan Africa (AFR) 62,9 6 East Asia and the Pacific (EAP) 35,7 3
South Asia (SA) 29 3
Middle East and the North America (MENA) 8,8 1
TOTAL 1096,5 100
Source: CGAP (2004)
Foreign investments have some downsides. MFI can experience problems coping with foreign exchange risks. The other problem that might arise is conflict of interests since investors can offer both technical assistance and investments (Helms, 2006). Financial experience, good management and negotiating power will help to deal with these risks.
4.3. Domestic Capital Markets
The final stages of financial integration (SWWB, 2004) developed by Women’s World Banking lies in domestic funding markets. To access these funds MFI highly depend on local factors, MFI’s legal structure, require significant regulation and also time.
Gradual process highly dependent on local factors and the MFI’s legal structure
Time
Little to no Significant
regulation required regulation required
Source:SWWB, 2004
Many MFI work in developing countries with small financial sectors. Small economies of scales result in higher transaction costs. Access to financial markets is therefore limited and more expensive (The Blue Book, 2006).
Another problem lies on the institutional level. Weak operational capacity and management, lack of transparency, governance structure and limited ability to manage risk often characterize MFIs (The Blue Book, 2006). Thus investing in MFI might simply be too risky.
There are a couple of interesting issues I came along studying the area:
1) Lending to MFIs can lower bank’s ratings due to uncollateralized portfolios (The Blue Book, 2006)
2) Banks fear criticism for giving loans at high interests rates to the poor (The Blue Book, 2006)
More attention should be given to these problems. Banks should not fear that lending to the MFI may harm their reputation.
Savings Mobilization
Bank Lines of Credit
Donor or Concessionary Funding L ev el o f fi n an ci al i n te g ra ti o n
Savings mobilization is another source of funding. One of its strengths is independence from external funding. Low cost over time is another advantage (Helms, 2006). Savings mobilization requires higher level of integration and regulation. Microfinance industry suffers from the lack of transparency. Clients need reliable information in order to deposit their money. On the other side, many MFIs are non-regulated and are not allowed by government regulations to take deposits from clients.
Bonds issue allows the MFI to access funds from the domestic capital markets. As we see in our figure, this method is a gradual process that requires a high level of integration. Therefore it is not very common. Increased transparency would benefit MFIs in getting funds and local investors in making investments decisions.
Equity markets require the highest level of regulation and financial integration. I won’t go further into it. Local investors and MFI would benefit from higher transparency.
5. Microfinance Rating
5.1. Credit Risk Ratings?
Credit risk ratings date back to 1900s when John Moody&Company published its first manual with “information and statistics on stocks and bonds”. The use of ratings has grown and two decades later Moody’s rated almost all of the US bonds (Moodys, 2008).
Credit risk ratings provide information on credit worthiness of a company and the ability to meet its debt obligations. Based on fundamental credit analysis a rating agency gives a grade from highest credit quality to the lowest (Rating Fund, 2008).
Rating reports are useful to investors and companies as well as securities or governments being rated. While they use their rating reports to facilitate investments, investors use reports to decide what kind of risk they are willing to take and whether they want to invest (Investorpedia, 2008). Moody’s, Standard and Poors and Fitch IBCA are the leading rating agencies in the investment world.
5.2. Microfinance Ratings
Though MFI existed since 1970’s, the first MFI specialized rating agency did not appear until two decades later. There are two main types of microfinance ratings: credit risk ratings and global risk assessments (also known as performance assessments). As mentioned above, credit risk ratings focus on creditworthiness and the ability of an MFI to meet its financial commitments.
Global risk assessments “put more weight on operational elements such as appropriateness of lending methodologies and governance issues and allow comparability mainly to other MFIs”. (Navajas, Suaznabar, 2006).
Microfinance Rating Market Outlook (Rating Fund, 2006) published by CGAP provides a comparison of credit risk ratings and global risk assessments by regions.
Table 5.l. Global risk assessments and credit risk ratings by region, 2006
Region Global risk assessments
Credit risk ratings
LAC 83 125 (47 mandatory) Asia 108 3 (2 mandatory) SSA 30 0 EECA 37 0 MENA 17 0 Total 275 128 (49 mandatory) a
Mandatory risk ratings include multiple ratings of the same MFI in one year.
Source: Rating Fund, 2006
From the table above we can see that over half of all microfinance ratings in 2006 were conducted in LAC (30% of all global risk assessments and 98% of all credit risk ratings). This is consequent with the facts that Latin American microfinance market is mature and was the first one to start using microfinance ratings.
Though global risk assessments are created to fit the purposes of MFI, credit risk ratings dominate the region (60% of all ratings). This can be partly explained by the fact that some Latin America countries have mandatory regulations for MFI. For example in Bolivia (36 out of 47 mandatory ratings in LAC were done there) MFI that want to be regulated by the superintendent of banks must be rated by an authorized rating agency (Rating Fund, 2006).
Asia is the second largest market for ratings (28%) and the largest market for global risk assessments (39%). In 1994-2005 India was the leading country in the region accounting for 79% of credit risk ratings and global risk assessments performed (Rating Fund, 2006). SSA, EECA and MENA rating markets are smaller and represent respectively 11%, 13% and 6% of all global assessments and none of the credit risk ratings.
Let’s take a look at the microfinance rating market today (table 5.2). Though microfinance rating industry is quite young, it has evolved and expanded during the last years. 1809 ratings and assessments have been completed in the period 1997-2006. Not only has the demand for new ratings grown, but also so has the demand for repeat ratings and assessments. This means that organizations that have been rated before found rating useful and wanted to update their rating.
Table 5.2. Microfinance rating industry overview
1997–2006 2005 2006
Total number of ratings and assessments completed 1,809 327 403
First-time ratings or assessments 721 109 165
Repeat ratings or assessments 1,088 218 238
Global risk assessments 1,188 217 275
Credit risk ratings 621 110 128
Mandatory credit risk ratings 314 44 48
Proportion of Rating Fund co-financed ratings NA5 22% 24%
Source: Rating Fund, 2006
Global risk assessments dominate with 66% out of total ratings and assessments completed, leaving 34% to credit risk ratings (right above half of which where mandatory).
Though many MFI might find the ratings very expensive, the MFI can get their ratings co-financed. 22% of ratings in 2005 and 24% of ratings in 2006 were co-financed by the Rating Fund, an organization created to stimulate the demand for MFI ratings/assessments and improve transparency. These issues will be addressed more closely later in the paper.
Rating agencies are independent suppliers of microfinance rating services. They have developed their own rating methodologies that differ between the agencies. Though some
agencies put more weight on some factors compared to the others, the process of a rating consists of the following analysis:
Figure 5.1. Microfinance Rating
Source: Rating Fund, 2006
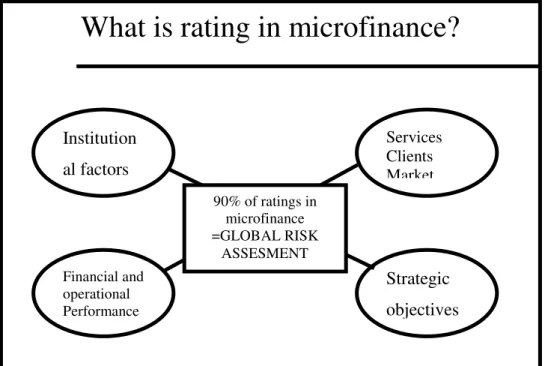
A rating agency starts by studying qualitative aspects such as institutional factors, services, clients and the market. It looks at the organization, its history, form of governance, staff etc. Then the agency studies clients, services provided (their quality and portfolio quality) and the market itself.
The next part is the analysis of quantitative factors. Such analysis of financial and operational performance helps the raters to study risks, financing strategy, profitability and efficiency.
Finally the agency compares the strategic positioning with the objectives. The raters also look at the market and trends. This type of analysis enables comparison of the MFI within peers and the industry.
What is rating in microfinance?
Institution al factors Financial and operational Performance Strategic objectives Services Clients Market 90% of ratings in microfinance =GLOBAL RISK ASSESMENT
Objectives and benefits
The Rating Fund states that the primary objective of MFI ratings is to facilitate the relationship with partners.
Figure 5.2. Objectives and Benefits of Ratings
Source: Rating Fund, 2006
Investors might be reluctant to invest in MFI if they don’t get complete, accurate, reliable and standardized information. Some countries (in Latin America and Asia) require mandatory rating for MFI fulfilling special requirements.
On the other hand a rating helps the MFI to understand its strengths and weaknesses.
Objectives and benefits
Primary objective: facilitate the relationship with partners
Rating exercise helps the MFI understand its strengths and weaknesses
Rating report adapted to investors’ needs Complete accurate, reliable, and
standardized information MFI Rating agency Partners (investors , donors)
Figure 5.3. Benefits of Ratings
The benefits of ratings for MFIs
Improving Performance
Attracting Funders
Managers can use the evaluating process to:
• focus on how and where to improve
• compare their performance with peers
• evaluate their standing in the microfinans industry and set performance targets
Thir party verification of MFI performance information and risk management assessment allows:
• Investors and donors to judge the relative quality of MFIs
• MFIs to earn higher transparency ranking on the MIX Market, which links investors with MFIs
Source: Rating Fund, 2006
Ratings help MFI to improve their performance. Learning about its strengths and weaknesses will help the management to focus on the right aspects, set long-term goals and address its problem areas.
MFI can compare their performance with peers and the microfinance industry. This can serve as an incentive to improve or can help the MFI to benchmark.
Another benefit of rating is to attract funds. Investors and donors require reliable information on the MFI performance in order to decide whether to place their money in the MFI. Originally MFI ratings were done to satisfy the donors needs. They put more weight on how funds are used on special projects and not the institution’s (Rating Fund, 2006). In other words, donors focus more on social objectives and outreach (Gutierre-Nieto, Serrano-Cinca, 2007).
Investors are more concerned with sustainability. They focus more on financial performance and are looking for profitable “social” investments(Rating Fund, 2006).
All ratings co-sponsored by the Rating Fund are public. Though ratings can be used to attract funds, many MFI are afraid that a negative rating can do the opposite. Before doing a public rating, MFI can use an external source to evaluate them first. This can be an effective way to improve the weaknesses, the insiders (managers, staff) might oversee.
5.3. Microfinance Rating Agencies
The microfinance rating market is represented by 15 suppliers of rating services. These agencies can be divided into the following categories: specialized agencies; regionally or single-country based agencies that rate financial organizations and mainstream credit risk rating agencies (Rating Fund, 2008). They provide global risk assessments, credit risk rating or both. Table 5.3 provides an overview of five major MFI rating agencies: MicroRate, Planet Rating, Microfinanza, Crisil and M-Cril. Information for the table is gathered from agencies’ websites and the Rating Fund.
All rating agencies are experienced raters that performed from 180 to 420 ratings. If we take a look at geographical coverage, all of them operate globally except for Crisil that performs ratings in India. These five agencies use both quantitative and qualitative analysis in
performing ratings. Planet Rating, Microfinanza and M-Cril value quantitative and qualitative analysis similarly (40% and 60%). Crisil bases its ratings slightly more on quantitative
analysis 45% (thus 65% on qualitative). MicroRate uses qualitative analysis the most compared to the other four agencies (70%).
An insight into agencies’ methodology shows that they are not the same. Each agency uses its own rating methodology. They include more or less the same aspects and cover institution, its risk and financial performance, management, governance. Studies of microfinance
methodologies (Jardosh 2007, Xavier 2002) show that even if microfinance use the same indicators, they may define them differently. Both researchers come to a conclusion that a standardized rating system is needed. Another difference is the rating scale. All rating
M -C ril C ris il M ic ro fin a n z a P la n e t R a tin g M ic ro R a te A g en cy 4 2 0 4 0 0 2 1 0 1 8 0 2 8 0 N u m b er o f ra tin g s p er fo rm ed C E E /N IS , S o u th A s ia , E a s t A s ia & th e P a c ific S o u th A s ia A fri c a , M E N A , C E E /N IS , L a tin A m e ric a , S o u th A s ia , E a s tA s ia & th e P a c ific A fri c a , M E N A , C E E /N IS , L a tin A m e ric a , S o u th A s ia , E a s tA s ia & th e P a c ific A fri c a , M E N A , C E E /N IS , L a tin A m e ric a G eo g ra p h ic al co v er ag e Q u a n tit a tiv e 5 1 % , q u a lit a tiv e 4 9 % Q u a n tit a tiv e 4 5 % , q u a lit a tiv e 5 5 % Q u a n tit a tiv e 4 0 % , q u a lit a tiv e 6 0 % Q u a n tit a tiv e 4 0 % , q u a lit a tiv e 6 0 % Q u a n tit a tiv e 3 0 % , q u a lit a tiv e 7 0 % N at u ra o f o v er al l an al y si s G o v e rn a n c e a n d s tra te g y , m a n a g e m e n t s y s te m s , fin a n c ia l p e rfo rm a n c e M IC R O S : m a n a g e m e n t a n a ly s is , i n s tit u tio n a l a rr a n g e m e n t, c a p ita l a d e q u a c y & a s s e t q u a lit y , re s o u rc e s , o p e ra tio n a l e ffe c tiv e n e s s , s c a la b ilit y & s u s ta in a b ilit y E x te rn a l e n v iro n m e n t& c o m p e tit iv e p o s itio n in g , g o v e rn a n c e & o p e ra tio n s , f in a n c ia l p ro d u c ts , a s s e ts s tru c tu re & q u a lit y , f in a n c ia l s tru c tu re & a s s e t l ia b ilit y m a n a g e m e n t, o p e ra tio n a l& fin a n c ia l r e s u lts , s tra te g y & fin a n c ia l n e e d s G IR A F E : g o v e rn a n c e , i n fo rm a tio n , r is k m a n a g e m e n t, a c tiv itie s , f in a n c in g & liq u id ity , e ffi c ie n c y & p ro fit a b ilit y F in a n c ia l p ro fil e , o p e ra tio n a l p e rfo rm a n c e , p o rtf o lio q u a lit y , m a n a g e m e n t& o rg a n iz a tio n , g o v e rn a n c e & s tra te g ic p o s itio n in g M et h o d o lo g y α + + + , α + + , α + , α , α -, β + , β , β -, γ + , γ m fR 1 , m fR 2 , m fR 3 , m fR 4 , m fR 5 , m fR 6 , m fR 7 , m fR 8 A A A , A A , A , B B B , B B , B , C C C , C C , C , D A + , A , A -, B + , B , B -, C + , C , C -, D , E α + + , α + , α , α -, β + , β , β -, γ + , γ , γ - R at in g s ca le
6. Theory
6.1. Transparency
According to CGAP, ”transparency is essential if the microfinance industry is to reach scale.” (CGAP, 2008). Transparency has two goals: improved MFI performance and commercialization of microfinance. Information on MFI’s performance and comparison with peers motives the management to deal with the weaknesses and improve performance. The latter can be achieved by providing accurate and reliable information to the funders (CGAP, 2001).
Ratings are a part of an MFI’s transparency sequence:
Figure 6.1. What Is A Rating?
Source: The Rating Fund, 2006
What is a rating?
•
Part of an MFI’s transparency sequence
•
Collect the data Equity Markets Monitor and Compare Analyze and understand reality behind figuresMFI starts the transparency sequence by using information systems to collect the data. First the data’s integrity is verified within the MFI through internal controls, and then outside the organization through external audit.
Assessments and microfinance ratings help to monitor, compare, analyze and understand the gathered information. The MFI can be studied not only based on its own performance, but can also be compared to other actors in the industry and can benchmark itself. Further governments or other authorities can use these reports for supervision purposes. (CGAP, 2001).
Accurate and reliable information would benefit all parties. The MFI would be able to identify their weaknesses and deal with them. Clients would benefit from knowing about financial performance of MFIs. This would give them a clue to whether the MFI is risky and could have troubles in meeting its obligations. Investing in a risky MFI could be a threat towards deposit’s safety. (Rating Fund, 2006) Some donors and funders can be reluctant about investing in unrated MFIs. Transparency would help them to find organizations according to their risk profiles.
Mixmarket is a microfinance information platform. It aims to promote transparency. Information on MFIs, investors, raters, agencies and advisory firms can be find there. Mixmarket publishes information on MFIs, investors, raters, advisory firms etc. (Mixmarket, 2008). Among other promoters of transparency is the Rating Fund. It does so by co-funding rating of the MFI. As a part of the deal, these ratings are available to public through their website (Rating Fund, 2008).
6.2. Agent theory
Now let’s use the agent theory on the case with MFIs. Agency relationship occurs when one party acts on behalf of another. The principal-agent problem assumes that the agent has an informational advantage over the principal. The principal compensates the agent to work on his behalf, but he is not sure whether the agent advances principal’s goals(Milgrom, 1992). A graphical representation can be found below:
Figure 6.2. Principal-Agent Problem
Source: Wikipedia, 2008
We can use this model in microfinance on a relationship between donors (principals) and MFI managers (agents). Donor provides a subsidy and of course wants the money to be used in a best possible way. Manager might have different interests. Since many MFI are unregulated and unsupervised, donors can suffer from moral hazard. Microfinance ratings would improve the availability of information and reduce information assymetry.
7. Previous studies
7.1. Bond ratings
Horrigan 1966
Horrigan was the first one to predict bond ratings. He used regression analysis to find independent variables for his equation. Those ratios that had the highest R2 and most significant t-statistics were chosen. (Kaplan and Urwitz, 1975). The final independent variables used for the study were: subordination, total assets, ratios of working capital over sales, net worth over total debt and sales over net worth and net operating profit over sales (Ang and Patel, 1975). Horrigan’s model could predict 58% of Moody’s ratings and 52% of Standard & Poor’s ratings.
West 1970
West believed that ratings were highly correlated to risk premiums (Ang and Patel, 1975). He took another approach and chose determinants of risk premiums from Fisher’s study as variables for the model and not financial ratios as Horrigan. West used four independent variables: earnings variability, period of solvency, equity to debt ratio and bonds outstanding. The model could predict 62% of Moody’s ratings.
Pogue and Soldofsky 1969
Pogue and Soldofsky developed a regression model based again on the financial ratios. They identified five independent variables for their study: long-term debt to total assets, net income to total assets, coefficient of variation of earnings, total assets and interest over interest charge. The model could predict 80% of Moody’s ratings (Ang and Patel, 1975)..
Pinches and Mingo 1973 and 1975
Pinches and Mingo used multiple discriminant analysis (MDA) to predict bond ratings. The model was based on subordination, size, leverage, long-term and short-term capital intensity,
return on investment, earnings stability and debt coverage as main determinants of ratings. This model correctly predicted 60% of new ratings.
A follow up study was performed 2 years later and the model predicted correctly 75% of new ratings (source: Ang and Patel, 1975).
Kaplan and Urwitz 1979
Kaplan and Urwitz used probit analysis based on financial ratios and risk measures such as interest coverage ratios, capitalization (leverage) ratios, profitability ratio, size variables, stability variables and a dummy variable that represented subordination status. The model could predict 69% of new ratings (Ang and Patel, 1975).
Belkaoui 1980
Belakoui used an MDA model including eight independent variables – namely, total assets, total debt, long-term debt to total capitalization, short-term debt to total capitalization, current ratio, fixed charge coverage ratio, stock price to common equity per share and subordination status (Hyunjoon and Zheng, 2004).
7.2. Microfinance ratings
Hartarska 2005
Since ratings in microfinance are still rather new, only a few studies were done on rating of MFI. The study of Valentina Hartarska suggests that rating may have a potential to impose market discipline in microfinance, but not all microfinance rating agencies are the same (Hartarska, 2005).
Gutierrez-Nieto, Serrano-Cinca and Mar Molinero 2005
Gutierrez-Nieto, Serrano-Cinca and Mar Molinero used Data Envelopment Analysis to measure the efficiency of MFI’s (Gutierrez-Nieto, Serrano-Cinca, Mar Molinero, 2005). The
components (overall measure of efficiency, NGO status, input choice and output choice). Organization type (NGO or non-NGO) and country had also effects on efficiency.
Rosenberg 2005
Rosenberg (Rosenberg, 2005) studied core performance indicators in microfinance. He identified five minimum financial performance indicators for retail financial institutions. Those are: outreach, depth of outreach, portfolio quality, financial sustainability and efficiency.
Gutierrez-Nieto and Serrano-Cinca 2007
Gutierrez-Nieto and Serrano-Cinca studied determinants of MFI ratings. Their research was based on 70 MFI ratings completed by one rating agency - Planet Rating. Factors explaining MFI rating were size, profitability, efficiency, risk and social performance of MFIs. As assumed, the results of the study showed positive and significant relationships on rating of size, profitability, efficiency of MFI and a negative and significant relationship of risk of MFI. However no relationship was found between social performance of MFI and rating assigned (Gutierrez-Nieto and Serrano-Cinca, 2007)
8. Hypotheses
Hypothesis is a statement that explains certain facts or phenomena. Hypothesis consists of a null hypothesis (H0) and an alternative hypothesis (H1). A null hypothesis states that any effect we state or explain is due to random error (Zikmund 2003, p.44). In this study null hypotheses will state that there is no relationship between MFI rating grade and size, risk, productivity, efficiency, profitability and social performance of MFI. An alternative hypothesis is the opposite of a null hypothesis. In our case hypotheses will state that there is a relationship between those variables and will indicate their direction (positive or negative).
Hypothesis testing will help us to find which of the two hypotheses is true. If stated relationship exists, then we will reject the null hypothesis and accept the alternative hypothesis. If the relationship will not be found to be true, we will accept the null hypothesis and reject the alternative hypothesis. The procedure of hypothesis testing will be described more in chapter 11.
Theory and earlier observations will help us to determine our hypotheses. In the previous studies on bond ratings financial ratios and risk measures were used as main determinants of ratings. In general, the variables that had the highest explanatory power were subordination status, size, earnings stability, leverage, earnings coverage of interest and profitability. (source: Kaplan&Urwitz, Statistical models of bond ratings, p. 242). These models could correctly predict 60-80% of ratings.
Hartarska (Hartarska, 2005) states that microfinance ratings may help to impose market discipline. Gutierrez-Nieto and Serrano-Cinca (Gutierrez-Nieto and Serrano-Cinca, 2007) study determinants of MFI ratings and constitute that MFI size, risk, profitability, efficiency and productivity effect the rating grades. Gutierrez-Nieto, Serrano-Cinca and Mar Molinero (Gutierrez-Nieto, Serrano-Cinca and Mar Molinero, 2005) find that NGO-status of MFI and the country they operate in effects efficiency.
Table 9.1. Hypotheses
Variable Hypotheses
Size +
Risk -
Efficiency and productivity +
Profitability +
Social performance +
8.1. Hypothesis 1: Size
Previous studies on bond ratings by Horrigan (1966), Pogue and Soldofsky (1969), Pinches and Mingo (1973 and 1975), Kaplan and Urwitz (1979) and Belkaoui (1980) as well as study on MFI ratings by Gutierrez-Nieto and Serrano-Cinca (2007) included variables measuring size as determinants of ratings.
Larger MFI should benefit from economies of scales. They are usually better in paying their obligations. Larger MFI can adjust better to economical and political changes.Therefore the first hypothesis is:
H10: There is no relationship between MFI size and the rating grade.
H1A: A positive and significant relationship exists between MFI size and the rating grade.
8.2. Hypothesis 2: Risk
Rating assesses creditworthiness of MFI. A poor rating indicates a higher risk, and thus leads investors to require higher interest rates in return. (Wikipedia, 2008; Gutierrez-Nieto & Serrano-Cinca, 2007) included risk measures in their studies on ratings. The second hypothesis is the following:
H20: There is no relationship between MFI risk and the rating grade.
8.3. Hypothesis 3: Efficiency and Productivity
“Efficiency and productivity are performance measures that show how well the institution is streamlining its operations” (MicroRate). Productivity refers to measures of output pr unit of input. Efficiency goes further and compares production with cost.
Most of the previous studies on ratings described earlier include these financial ratios in their models (see chapter 7). The third hypothesis is:
H30: There is no relationship between MFI efficiency and productivity and the rating grade.
H3A: A positive and significant relationship exists between MFI efficiency and productivity
and the rating grade.
8.4. Hypothesis 4: Profitability
Profitability compares performance in all areas of MFI. The review of previous studies on ratings very often includes profitability measures as independent variables in their research (see chapter 7). Therefore we expect profitable MFI to be better in meeting their obligations, and thus acquire higher rating. The fifth hypothesis is as follows:
H40: There is no relationship between MFI profitability and the rating grade.
H4A: A positive and significant relationship exists between MFI profitability and the rating
grade.
8.5. Hypothesis 5: Social performance
MFIs are organized both as for-profit and non-profit organizations. Therefore MFI include some unique features since they can be compared both with financial institutions and NGOs. When funding MFIs, donors put more focus on outreach, while investors – on sustainability. According to CGAP (Helmst, 2006) all international investors in microfinance “are willing to accept a more modest return on their investments in exchange for the social returns generated by microfinance”. More outreach often means less sustainability and more risk, thus poorer financial performance, which should lead to lower rating. But due to unique nature of MFIs (they carry social objectives and missions), a special attention should be given to social
Some studies found a positive relationship between social performance and company performance, while Gutierrez-Nieto and Serrano-Cinca (2007) found no relationship between financial and social performance of MFIs.
All rating agencies have different methodologies. Some might put more weight on social indicators, while others - on financial. Besides all MFI rating agencies claim to evaluate MFIs on the institutional level and study its objectives and mission. In this study, rating reports from five different rating agencies will be used. I assume that social performance would be an important variable to explain the MFI rating grade. Therefore I assume the following hypothesis to be:
H50: There is no relationship between MFI social performance and the rating grade.
H5A: A positive and significant relationship exists between MFI social performance and the
9. Empirical Research
In this section we describe our empirical study. We start by describing how the data was collected. Then we regard the issue of reliability and validity. In section on data preparation we tell how information was checked for deviations, wrong entries and missing values. Since regression analysis assumes that the variables are normally distributed, some of the variables had to be transformed. We discuss data transformation and present the variables.
9.1. Data collection
For this study, global risk assessments from five major rating agencies were used. Since not all MFIs make their reports available for publicity, the reports available through the
Microfinance Rating and Assessment Fund (later the Rating Fund) were chosen. It is a joint initiative started in 2001 between Inter-American Development Bank (IDB), the Consultative Group to Assist the Poor (CGAP) and joined in 2005 by the European Union. (Rating Fund, 2008). The main objectives of the Fund are:
1) Market-buildingfor MFI rating and assessment services
2) Improved transparencyof MFI financial performance
In order to do this, the Rating Fund co-finances rating services for MFIs. The rating reports that have received subsidies from the fund, are available online. More than 429 reports of MFIs worldwide are available to public through fund’s website www.ratingfund.org.
For this study, only global risk assessments were used. They focus not only on creditworthiness, but analyze MFI’s global performance (operational and financial, management’s capability) (Rating Fund, 2008). Further, only rating reports by five major rating agencies, namely - Planet Rating, Microfinanza Srl, MicroRate, Crisil and M-Cril were chosen.
Working with rating reports done by different agencies is a challenge due to lack of standardization. Previous studies show (Jardosh; Reille, Sananikone & Helms) that microfinance rating agencies use different approaches and put more weight on different factors. This should, however, have only a minor influence on the database, since
“comparison of the methodologies applied by the rating agencies reveal no major differences in MFI assessment” (Mersland)..
Another challenge is that rating agencies use different rating scales. This problem was eliminated by converting rating scales used in the study into a uniform rating scale developed by Roy Mersland (Roy Mersland, Ph.D. student at Agder University).
After these selections, the final dataset contained 290 global risk assessments. The MFIs presented were evaluated between 2000 and 2007 and come from 60 different countries. Roy Mersland (Roy Mersland, Ph.D. student at Agder University), developed the dataset and it was a big honor and pleasure to be working with him.
9.2. Reliability and Validity
In order to make a correct study we need to be sure that all data is reliable and valid. Reliability refers to the ability to provide consistent free from error results. The ability of a measure to measure what it’s designed to measure is called validity (Zikmund, 2003). The data in our sample is collected from rating reports. The variables are either given in the report or calculated from MFI income statements. The calculations are based on standard financial formulas (ex. operating expense ratio, portfolio at risk). Other variables, like for example total assets are given in the income statements. This should mean that the scales provide a correct measure. Other variables, like for example total assets were given in the report. Since rating grades are transformed using a uniform rating scale, a control variable for agency is used in the model to control for possible effects.
9.3. Data Preparation
Descriptive statistics was used to check for outliers and wrong values. Minimum, maximum and mean values for each variable helped to check for deviations. A graph function in SPSS was used to build graphs with rating grade and each of the independent variables. All special cases were given attention. For example, variable portfolio at risk had 8 measures were the value was equal to 0. To make sure that none of this was due to a wrong entry, each variable
was checked in the rating reports. Variable average loan outstanding had an unusually high value for MFI Rural Finance Corporation. The value was found correct and was a good example for the model. Variables that were measured on nominal scales (ex. type, agency) were checked for wrong and missing values. The aim was to keep as many cases as possible in the dataset. Data transformation helped to deal with some outliers and high deviations. Cases with missing values were also excluded. Out of 248 cases the final sample included 229 cases after data preparation.
9.4. Data Transformation
The aim of this paper is to show the relationship between the MFI rating grade and MFI size, risk, profitability, social performance, efficiency and productivity. The model to test hypotheses uses multiple regression analysis. It allows analyzing the relationship between two or more independent variables on the dependent variable. Regression analysis requires the data to be normally distributed: linear, normal and homoscedastic (Wikipedia, 2008). If the variables aren’t normally distributed, the problem can be solved by data transformation. It is used to transform data to a format that better supports data analysis (Zikmund 2003). To measure if the variables are normally distributed, we will use frequency function in descriptive statistics. We will use two indicators: skewness and kurtosis. Skewness measures asymmetry of the distribution. Figure below provides an illustration of negative and positive skew. Normally distributed values are symmetric with a skewness of 0. As an indicator of normal distribution we will use data with a skewness between –0,8 and 0,8 (Wikipedia, 2008).
Kurtosis indicates how observations cluster around a central point. Normally distributed data has a Kurtosis statistic value of 0. (SPSS Tutorial, Frequencies Statistics). High values indicate that more of the variance is caused by extreme deviations. As a rule, we will consider the data to be normally distributed with kurtosis in the range of –3 to 3 (Wikipedia, 2008). For each of the variables in the regression model, a histogram of frequency distribution was constructed. It is a good way to illustrate whether the data is normally distributed. We checked for the values of skewness and kurtosis statistic.
Several variables were not normally distributed and needed to be transformed. Variables the rating grade, operational self-sufficiency and assets rotation showed normal distribution. Variables total assets and average loans outstanding had a very high range. Other variables, like portfolio at risk and operating expense ratio had to high skewness and kurtosis values. Common transformation techniques are square root, logarithm, inverse or power (includes all the others and cube root) (Wikipedia). Figure 10.2 provides a graphical illustration of some of the techniques.
Figure 9.2. Data Transformation
Model Transformation Model Transformation
1) Square Root 4) Reflect and
Square Root
2) Logarithm 5) Reflect and
Logarithm
3) Inverse 6) Reflect and
Inverse