ISSN: 2302-9285, DOI: 10.11591/eei.v8i4.1628 1303
Comparative analysis on bayesian classification for breast
cancer problem
Wan Nor Liyana Wan Hassan Ibeni, Mohd Zaki Mohd Salikon, Aida Mustapha, Saiful Adli Daud, Mohd Najib Mohd Salleh
Faculty Computer Science & Information Technology, Universiti Tun Hussein Onn Malaysia, Malaysia
Article Info ABSTRACT
Article history: Received Apr 30, 2019 Revised Jun 20, 2019 Accepted Jul 6, 2019
The problem of imbalanced class distribution or small datasets is quite frequent in certain fields especially in medical domain. However, the classical Naive Bayes approach in dealing with uncertainties within medical datasets face with the difficulties in selecting prior distributions, whereby parameter estimation such as the maximum likelihood estimation (MLE) and maximum a posteriori (MAP) often hurt the accuracy of predictions. This paper presents the full Bayesian approach to assess the predictive distribution of all classes using three classifiers; naïve bayes (NB), bayesian networks (BN), and tree augmented naïve bayes (TAN) with three datasets; Breast cancer, breast cancer wisconsin, and breast tissue dataset. Next, the prediction accuracies of bayesian approaches are also compared with three standard machine learning algorithms from the literature; K-nearest neighbor (K-NN), support vector machine (SVM), and decision tree (DT). The results showed that the best performance was the bayesian networks (BN) algorithm with accuracy of 97.281%. The results are hoped to provide as base comparison for further research on breast cancer detection. All experiments are conducted in WEKA data mining tool.
Keywords:
Bayesian classification Breast cancer
Supervised learning
Copyright © 2019 Institute of Advanced Engineering and Science. All rights reserved. Corresponding Author:
Mohd Zaki Mohd Salikon,
Faculty Computer Science & Information Technology, Universiti Tun Hussein Onn Malaysia,
Parit Raja 86400, Batu Pahat, Johor, Malaysia. Email: [email protected]
1. INTRODUCTION
Breast cancer is the top number one cancer in Malaysia. The statistic shows that 1.6 million new cases are diagnosed worldwide and 2,015,560 women will die of breast cancer every year. This information is sourced from the World Health Organization (WHO) and National Cancer of Malaysia [1]. Statistics from Malaysian Study on Cancer Survival (MySCAN) published by Ministry of Health in September 2018 has shown a total of 17009 patient suffering from breast cancer with 7372 death reported. Age group of 45-54 years old (34.9%) make up the largest patient and 75 years old and above (3.9%) is the smallest group of patient.
According to the National Breast Cancer Foundation [2], there are two type of tumors: malignant (cancerous) and benign (non-cancerous). The cancerous tumors aggressively invade and damage surrounding tissues. The malignant tumors have three grades to differentiate, where the lowest grade of malignant tumor is well differentiated while the highest grade is poorly differentiated. High grade tumors highly resemble healthy cells and have higher tendency to be aggressive. There is no exact symptom can accurately diagnose the cancer but breast cancer has symptom like swelling at some part or the entire breast, dimpling or skin irritation, breast or nipple pain, thickening or retraction of nipple, nipple discharge and lump in the underarm
area. Breast cancer on male is rare but born as a male is not an exception to the risk of having breast cancer. The risk of cancer is about 1 in 1000.
Breast cancer research falls under the category of medical, which as in other fields, use data mining to analyze past experiences and identify trends and solutions to the present situations [3]. Data mining is well-known analytical methodology to extract such invaluable information and is especially efficient to work with large volume of medical data [4]. The methodology varies from predictive models that enable classification and prediction as well as clustering models that for discovering groups or patterns from data [5]. Salama et al. [6] compared five different classifiers using three different breast cancer datasets. The chosen classifiers were Naïve Bayes (NB), Multi-Layer Perception (MLP), Decision Tree (J48), Instance-based for K-Nearest Neighbor (IBK), and Sequential Minimal Optimization (SMO). Along the line, Aruna et al. [7] investigated the performance of different classification algorithms similar to [6], which were Naïve Bayes and Decision Tree J4 as well as new algorithms such as the Support Vector Machines, Radial Basis Neural Networks, and and simple Classification and Regression Trees (CART). Meanwhile, Bashir et al. [8] proposed a feature selection component to classification problem while maintaining conventional classification algorithms such as the Decision Tree, Bayesian algorithms, Rule-based algorithms, Neural Networks, Support Vector Machines, Associative classification, Distance-based methods, and Genetic algorithms.
Following previous research, this work used breast cancer datasets obtained from UCI Machine Learning Repository from [9], which are Breast Cancer [10], Breast Cancer Wisconsin [11], and Breast Tissue [12]. This paper presents comparative analysis on the performance of three classification algorithms, which are the Naïve Bayes (NB) [13], Bayesian Networks (BN), and Tree Augmented Naïve Bayes (TAN) [14] as well as with algorithms from the existing literature such as K-Nearest Neighbor (KNN), Support Vector Machine (SVM), and Decision Trees (DT) based on breast cancer dataset. Following [15], this paper will be using accuracy, precision, recall and F-measure for evaluation [16]. These standard measures have significantly higher correlation with human judgments and an intuitive interpretation. NB classifiers improved accuracy with high speed [17-19]. The results showed that the NB classifier provides better performances [20-21]. The accuracy, sensitivity and specificity up to 90% and above [22]. Dian E. R., Nurizal D. P. & Machsus Machsus [23] is promising and able to enhance the prediction on Breast Cancer Wisconsin data.
The rest of the paper is organized as follows. Section 2 describes the research methodology and the proposed classification approach on dataset for finding the best performance of algorithm. Section 3 shows the experimental results and finally Section 4 concludes the work and highlights a direction for future research.
2. RESEARCH METHOD
This section presents a data mining approach for a classification problem. A data mining process that describe about data mining approach to tackle the problem. This methodology is implement to get the best result from the classification experiment. In this, research using Knowledge Discovery in Database (KDD) from [14] as model methodology. There are important phases that have to get the best result at the research. There are five phase in KDD which are Selection, Preprocessing, Transformation, Classification and Evaluation. Figure 1 shows the KDD model. Based on Figure 1, KDD model is an iterative process when evaluation measures can be enhanced. The detail of each phase is discussed in the next sub-sections.
2.1. Dataset selection
This research used three breast cancer dataset was obtained from UCI machine learning repository from Brown [9], which are breast cancer (WDBC), wisconsin breast cancer (WBC), and breast tissue. The Breast Cancer Wisconsin dataset contains 699 instances with two classes that are benign and malignant. The benign class contains 458 instances while the malignant contains 241 instances. Breast cancer contains 10 attributes; which are sample code number, clump thickness, uniformity of cell size, uniformity of cell shape, marginal adhesion, single epithelial cell size, bare nuclei, bland chromatin, normal nucleoli, and mitoses. The excerpt of the dataset is shown in Figure 2.
Figure 2. Breast cancer wisconsin (BCW) dataset
The breast cancer dataset contains 286 instances with two classes that are recurrence-events and no-recurrence-events. The recurrence-events class contains 85 instances while the no-recurrence-events contains 201 instances. This dataset contains nine attributes, which include age, menopause, tumor-size, inv-nodes, node caps, deg-malig, breast, breast-quad, and irradiat. The excerpt of the dataset is shown in Figure 3.
Figure 3. Breast cancer (BC) dataset
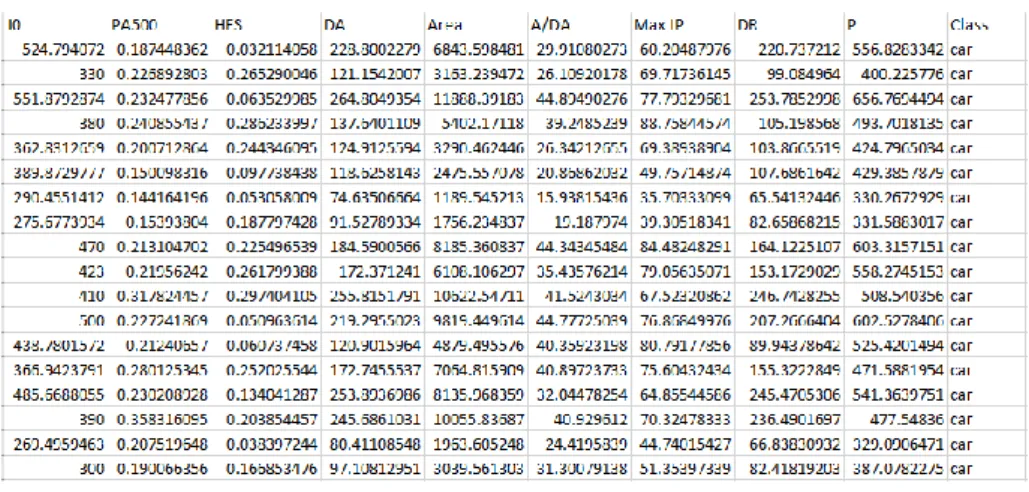
The Breast Tissue dataset contains 106 instances with six classes that are Carcinoma (CAR), Fibro-adenoma (FAD), Mastopathy (MAS), Glandular (GLA), Connective (CON), and Adipose (ADI). The class Carcinoma (CAR) contains 21 instances, Fibro-adenoma (FAD) contains 15 instances, Mastopathy (MAS) contains 18 instances, Glandular (GLA) contains 16 instances, Connective (CON) contains 14 instances, and Adipose (ADI) contains 22 instances. Breast Tissue contains nine attributes that include
impedivity (ohm) at zero frequency, phase angle at 500 KHz, high-frequency slope of phase angle, impedance distance between spectral ends, area under spectrum, area normalized by DA, maximum of the spectrum, distance between 10 and real part of the maximum frequency point, and length of the spectral curve. The excerpt of the dataset is shown in Figure 4.
Figure 4. Breast tissue (BT) dataset
2.2. Preprocessing
The types of the breast cancer wisconsin dataset are categorized as asymmetric. It means they are class breast cancer dataset represented using into categories benign or malignant. The attributed value of breast cancer dataset not completely record. That have only one attribute have missing values which are Bare Nuclei that have 2% of missing value are denoted by “?”. To handle the missing value in machine learning is one of the important things to get the best accuracy.
In this paper imputation is a way of handling missing value by replacing them with meaningful replacement values. Since „Bare Nuclei‟ is a categorical attribute, this experiment has use to handling the missing values of the attribute. Based on the breast cancer dataset given the mode for the attribute „Bare Nuclei‟ is‟1-10‟ since it has the maximum value which is 10. Figure 5 and Figure 6 show the before and after dealing the missing value.
Figure 5. Before dealing with missing values Figure 6. After dealing with missing values
2.3. Transformation
The breast cancer dataset is divided into training and testing sets based on 10-fold validation method where nine parts is for training the algorithm and the last one part for assessing the algorithm. This breast cancer dataset will be using accuracy estimation because this is effective measure of the performance of a classifier. Figure 7 shows the procedure of accuracy rate estimation adopted from Mitani and Hamamoto [24].
Figure 7. Accuracy rate estimation [24]
2.4. Classification algorithms
In this work, there Bayesian classification algorithms explored, which are the Naïve Bayes (NB), Bayesian Networks (BN), Tree-Augmented Naïve Bayes (TAN).
Naive Bayes (NB) algorithm is one type of probabilistic classifier based on the Bayes theorem. NB produces a probability that a given instance belongs to that class rather than prediction. One main advantage of NB is that it only requires small amount of training data because it is based on major assumption that an attribute value on a given feature is always independent from the values of other features. This assumption forms the basis of NB and is widely known as class conditional independence [25].
Bayesian Networks (BN) is a type of directed acyclic graph where the nodes represent domain variables and are connected with arcs that represent dependencies between the variables. BN is composed of the network structure and its conditional probabilities. Meanwhile, the Tree Augmented Naïve Bayes (TAN) incorporates some dependencies between the attributes by building a directed tree among the attribute variables. This means the n attributes will form a directed tree that represents the dependency relations between the attributes. This learning algorithm creates a TAN graph structure whereby a single class variable has no parents while other variables have the class as a parent or at most one other attribute as a parent.
Next, the results from Bayesian classification algorithms will be compared with K-Nearest Neighbor (KNN) and Support Vector Machine (SVM) from the literature. K-Nearest Neighbor Algorithm (KNN) is an algorithm to classify the object based on the learning data that is closest to the object. There has two basic k-Nearest Neighbor Classification algorithm to be considered, (1) finding the k training instances that are closest to the unseen instances or (2) taking the most commonly accruing classification for these k instances. Using k is to reduce the effect of the presence of point noise. A number of neighbor making a decision is considered better than a single neighbor making a decision.
Support Vector Machine (SVM) is a classification technique used in the case of classification. SVM scans for the best hyper plane which serves as a separator of two classes in the input space, where the input data serve as a vector in an n-dimensional space. The hyper plane separation sets as margin to be as big as possible between both sets of data. The margin is calculated by constructing two parallel hyper-planes that separate between the two sets of data. In an obvious case, a good separation can be accomplished with a hyper-plane which has the largest distances to neighboring data points in both classes. This means the larger the low margin of error, the more generalized a classifier could be.
2.5. Evaluation metrics
The evaluation metrics used in the experiments are accuracy, precision, recall and F-measure. The equations respectively, where TP is the number of true positive, TN is the number of true negatives, FP is the number of false positive and FN is the number of false negatives.
a. Accuracy
Accuracy is total number of samples correctly classified to the total number of samples classified. The formula for calculating accuracy is shown in (1).
(1) b. Precision
Precision the number of samples is categorized positively classed correctly divided by total samples are classified as positive samples. The formula for calculating precision is shown in (2).
(2)
c. Recall
Recall is the number of samples is classified as positive divided by the total sample in the testing set positive category. The formula for calculating recall is shown in (3).
(3)
d. F-Measure
F-Measure. F-Measure is the weighted average of Precision and Recall. Therefore, this score takes both false positives and false negatives into account. The formula for calculating F-Measure score is shown in (4).
(4)
3. RESULTS AND DISCUSSION
The performance result for the breast cancer dataset, which by three algorithms is naïve bayes (NB), bayesian networks (BN), and tree augmented naïve bayes (TAN) has be implement by using Waikato Environment for knowledge analysis (WEKA) software. The performance result can trace the breast cancer benign or malignant is correctly or incorrectly classified. The accuracy of an algorithm can be obtained by comparing the accuracy of result related work and this using new algorithm in this research. Table 1 shows the accuracy and precision percentage for breast cancer dataset in different training and testing environment.
Table 1. Accuracy and precision for breast cancer dataset
Algorithm Accuracy (%) Precision (%) Recall (%) F-measure (%) KNN 94.992 96.943 95.483 96.207 SVM 96.852 97.161 98.017 98.591 DT(J48) 94.992 95.633 96.688 96.157 BAN 97.281 96.506 99.325 97.895 NB 95.994 95.196 98.642 96.888 TAN 96.280 95.851 98.430 97.123
The results showed that BN algorithm has the higher classification accuracy based on breast cancer dataset. BN has the highest value of accuracy, which is 97.281% while NB is only achieved 95.994% and TAN achieved 96.280%. The comparison the result of the related paper using other algorithm which is KNN only achieved 94.992%, SVM 96.852% and DT 94.992% of accuracy. This proven the BN algorithm is the best classification using breast cancer dataset.
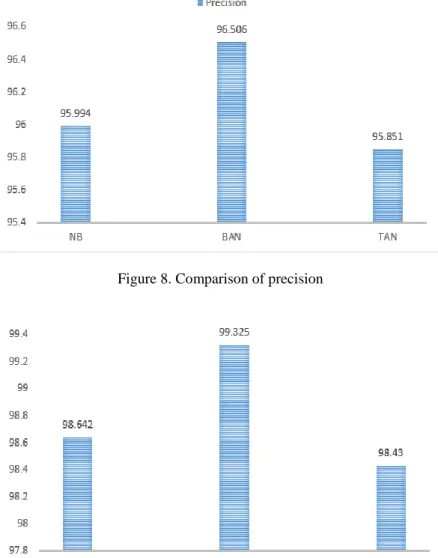
Precision is the predictive value for a class label of whether positive or negative depending on the class it is calculated for. This is essentially the predictive power of the classification algorithm. Figure 8 shows precision of BN is 96.506%, higher than NB 95.994% and TAN 95.851%.
Next, recall is the fraction of relevant instances that are retrieved. A high recall value indicates that the classification algorithm is able to return most of the relevant results. Figure 9 shows BAN is higher recall, which is 99.325% as compared to the other algorithm NB with 98.642% and TAN with 98.430%.
Figure 8. Comparison of precision
Figure 9. Comparison of recall
Finally, F-measure is a measure of accuracy that considers both the precision and the recall rate of the test and computes a composite score. A good score favors the algorithms with higher sensitivity and challenges algorithms with higher specificity. Based on the considerations, we can conclude that BN is preferable to NB and TAN. The F-measure for BAN is higher with 99.895% while NB 96.888% and TAN 97.123%. The results are shown in Figure 10.
To conclude the experiments, Table 2 shows the comparisons of the proposed Bayesian approach across all three datasets, which are breast cancer, breast cancer wisconsin, and breast tissue dataset and the result for breast cancer datasets with three classification algorithms.
Based on the table, BN algorithm has higher results than NB and TAN algorithm with the Breast Cancer and Breast Cancer Wisconsin dataset while than the second higher in the Breast Tissue dataset it because the attribute Breast tissue more to specification to tissue and that have many classes depend Breast Cancer and Breast Cancer Wisconsin have only two classes.
Figure 10. Comparison of F-measure
Table 2. Comparison across different datasets
Algorithm Naïve Bayes (NB) Bayesian Networks (BN) Tree Augmented Naïve Bayes (TAN)
Breast Cancer Wisconsin 72.028% 72.377% 67.832%
Breast Cancer 95.994% 97.281% 96.280%
Breast Tissue 70.754% 66.037% 62.264%
4. CONCLUSION
Classification is an important technique of the data mining with applications in various fields. This paper presented a comparative experiment on different techniques evaluated on the breast cancer dataset. Six classifiers were compared based on accuracy to select the best result to be used in the classification task. The best result between three algorithm chose in this paper showed Bayesian Networks (BN) classification because has the highest accuracy which is 97.281%. Next, this paper also compared the performance of Bayesian algorithms based on different datasets, which are the Breast Cancer Wisconsin and Breast Tissue dataset to prove that BN algorithm has the best accuracy as compared to NB and TAN algorithms. In the present study few issue like high dimensionality, scalability and accuracy are to be considered for further research along with other algorithms not currently available in WEKA environment.
ACKNOWLEDGEMENTS
This research is supported by Universiti Tun Hussein Onn Malaysia.
REFERENCES
[1] Malaysia Study on Cancer Survival (2018), available online http://www.moh.gov.my/resources/index/Penerbitan/Laporan/Malaysian_Study_on_Cancer_Survival_MySCan_20 18.pdf
[2] Cancer Research Malaysia, 2016, available online http://www.cancerresearch.my/our-work/cancers
[3] Fernández-Llatas, C., & García-Gómez, J. M. (Eds.), Data mining in clinical medicine, 2015, Humana Press. [4] Chen, J. H., Podchiyska, T., & Altman, R. B, "OrderRex: clinical order decision support and outcome predictions
by data-mining electronic medical records," Journal of the American Medical Informatics Association, vol. 23, no. 2, pp. 339-348, 2015.
[5] Dua, S., & Du, X., “Data mining and machine learning in cybersecurity”. Auerbach Publications, 2016.
[6] Gouda I. Salama, M. B. Abdelhalim, Magdy Abd-elghany Zeid, "Breast cancer diagnosis on three different datasets using multi-classifiers," International Journal of Computer and Information Technology, vol. 01, no. 01, pp. 36-43, 2012.
[7] Aruna, S., Rajagopalan, S. P., & Nandakishore, L. V., "An empirical comparison of supervised learning algorithms in disease detection," International Journal of Information Technology Convergence and Services–IJITCS, vol. 1, no. 4, 81-92, 2011.
[8] Bashir, S., Qamar, U., Khan, F. H., "IntelliHealth: a medical decision support application using a novel weighted multi-layer classifier ensemble framework," Journal of biomedical informatics, 59, pp. 185-200, 2016
[10] Breast Cancer, Symptoms, Diagnosis, Types, and More, 2017, available online https://www.breastcancer.org/symptoms
[11] William H. Wolberg, W. Nick Street, Olvi L. Mangasarian, "Breast Cancer Wisconsin (Diagnostic) Data Set," 2017, available online https://archive.ics.uci.edu/ml/datasets/Breast+Cancer+Wisconsin+(Diagnostic)
[12] Breast tumors (2017), available online https://www.nationalbreastcancer.org/breast-tumors
[13] Megha, R., & Arun, K. S., "Breast Cancer Prediction using Naïve Bayes Classifier," International Journal of Information Technology & Systems, vol. 1; no. 2, July-Dec. 2012.
[14] Fayyad, U., Piatetsky-Shapiro, G., & Smyth, P., "From data mining to knowledge discovery in databases" AI magazine, vol. 17, no. 3, 37-54, pp. 1996.
[15] Melamed, I. D., Green, R., & Turian, J. P., "Precision and recall of machine translation," In Companion Volume of the Proceedings of HLT-NAACL 2003-Short Papers, vol. 2, pp. 61-63, 2003.
[16] Bazila, B., & Ponniah, T., "Comparison of Bayes Classifiers for Breast Cancer Classification," Asian Pac J Cancer Prev., vol. 19, no. 10, pp. 2917–2920, 2018.
[17] Shweta, K., Shika, A., Sunita, S., "Naive Bayes Classifiers: A Probabilistic Detection Model for Breast Cancer," International Journal of Computer Applications, vol. 92, no. 10, pp. 26-31, April 2014.
[18] Diana, D., "Prediction of recurrent events in breast cancer using the Naive Bayesian classification," Annals of University of Craiova, Math. Comp. Sci. Ser, vol. 36, no. 2, pp. 92-96, 2009.
[19] Rodríguez-López V., Cruz-Barbosa R., "On the Breast Mass Diagnosis Using Bayesian Networks. MICAI 2014, Part II, LNAI 8857," Springer International Publishing Switzerland, vol 8857, pp. 474–485, 2014
[20] Khatija, A. & Shajun, N., "Breast Cancer Data Classification Using SVM and Naïve Bayes Techniques," International Journal of Innovative Research in Computer and Communication Engineering, vol. 4, no. 12, pp. 21167- 21175, 2016.
[21] Souad, D., "Mining Knowledge of the Patient Record: The Bayesian Classification to Predict and Detect Anomalies in Breast Cancer," The Electronic Journal of Knowledge Management, vol. 14, no. 3 pp128-139, 2016.
[22] Maysanjaya, I. M. D., Pradnyana, I. M. A. & Putrama, I. M., "Classification of breast cancer using Wrapper and Naïve Bayes algorithms," International Conference on Mathematics and Natural Sciences. Journal of Physics: Conf. Series 1040, 2017.
[23] Dian E. R., Nurizal D. P. & Machsus Machsus, "A Modified K-Means with Naïve Bayes (KMNB) Algorithm for Breast Cancer Classification," Journal of Telecommunication, Electronic and Computer Engineering, vol. 10, no.1-6, pp. 137-140, 2018
[24] Mitani, Y., & Hamamoto, Y., "A local mean-based nonparametric classifier," Pattern Recognition Letters, vol. 27, no. 10, pp. 1151-1159, 2006.
![Figure 1. KDD model [14]](https://thumb-us.123doks.com/thumbv2/123dok_us/341589.2537505/2.892.140.767.879.1142/figure-kdd-model.webp)

![Figure 7. Accuracy rate estimation [24]](https://thumb-us.123doks.com/thumbv2/123dok_us/341589.2537505/5.892.294.617.127.439/figure-accuracy-rate-estimation.webp)