University of Huddersfield Repository
Hao, Yu, Xu, Zhijie, Wang, Jing, Liu, Ying and Fan, Jiulun
An Effective Video Processing Pipeline for Crowd Pattern Analysis
Original Citation
Hao, Yu, Xu, Zhijie, Wang, Jing, Liu, Ying and Fan, Jiulun (2017) An Effective Video Processing
Pipeline for Crowd Pattern Analysis. Proceedings of the 23rd International Conference on
Automation & Computing, (University of Huddersfield, 78 September 2017). ISSN
9780701702601
This version is available at http://eprints.hud.ac.uk/id/eprint/33565/
The University Repository is a digital collection of the research output of the
University, available on Open Access. Copyright and Moral Rights for the items
on this site are retained by the individual author and/or other copyright owners.
Users may access full items free of charge; copies of full text items generally
can be reproduced, displayed or performed and given to third parties in any
format or medium for personal research or study, educational or notforprofit
purposes without prior permission or charge, provided:
•
The authors, title and full bibliographic details is credited in any copy;
•
A hyperlink and/or URL is included for the original metadata page; and
•
The content is not changed in any way.
For more information, including our policy and submission procedure, please
contact the Repository Team at: [email protected].
http://eprints.hud.ac.uk/
An Effective Video Processing Pipeline for Crowd
Pattern Analysis
Yu Hao
1,2, Zhijie Xu
1, Jing Wang
1, Ying Liu
2, Jiulun Fan
21
School of Computing and Engineering, University of Huddersfield, Huddersfield, UK
1{y.hao; z.xu; j.wang2}@hud.ac.uk
2
School of Telecommunication Engineering,
Xi’an University of Posts & Telecommunication, Xi’an, China2
[email protected],
2[email protected]
Abstract—With the purpose of automatic detection of crowd patterns including abrupt and abnormal changes, a novel approach for extracting motion “textures” from dynamic Spatio-Temporal Volume (STV) blocks formulated by live video streams has been proposed. This paper starts from introducing the common approach for STV construction and corresponding Spatio-Temporal Texture (STT) extraction techniques. Next the crowd motion information contained within the random STT slices are evaluated based on the information entropy theory to cull the static background and noises occupying most of the STV spaces. A preprocessing step using Gabor filtering for improving the STT sampling efficiency and motion fidelity has been devised and tested. The technique has been applied on benchmarking video databases for proof-of-concept and performance evaluation. Preliminary results have shown encouraging outcomes and promising potentials for its real-world crowd monitoring and control applications.
Keywords—crowd pattern analysis; Spatio-Temporal Volume; Spatio-Temporal Texture; Gabor filtering; information entropy
I. INTRODUCTION
Closed-circuit television (CCTV) cameras are widely installed in city centers, main roads and highways, stadiums and concert halls, shopping malls and other key installations to ensure public welfare and safety. The live video feeds are often sent to various control centers for processing and storage. If the monitored crowds exhibit unusual behavioral (motion) patterns, immediate actions could be taken to respond to the situations and to avoid or reduce potential damages and even casualties. For examples, when the population density of a crowd in a public event is rapidly increasing and reaching a threshold, necessary measures might need to be taken to avoid a stampede; or when people in a tightly packed tube station suddenly disperse and running away from a place,
accident/incident alarm needs to be triggered immediately in the control room. However the main operational mode today in many countries is still relying on human operators to constantly monitoring the live video streams from multiple sources, and often, in the form of a multi-screen monitor wall, which is a tedious job easily leads to fatigue, slow-response or even oversight, not mentioning the cost on staffing. This research has proposed a novel approach for automating the process using computer vision and pattern analysis techniques that can effectively overcome the shortcoming from the human-centered operations.
A typical pipeline of the crowd abnormality detecting system contains three processing phases [1]. In the first video data acquisition phase, the raw video signals are collected and stored in suitable digital formats; and then static or dynamic features contained within the information packets will be extracted; and at last, predefined feature patterns describing signal-, statistical-, and/or even semantic-level explanations of the “video events” will be used to evaluate the similarity and differences of the features extracted from the live feeds [2,3 and 4].
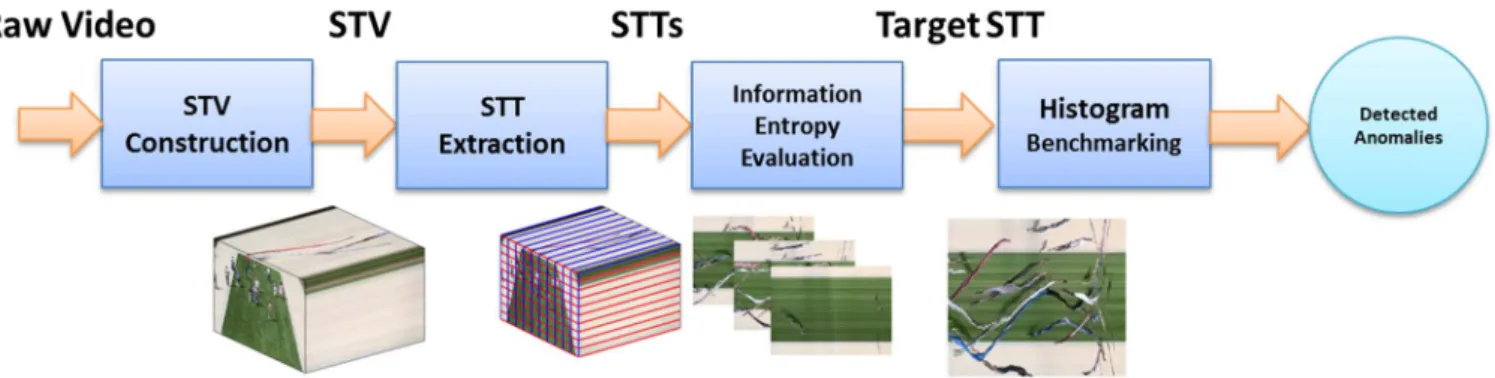
This research improves the conventional pipeline by extending it into a 4-stage one. As illustrated in Figure 1, the new method has an added processing phase after acquiring the video data. An information entropy model has been devised to help the sampling and selection of “meaningful” feature containers – in this case, the “so-called” Spatial-Temporal Texture (STT) slices - before feeding them into the feature (crowd and motion patterns) extraction module. This design ensures the STT slices that contain the most of the crowd dynamics will be selected based on the magnitude and richness of motion “trails” along time axis in the lively formulated Spatio-Temporal Volume (STV) blocks. After the features are extracted, pre-defined (or in-fly generated) video event patterns
will be evaluated using threshold or other quantitative methods. The paper is structured as follows: Section 2 introduces the construction of dynamic STV, and the method and techniques to obtain STT slices from it. An information entropy model for optimizing the STT selection is given in Section 3. In Section 4, features of the crowd behavioral patterns obtained from the chosen STT slices will be re-evaluated that leads to a Gabor filtering process been introduced to the proposed pipeline. Section 5 provides details of the benchmarking experiments and performance evaluation of the proposed model that is concluded in Section 6.
II. SPATIO-TEMPORALVOLUME AND TEXTURE
In this research, the live video signal is first digitized and stored as continuous and evolving 3-dimensional (3D) STV blocks. The construction of a typical STV block from video can be described as the stacking up of consecutive (doesn’t have to be) video frames to a fixed length (normally a few seconds) time capsule that is consisted of evenly spread grey-scale (for black-and-white video) or colored (for color video) points over the 3D space enclosed by the borders of the frame and the length (decided by the STV length in seconds and the video frame rate) along the time axis. Actually those points are 2D pixels of each frame turned into 3D voxels (volumetric-pixels) filling up the STV block. Comparing to 2D frames, a STV block naturally encapsulate dynamic information, such as lighting change, motion information, such as object movements, as well as static scene information in its structure. 2D frame-based tracking techniques such as the optical flow [6] study the consecutive frame pairs for smooth object motions that works well for human and vehicle tracking but has major draw-backs when applied to evaluate sudden changes especially concerning a large group of fast moving objects such as high density crowd movements.
STV and its related techniques have been widely studied in the last two decades. Bolles [7] used STV for geometric recovery from static scene structure; Baker [8] and Kühne [9] used STV for 3D scene segmentation. One important way of utilizing STV is by extracting the temporal slice, STT, from the volume. Ngo [10] used STT techniques for the detection of camera cuts, wipes and dissolves in a video sequence. In his approach, the STT were analyzed by first convolving with the first derivative Gaussian, and then processed using Gabor decomposition, in which the real components of multiple spatial-frequency channel envelopes were retrieved to form the texture feature vector. A Markov energy-based image segmentation algorithm was then used to locate the color and texture discontinuities at region boundaries. The approach was applied on multiple types of videos, including news and movies. The result showed a good performance on cut detection with accuracy of 95%, but only 64% for wipe detection. Niyogi [11] used STT to analyze human walking gaits. In his research, the key patterns of gaits were firstly detected as various braded patterns, and then the rough estimate of the walker’s pattern was refined using Snakes proposed by Kass [12]. Then the walker’s body was modeled by merging the Snake contours into one. At last the general contour was classified using predefined gait signatures.
Because the way a STV block is constructed and the randomness nature of real-life events, the “useful” information distributed over the STV space is uneven and irregular. Thus one important problem is how to obtain the STT slices from a STV block with the highest information density. Core to the challenge is how to differentiate useful information such as voxels formed by crowd movement from noise such as static background. In this research, instead of an even cut and computation on all STT slices from a STV block for studying crowd dynamics, an optimization technique has been devised to address the above issue.
III. INFORMATIONENTROPY-BASEDSTT SELECTION
As shown in Figure 1, several horizontal and vertical cuts are applied to a STV block for obtaining STTs. The vertical cuts are highlighted in blue lines and the horizontal cuts are highlighted in red lines. All of the cuts are along the time axis. The sampling density of the cuts is customizable and depending on actual application scenarios. When the density is set to a higher value, it can be predicted that the result would be closer to optimal, yet the computational burden could be extended. In the third step of Figure 1, once the STTs are obtained, the information entropy is calculated for each STT. The slice with the highest information entropy will be selected as the target STT for crowd behavior analysis as shown in the last step of Figure 1.
Information entropy is also called Shannon entropy, which is proposed by Claude Shannon. It is a concept from information theory that tells how much information there is in an event. The information gain is a measure of the probability with which a certain result is expected to happen [13]. Shuang [14] proposed an approach to detect encoded malicious web pages based on information entropy. Zhang [15] used Information Entropy to detect mobile payment anomaly. The idea of Information Entropy could also be used as an index to measure the informational value of the extracted STTs. There are several other features could be used to select desired STT, such as Contrast, Angular Second Moment and Energy derived from Gray Level Co-occurrence Matrix [21] or Linear Binary Patterns. In the research of crowd abnormal behavior detection, the situation concerned most is events with irregular patterns such as panic or stampede, Comparing to other features, information entropy is good at describing how irregular one system is. If a STT has higher entropy, it is likely to contain higher motion and scene information. The information entropy can be expressed as the following equation.
( ) = − ( ) ( )
In which represents the total number of different gray scale levels in a STT. represents the amount of pixels of the gray scale level in it. ( ) represents the probability of gray scale level in the STT. ( ) is the calculated information entropy.
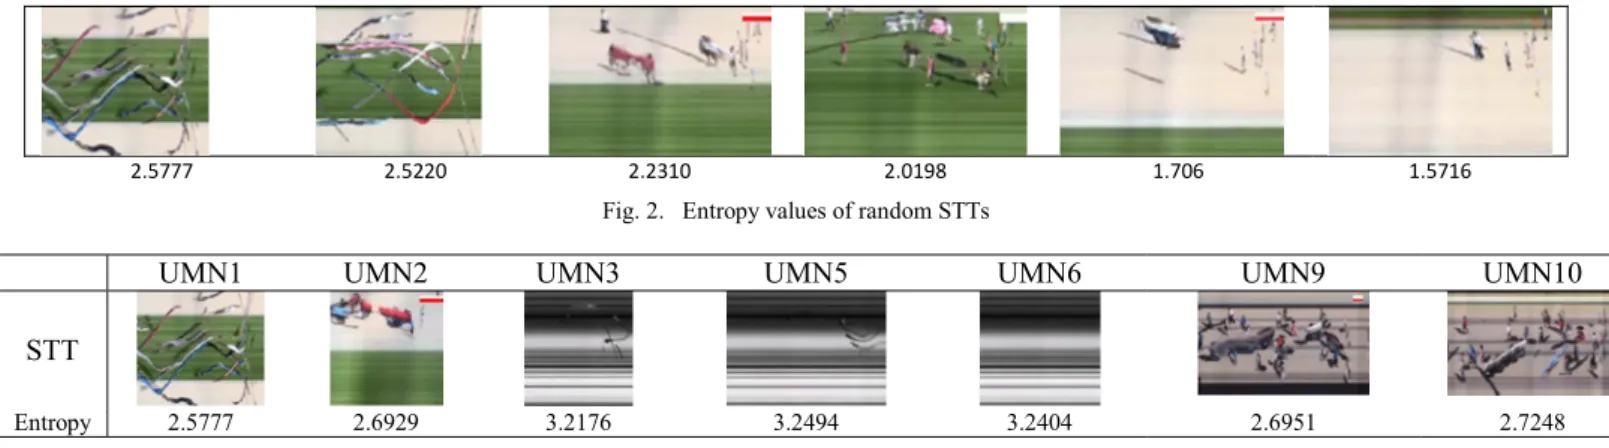
Figure 2 shows the calculated information entropy values of a group of extracted STTs from a single STV. The STTs are displayed in descending order of calculated entropies. It can be
observed that STT with higher information entropy shows
abundant motion information as indicated by the ribbon-shape trajectories.
UMN1 UMN2 UMN3 UMN5 UMN6 UMN9 UMN10
STT
Entropy 2.5777 2.6929 3.2176 3.2494 3.2404 2.6951 2.7248 Fig. 3. Results of Selected Target STTs’ Information Entropy values
However, when directly applied to a test video database as shown in Figure 3, the immediate results do not seem yielding consistent and satisfactory outcome against intuition, where UMN3, 5, and 6 even showing higher entropy values yet contain less motion features than 1 and 2.
IV. OPTIMIZATIONTHROUGHGABORFILTERING In the previous section, the information entropy is calculated on all extracted STTs, the STT with largest entropy would be selected as target for further pattern analysis. However, preliminary tests have shown unsatisfactory pairing between STT slices with high entropy values from the ones actually containing more crowd motion “ribbons”. Close inspection reveals the main cause for the problem is due to the traces left on STTs caused by non-moving objects and background regions, especially those with high color contrast. For example, the obtained sample STTs from UMN3 to UMN8 clips have shown explicit parallel stripes caused by the background. To address this issue, in this research, the Gabor wavelet filtering is exploited for removing the STT background. Figure 4 shows the renovated processes. Instead of applying information entropy calculation directly on the extracted STTs, they are firstly converted into gray scale images. Then the background of STTs are removed through implementing the convolutions of the STTs with the Gabor filter before the entropy measures are calculated as marked in the brown box in Figure 4.
Fig. 4. Updated structure of the proposed technique
The Gabor transform is a special case of the short-time Fourier transform. Because the Gabor wavelet is very similar to a single cell’s response to visual stimulus from human visual system, it is sensitive to the border in an image, but not so much so to the change of light, which made it ideal in many application areas in image processing and computer vision Deepak [16] introduced a hierarchical algorithm for both
block-based and pixel-based background subtraction approaches. Based on the Gabor transformed magnitude feature. Zhou [17] extracted features using circular Gabor filters at five different frequencies, to solve the challenge that conventional background subtraction algorithms struggle to achieve.
In the spatial domain, a two dimensional Gabor filter is the product of a sinusoidal function and a Gaussian function, it is also called the window function. In practice, Gabor filter can extract features from multiple scales and orientations. For this research, it is expressed as the following equation.
( , , , ) = exp −1
2 ∗ cos(2 )
In which and are the window sizes along and axis, and the value of varies from negative to positive , the value of varies from negative to positive . defines the orientation of the extraction process. defines the frequency of the sinusoidal function. And
= cos sin
= cos − sin
The convolution of the Gabor filter and an original STT is then applied to obtain the filtered version.
In real-life scenario, the motion of crowd recorded in a STV block could be towards any directions, thus the Gabor filtering is applied in eight directions (like the notions of N, S, E, W, NE, SE, NW and SW on a map) to increase the accuracy. Figure 5 shows the detailed steps of the procedure. The first and second row illustrates the filtered STTs in eight orientations respectively. Note that the parameters of Gabor filter are adjusted accordingly. In this case, value of and are set to 2, and is set to 4.99 on Figure 5(a-d) and 3.9 on Figure 5(e-h). Once the filtering steps are completed, all 8 filtered STTs are accumulated together to formulate a combined one as shown as Figure 5(i), where 5(j) is the original STT.
2.5777 2.5220 2.2310 2.0198 1.706 1.5716
(a) /2 (b) − /2 (c) 0 (d)
(e) /4 (f) −3 /4 (g) 3 /4 (h) − /4
(i) Combination of Transformed STTs
(j) Original STT
Fig. 5. Result of Gabor filtering on STT
Comparing to the pre-filtered results in terms of information entropy values, some of the issues caused STT image noise have been reduced (namely UMN clip 1, 2, 9 and 10). However, the clips No.3, 5, and 6 do not witnessing any improvement (if not getting worse in some occasions) as shown in Figure 7. The reason for that is in STT, static background pixels will be stretched into parallel and horizontal stripes which carries little meaningful information,
hence very high entropy value according to the information theory. As in Figure 6, assuming the STT is extracted along the marked black line, since the pixels won’t change at all during the entire video. Coincidentally the pixels along black line have neighbors with drastically changed gray scale values, which results the STT with vivid stripes.
To address this issue, the Gabor filtering at orientation 0 and π are removed from the proposed algorithm. Since usually the background with high contrast stripes contributes most of entropy along these two directions. Figure 7 compares the 8-direction and 6-8-direction Gabor transform results for selecting target STTs for crowd pattern analysis.
Fig. 6. Pixel relations of a frame and extracted STT with stripes. The black line marked pixels used to generate STT, the red line connected the
corresponded pixels
UMN1 UMN2 UMN3 UMN5 UMN6 UMN9 UMN10
Eight-Orien Gabor preprocessing Six-Orien Gabor preprocessing
Fig. 7. Gabor optimization for STT selection
V. ABNORMAL CROWD PATTERN DETECTION
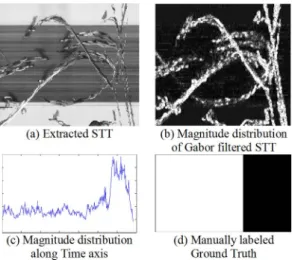
After acquiring and filtering the STTs, the gray scale values of the extracted STT along time axis are accumulated to build a statistical histogram shown in Figure 8(c). The manually labeled ground truth along time axis is marked as a black-white color bar as in Figure 8(d). The white bar of Ground Truth indicates the crowd is in a normal state, and the black bar indicates the crowd has a sudden motion change in Ground Truth. It can be observed when a crowd is at panic state, the accumulated magnitude exhibits a significant surge. This surge can be used to measure whether the crowd is at an abnormal state. When the ribbon-shaped motion texture becomes denser and more irregular, the corresponding magnitude in the statistical histogram will increase more rapidly.
TABLE 1. PSEUDO CODE OF PROPOSED ALGORITHM
% Extracted gray scale STT slices
STT;
% Gray scale values are accumulated along columns
H = Sum(STT);
% Average of first several frames are calculated
Ave = Average(H(1:training_length));
% For the rest of frames
for i = training_length+1 to last_frame
% If the difference is larger than certain threshold
if H(i)-Ave > Threshold % Consider Abnormal Abnormal % Otherwise Else % Consider Normal Normal end
(a) Extracted STT (b) Magnitude distribution of Gabor filtered STT
(c) Magnitude distribution along Time axis
(d) Manually labeled Ground Truth
Fig. 8. Comparison between the Magnitude Distribution along time axis of the target STT and Ground Truth
Based on the preliminary study [1], the algorithm used for crowd behavior analysis can be simplified as follows: at the training (current-state template building) stage, the average value of the first group of frames is calculated, and this value is then used to define the Initial state. Once an empirical threshold value is defined (subjecting to application scenarios such as indoor/outdoor, crowd density, and dynamic state), if the difference between a consecutive pair of STT slices exceeds the threshold then it can be presumed a crowd behavioral pattern change has occurred. In this research, the Gray scale value is used to measure the motion magnitude. Yet various types of features modeled from target STT could
also be used as a signature for the measurement. For example in previous research, Gray Level Co-occurrence Matrix (GLCM) [19] of extracted STT is firstly calculated, then patterns such as Contrast, Angular Second Moment, Entropy and Variance of GLCM are used for Detection. The proposed algorithm is explained as pseudo code in Table 1.
VI. TEST AND EVALUATION
The UMN dataset is a video collection of crowd behaviors[18]. The video collections are recorded in different indoor and outdoor settings, including lawns, hallways and plaza. All of these videos contain some normal states followed by panic events. The proposed algorithm has been implemented and tested on all eleven clips from UMN. In the experiment, the number of training frames has been set at 100 and will gradually update along the time axis as time elapses. The threshold is set to a fixed value of 50 in the experiment.
The experimental results are shown in Figure 9. The STT slices on the first row show the sampled STTs from each clip. The gray scale images on second row show the Gabor transformed STTs. The figures on third row show the trends of accumulated magnitude histogram along the timeline. The color bars at the bottom row illustrate the crowd pattern alteration results. The gray bar indicates the training stage of first one hundred frames, the borders formed by the alteration of the black and white bars indicates the crowd behavior changes. It turns out that almost all panic events (all ground truth in the video has been manually labeled before the test) in the eleven tested videos have been successfully detected.
UMN1 UMN2 UMN3 UMN4 UMN5 UMN6
Target STT
Gabor magnitude map
Histogram along time axis Detection result
UMN7 UMN8 UMN9 UMN10 UMN11
Target STT
Gabor magnitude map
Histogram along time axis Detection result
VII. CONCLUSIONS
This paper has proposed a novel approach of extracting texture features from STVs and STTs for crowd behavior pattern analysis. The process pipeline first extracts STTs from the built STVs. Then the STTs are filtered by a 6-direction Gabor transformation before the background and noise being culled by information entropy assessment. Next the motion magnitude values from multiple STTs are accumulated along time axis for detecting the abrupt alterations of crowd behavioral patterns. Series of experiments have been carried out using the UMN dataset to test the performance of the proposed algorithm. The overall results are encouraging with some minor issues to resolve. Future work will target at further improving the detection accuracy through adaptive thresholding. Feature signatures of the ribbon-like motion textures will be refined based on the earlier work [20] to reveal the true natures and severity of the crowd events.
ACKNOWLEDGEMENT
This research is supported by Shenzhen science and Technology plan project (No.GJHZ20160301164521358), by Science and Technology Department of Shaanxi Province (No.2016GY-123) and by National Science Foundation of China (No.61671377).
REFERENCES
[1] Yu Hao; Zhijie Xu; Jing Wang; Ying Liu; Jiulun Fan, “An approach to detect crowd panic behavior using flow-based feature”, 2016 22nd International Conference on Automation and Computing (ICAC), Pages: 462 - 466, DOI: 10.1109/IConAC.2016.7604963
[2] Jinhai Xiang; Heng Fan; Jun Xu, “Abnormal behavior detection based on spatial-temporal features”, 2013 International Conference on Machine Learning and Cybernetics, Pages: 871 - 876, DOI: 10.1109/ICMLC.2013.6890406
[3] Hiba H. Alqaysi; Sreela Sasi, “Detection of Abnormal behavior in Dynamic Crowded Gatherings”, 2013 IEEE Applied Imagery Pattern Recognition Workshop (AIPR), Pages: 1 - 6, DOI: 10.1109/AIPR.2013.6749309
[4] Ce Li; Zhenjun Han; Qixiang Ye; Jianbin Jiao, “Abnormal Behavior Detection via Sparse Reconstruction Analysis of Trajectory”, Pages: 807 - 810, DOI: 10.1109/ICIG.2011.104 [5] Aldelson, E., and Bergen, J.R., “Spatiotemporal energy models
for the perception of motion”, Journal Optical Society of America, vol. 2, 284-299, 1985
[6]. Yumi Iwashita; Maria Petrou, “Person identification from spatio-temporal volumes”, 2008 23rd International Conference Image and Vision Computing New Zealand, Pages: 1 - 6, DOI: 10.1109/ IVCNZ.2008.4762086
[7]. Bolles, R.C., Baker, H.H., Marimont, D.H., “Epipolar-plane image analysis: an approach to determining structure from motion”, International Journal on Computer Vision, 1, 7-55, 1987
[8] Baker, H.H, Bolles, R. C., “Generalizing epipolar plane image analysis on the spatio-temporal surface”, n Proceedings of the DARPA Image Understanding Workshop, 33-49, 1988
[9] Kühne, G., Richter, S., Beier, M., “Motion-based segmentation and contour based classification of video objects”, in Proceedings of the ninth ACM international conference on Multimedia, pp 41-50, 2001
[10] Ngo, C.W., Pong, T.C., Chin, R.T., “Detection of gradual transitions through temporal slice analysis”, in Proceedings of International Conference of Computer Vision and Pattern Recognition, 1999
[11] Niyogi, S., Adelson, E., “analyzing and recognizing walking figures in XYT”, in Proceedings of IEEE International Conference of Computer Vision and Pattern Recognition, pp 469-474, 1994
[12] Kass, M., Witkin, A., Terzopoulon, D., “Snakes: Active contour models ”,International Journal of Computer Vision, pp 321-331, 1987
[13] Shannon, Claude E. "A Mathematical Theory of Communication". Bell System Technical Journal. 27 (3): 379– 423. doi:10.1002/j.1538-7305.1948.tb01338.x
[14] Shuang Liang; Yong Ma; Yanyu Huang; Jia Guo; Chunfu Jia, “The Scheme of Detecting Encoded Malicious Web Pages Based on Information Entropy”, 2016 10th International Conference on Innovative Mobile and Internet Services in Ubiquitous Computing (IMIS), Pages: 310 - 312, DOI: 10.1109/IMIS.2016.82
[15] Zhenjiang Zhang; Xiaoni Wang; Lin Sun, “Mobile payment anomaly detection mechanism based on information entropy”, IET Networks, Year: 2016, Volume: 5, Issue: 1Pages: 1 - 7, DOI: 10.1049/iet-net.2014.0101
[16] Deepak Kumar Panda, and Sukadev Meher, “Hierarchical Background Subtraction Algorithm Using Gabor Filter”, 2015 IEEE International Conference on Electronics, Computing and Communication Technologies, CONECCT 2015
[17] Dongxiang Zhou, Hong Zhang, and Nilanjan Ray, “Texture Based Background Subtraction”, 2008 IEEE International Conference on Information and Automation, June 20 -23, 2008 [18] UMN Crowd Dataset. [Online]. Available: http://
mha.cs.umn.edu/proj_events.shtml#crowd
[19] Robert M Haralick, K Shanmugam, and Its'hak Dinstein. “Textural Features for Image Classification”. IEEE Transactions on Systems, Man, and Cybernetics. SMC-3 (6): 610–621,1973 [20] Yu Hao, Jing Wang, Ying Liu, Zhijie Xu. “Extracting
Spatio-Temporal Texture Signatures For Crowd Abnormality Detection”, 2017 23nd International Conference on Automation and Computing (ICAC)
[21]“The GLCM Tutorial”, http://www.fp.ucalgary.ca/mhallbey/ tutorial.htm