Medical Progress and Supplementary Private Health
Insurance
by Reiner Leidl1
In many welfare states, tightening financial constraints suggest excluding some medical services, including new ones, from social security coverage. This may create opportunities for private health insurance. This study analyses the performance of supplementary private health insurance (SPHI) in markets for excluded services in terms of population covered, risk selection and insurer profits. Using a utility-based simulation model, the insurance market is described as a composite of sub-markets. The latter are defined by the key parameters of risk, risk aversion and information levels on the insurer and on the consumer side. Numbers of contracts, revenue, adverse selection, cream-skimming, and profits indicate market performance. The impact of key parameters as well as that of scenarios describing risk and information changes linked with exclusion strategies are analysed. Especially when information levels are low, insurer information must be at least as good as that of the consumer in order to avoid significant losses by adverse selection. Cream-skimming varies by information and risk aversion. Insurer profits increase with the degree of risk dispersion and the market share of low risks. Scenario analyses show that profits may be highly sensitive to changes in key parameters, especially to those affecting cream-skimming. The simulation model explains performance in a wide range of market types and allows the impact of interventions such as marketing campaigns to be analysed. Profit-oriented insurers should aim to empirically understand the key parameters in the SPHI-markets in which they wish to operate. Policymakers in social health insurance who develop exclusion strategies should consider the potential performance of private markets if they intend to rely on supplementary coverage.
1. Introduction
In the forthcoming decades, the social security systems in a number of countries will face tremendous challenges, including in the health sector. Ageing societies will severely undermine the financial basis of social security, as both tax-financed national health services and pay-as-you-go financed social security systems suffer from the reduction of the labour force. At the edge of a new age of medicine driven by the understanding and use of genetic information, biomedical research continues to create new options of diagnosis, treatment, and care. Up to now, new medical technologies extend the need for resources rather than cut costs. Continuing medical progress thus leads to increasing claims for more healthcare resources. Obviously, this reinforces financing problems. As a result of increasing pressures on the
1 Department of Health Economics, University of Ulm, Germany. This paper was prepared for the 1stGeneva
Association Health and Ageing Conference, ‘‘How Medical Progress Drives Society and Insurance’’, 21–22 November 2002, Berlin. The author is grateful to Dr Christophe Courbage, International Association for the Study of Insurance Economics, Geneva, and Dipl.-Volksw. Bernd Schweikert, Department of Health Economics, Ulm, for their helpful comments on earlier versions of this paper.
financial viability of social security systems, new forms of organizing and controlling healthcare financing are beginning to develop.
Following earlier planning approaches and ways of organizing the financing of care, an intermediate level of control has attracted significant interest in recent years (Table 1, (1)(b) and (2)). The main focus of this movement is to base healthcare decisions on scientific evidence. On the side of medical effectiveness, this already has for some decades determined market access in the field of drugs. It has also gained significant relevance in other fields of medicine during the last decade. This has been combined with the fact that there is a resource side to health and medical care, resulting in the claim that technologies also have to fulfil cost-effectiveness criteria.
Decisions concerning this intermediate level include those on the coverage of a service by the social security system. Increasing financial pressures may require a reduction in the package of services covered by social security. Criteria of medical effectiveness and cost effectiveness may make these decisions more rational. The way social security coverage is reduced may, however, not necessarily meet the actual preferences and the financial abilities of the socially insured individuals. This opens discussion for supplementary private health insurance (SPHI). In the context of the future developments described above, this type of insurance is likely to increase in relevance to a great extent in the coming years.
There is quite an amount of research into various aspects of the general functioning and performance of insurance markets. Yet specific issues in SPHI markets have long been disregarded and, given the imminent future challenges of health systems, are just beginning to be investigated. Three tracks of work are briefly sketched: today’s relevance of SPHI, the welfare impact, and issues in consumer information. Two comprehensive review studies underline a significant role of SPHI in current American and European healthcare systems. For the U.S., Atherly (2001) reports that the single largest expense in out-of-pocket payments paid by Medicare beneficiaries was private insurance premiums, and concluded that the supplements to Medicare make up an important form of protection from financial risk. In a survey of different types of private health insurance the European Union, Mossialos and Thomson (2002) report that social security is complemented by insuring co-payments in six countries, and by insuring excluded packages such as dental care or medical aids in seven countries.
Two other recent studies have investigated the welfare effects of private insurance supplementing compulsory health insurance. Hansen and Keiding (2002) find that in welfare terms, a compulsory scheme supplemented by private insurance outperforms the compulsory
Table 1:
Control in the diffusion of medical technologies, social security sector
Focus of decision Instruments used
(1) Market access (a) Need-based planning determining supply (2) Coverage
(b) Standards for safety, quality effectiveness Standards for cost-effectiveness
scheme alone. Kifmann (2002), however, finds that welfare effects will depend on whether supplementary contracts are offered by private insurers, which may incur welfare losses for high risks, or whether they are offered together with compulsory insurance, which may turn the welfare impact positive. Danzon (2002) explains that the diverging results of these two studies derive from differing assumptions and points out that the welfare impacts critically depend on who actually buys SPHI, but also how this eventually affects the rating of basic coverage.
Another track of work is devoted to consumer information on health insurance in general or, more specifically, on insurance plans. Atherly (2001) finds a string of evidence that Medicare beneficiaries in part have significant problems in understanding basic insurance terms and issues. This might severely impede the rational choice of supplementary insurance. Concerning basic health insurance, the problems of information on plans and their implications have led to work on instruments to improve consumer decision-making such as the report card, a device explaining plan benefits and treatments to the consumer (Wedig and Tai-Seale, 2002). Additional tools might also be required for SPHI markets. Yet, alongside the information needed for the choice of a plan, another key issue is the information available on individual risk when a decision on insurance has to be made. For SPHI, this issue remains to be further explored.
The reviewed research does not specifically focus on the issue of technological progress in the context of exclusion from compulsory insurance. In addition, issues in the performance of SPHI markets have not been studied comprehensively in terms of population covered, adverse selection, cream-skimming and insurer profits. These aspects make up the focus of this paper. It will analyse the functioning of SPHI markets with specific emphasis on new medical services that are not compulsorily covered. Insurance market models often assume just two risk groups (high and low) and do not quantify information on risk. Using a modelling approach, this paper investigates issues in risk selection in a wider range of risk group characteristics, including the explicit modelling of information levels on risk both on the insurer and on the consumer side.
To introduce the analytical approach, strategies by which social security excludes services are looked at, as these strategies determine what is left for SPHI. Then indicators are defined according to which market functioning is to be analysed, and a simulation model is presented which allows market functioning to be analysed. The model is used to show the influence of major determinants in SPHI markets and to analyse the impact of five scenarios on key performance measures of the supplementary market. A discussion section concludes the paper.
2. Exclusion of services
The expansion of the SPHI market will be determined by the strategies to exclude services from the social insurance package. Three strategies provide the basis for impact analysis in this paper:
• Strategy 1 excludes comprehensive service packages for which the full responsibility of socially insured individuals – or consumers, as this group will be called – has been recognised to be politically acceptable. An example of such an exclusion would be dental care. Medical progress does not play an explicit role at the point of exclusion in this scenario.
cost-effectiveness criteria. This could happen in a systematic way in cases where all new interventions are investigated in order to maximize the future health of the population, given a health budget. It could also happen in a less systematic way when a political decision is taken to investigate specific technologies in order to make a decision based on cost-effectiveness (over and above other criteria).
• In strategy 3, specific, selected services would be excluded from the package of social cover that do not imply the loss of acute care, which may even be cost-effective, but the coverage of which may exceed the existing financial constraints. An example of this would be costly preventive technologies which have to be taken over a long term, for example, a broadly defined use of statin drugs in the prevention of cardiovascular disease. The next step is to identify the transmission mechanisms that will link the characteristics of the excluded services with the results of the SPHI markets. As compared with the average risk of full health insurance, exclusion is considered to influence three key variables in the SPHI market for these excluded services. The first one is risk, which is defined as the expected cost (product of the probability of disease occurrence and the cost of disease insured) given full information. For specific excluded services, risk may deviate from the average risk of full insurance coverage. Furthermore, information levels on specific risks may differ from that on average risk. This may apply both to the side demanding the insurance contract (consumer information) and to the insurers offering contracts (insurer information).
Table 2 gives an example of impact hypotheses for the three transmission mechanisms for each of the three exclusion strategies. As an example for strategy 1, excluded dental care might feature the unchanged baseline risk of this sector, with technology and other cost determinants remaining constant. In contrast, private financing alone would increase risk in some health systems where higher fees are applied for private patients. But for the relevance of preventive activities in keeping up dental health, the consumer’s knowledge about their own behaviour might lead to a better level of information on expected need of services than the level of information available for insurers.
It may be more difficult to assess information impacts of strategy 2 when non-cost-effective interventions are excluded. Yet it can be expected that risk will increase as compared with the package insured before: rational social health insurance schemes will not exclude cost-saving and cost-neutral progress. As technologies with negative impact on effects will
Table 2:
Exclusion strategy and examples for impact hypotheses
Influence on private market by change in
Exclusion strategy
Consumer information
Insurer
information Risk
(1) Comprehensive service packages + +/ 0
(2) Non-cost-effective interventions +/ +/ +
also not be offered in rational SPHI, this leaves cost-increasing new technologies for the latter. There may even be a potential for a relatively better information level of consumers. This may derive from the less complex decision of whether or not to insure for specified services as compared with a decision that is taken on a fully comprehensive insurance package.
Similar arguments apply to strategy 3. Costly long-term prevention may imply increases in risk as well as, again for the more narrow specification of risk, in information levels. In sum, Table 2 provides some examples, but does not discuss others such as a more significant increase in information levels on the insurer side as compared with the consumer one. In order to understand the potential impact of the various exclusion strategies on SPHI, quite a broad range of developments in the key determinants of insurance markets have to be investigated. This requires a definition of performance indicators and of a method to derive the impacts. 3. Impact on supplementary insurance
In order to assess the functioning of the insurance market, performance indicators are used. Two preliminary constraints need to be mentioned: this paper only considers one insurer on the provider side and does not investigate the impact of competition between several insurers. Furthermore, only full insurance contracts are considered, thus excluding cost-sharing issues from the analysis. In this market, six performance indicators are considered:
• The first two indicators comprise the number of contracts made with the individuals in the market, and the revenue for the insurer from these contracts. In analysis, these two indicators can best be compared with the same indicators in a reference or baseline case.
• The remaining four indicators can be looked at in absolute terms or as percentages of the revenue figure for the total market: adverse selection of high risks which in a dynamic perspective could even lead to a break-down of this insurance market; cream-skimming of low risks by the insurer where the premium exceeds the actual risk, which is perceived by the insurer and contributes to insurer profit; insurer profits which, for each contract, are defined as the difference between revenue and actual cost – this is a key performance indicator, as it will determine the viability of supply in this market, for example, for shareholders; finally, market profitability which as a residual describes the economic attractiveness of the contracts once insurer profits are cleared from the effects of adverse selection and cream-skimming.
With the exception of the number of contracts, all indicators in their absolute form are expressed in monetary units.
4. The simulation model
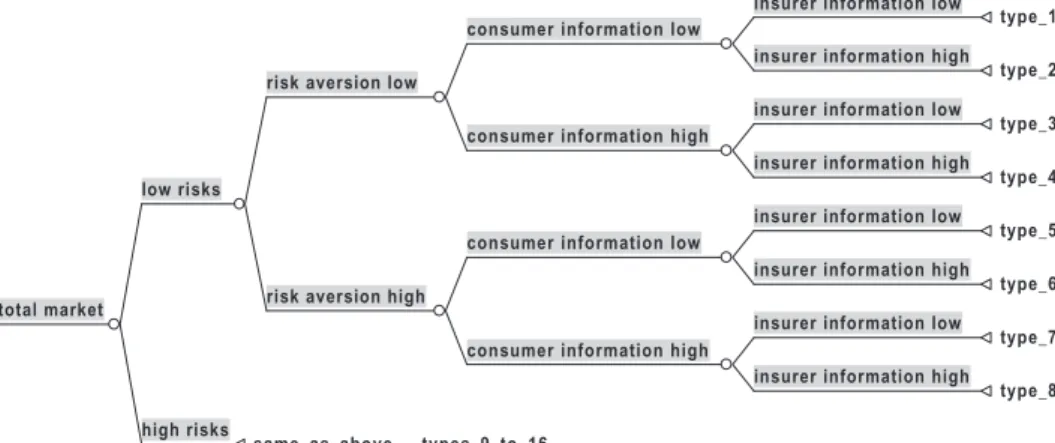
In order to investigate market functioning, a simple static model is used. It consists of two basic elements, the composition of the market by risk types and the functioning of the market for each of these risk types, which is called a sub-market. Risk types differ by the level of risk, the level of risk aversion, the level of consumer information and the level of insurer information. Assigning the two levels of ‘‘low’’ and ‘‘high’’ to each of these attributes gives a total of 16 different risk types (Figure 1). In the baseline total market, each case is considered for each risk type. The aggregation over all cases gives total market results. Accordingly, the total market in a baseline case includes eight low-risk cases and eight high-risk cases, resulting in a mean market risk of just the mean between low and high risk.
As a starting point, expected costs are described both for consumers and insurers. Accounting for their available information levels, expected costs are composed of the level of correct information that is available on actual risk and of mean risk otherwise (Equation 1).
Insurers offer a contract for all risks either at a supply price (that is, the premium for which a contract is offered by the insurer) of mean risk or, in case they expect higher cost, at their level of expected cost (Equation 2). This type of behaviour reflects an actuarial fair calculation referring to the total market given a lack of information about the risk of applicants. At the same time, insurers are assumed to avoid losses where they already expect them; they do so by separating contracts for known high risks and adjusting the supply price according to their level of information. The difference between actual risk and supply price gives the excess costs for insurers (Equation 3). In order to describe demand, the risk premium has to be calculated. By definition, individuals are prepared to pay up to this risk premium in addition to the actuarial fair premium, given that in full insurance contracts they can be sure to keep their income once the supply price is subtracted. For this calculation, a simple utility function has been employed. With some additional assumptions the risk premium can be calculated in terms of the model variables (see annex). An insurance contract is demanded if the cost expected by the consumer plus the risk premium exceed the supply price (Equa-tion 4).
The product of supply price and demand is the revenue (Equation 5). Insurer profit results from the negative excess costs in those sub-markets where the contract offered is actually demanded (Equation 6). Adverse selection is defined as occurring when consumers expect a cost higher than supply price, actually feature a higher risk, and exert demand. As an indicator, it is the loss in this sub-market (Equation 7). Adverse selection will only occur for high risks of course. In contrast, cream-skimming will only occur for low risks. As an indicator, cream-skimming is the profit in the respective sub-market. It occurs when the insurer expects a cost lower than the mean risk, the risk is indeed lower, and a contract is made – with mean risk as the minimum supply price (Equation 8). Equation 9 defines market profitability as a residual after correcting profits for adverse selection and cream-skimming. All model parts have been implemented in MS-EXCEL 2000.
insurer information low type_1 insurer information high
type_2 consumer information low
insurer information low type_3 insurer information high
type_4 consumer information high
risk aversion low
insurer information low type_5 insurer information high
type_6 consumer information low
insurer information low type_7 insurer information high
type_8 consumer information high
risk aversion high low risks
high risks
same_as_above___types_9_to_16 total market
Figure 1: Sixteen sub-markets specified by risk, risk attitude, consumer and insurer information
5. Impact of key determinants
The information levels both on the consumer and on the insurer side may play an important role in the model of the SPHI market. As information is not necessarily restricted to either full information or to no information, the model allows an information plane to be drawn up. This plane describes all possible combinations of consumer and insurer information between the two extremes. The impacts of the information levels of the two market sides on adverse selection and on cream-skimming are described in the following. Calculations are performed on the basis of the above sub-market model, assuming a risk of 0.2 for the low risks, 0.8 for the high ones, and a high degree of risk aversion of 0.9 for all individuals.
A sub-market analysis of high risks reveals that adverse selection requires consumer information to exceed insurer information if it is to occur (Figure 2). The extent to which adverse selection emerges is negatively correlated with the absolute level of insurer information. This is a consequence of separating contracts for high risks, as insurers will increase supply price beyond mean risk for those applicants depending on their information available.
When cream-skimming occurs, its extent does not vary with information levels, as insurers are assumed not to offer a supply price lower than mean risk. As the risk premium
Table 3:
Sub-market model for a given type of risk specification Supply and demand
Cost expectations of consumers and insurers
(1) expected cost¼information level . risk + (1information level) . mean risk Supply price and excess costs of insurer
(2) supply price¼max (expected costinsurer, mean risk)
(3) excess costs¼risksupply price Demand
Assuming a utility function ofU¼Y(1risk aversion)renders a risk premium of 1expected costconsumer(1expected costconsumer)1=(1risk aversion)
(4) demand¼1 if expected costconsumer+ risk premium>supply price
0 otherwise Market results
(5) revenue¼supply price . demand
(6) insurer profit¼demand . (excess costs)
(7) adverse selection¼(excess costs) . demand if expected costconsumer.supply price
and risk.supply price 0 otherwise
(8) cream-skimming¼ (excess costs) . demand if expected costinsurer,mean risk and risk,mean risk
0 otherwise
allows supply price to exceed the cost expected by consumers and contracts to be made, cream-skimming may also occur for low risks which are endowed with a significant level of information but which are not fully sure of their risk status. The point where cream-skimming is stopped in the market is determined by the risk attitude of consumers. This can be described by using the above assumptions but with a degree of risk aversion of only 0.5 and focusing on the sub-market of low risks (Figure 3). In contrast, individuals risk averse to a degree of 0.9 would have to be sure about their risk status in order not to be cream-skimmed when contracting.
The last category of impact determinants refers to the market outcome of insurer profits. For this calculation, risk levels of 0.2 were taken on the side of low risks, and 0.4/0.6 /0.8 on the side of high risks. For half of the risk types in this fully aggregated market, risk aversion was set low at 0.5 and for the other half high at 0.9. A 50 per cent level of information was used for all market participants. Figure 4 shows that other things being equal, insurer profits are positively correlated with the degree of dispersion in risk between the two risk types. In the simulation, the degree of risk dispersion varies from high risks featuring twice the costs of low risks up to doing so fourfold. The correlation is positive because larger dispersion of risk enables greater profits by cream-skimming. In addition, the higher the market share of low risks, the higher the profits by cream-skimming. Large risk dispersion with high market shares of low risks are thus the most attractive situation for insurers behaving alongside the rules established in this model.
Figure 2: Consumer information, insurer information, and adverse selection (sub-markets high risks)
Figure 3: Consumer information, insurer information, and cream-skimming (sub-markets low risks with low risk aversion)
Figure 4: Risk dispersion, market share of low risks and insurer profits (total market, baseline case, assumptions see Table 4)
6. Scenario analysis
The following scenarios investigate the potential impact of the exclusion of new medical services from social health insurance on SPHI markets. For comparison, supplementary insurance refers to a baseline case which is assumed to reflect a full, actuarial fair insurance of the average risk before technological progress occurs. To reduce complexity, the baseline case and the further scenarios feature just one level of information for all types of risks in the market both on the side of consumers and on the side of insurers: all market participants have a 50 per cent knowledge about actual risk. The baseline case also features a significant spread of risks with high risks incurring fourfold the cost of low risks. There is an even market share for both risk types. Risk attitudes differ significantly, with one type being highly risk averse and the other one having a fairly low degree of aversion. Full access to insurance is assumed for all high risks. In reality, (the probability of) access to all risks in the market may depend, among others, on the marketing activities of insurers. An example of a selective marketing strategy will be discussed in a further scenario. Technically, access has not been included in the equations of Table 3. Yet effective selective marketing can easily be understood to include all risk types in target groups to be contracted, and to proportionally decrease actual demand in those risk types which are to be avoided.
The key assumptions for the baseline case and five scenarios are summarized in Table 4, the respective results in Table 5. Each impact scenario represents potential characteristics of technologies that have been excluded from social security coverage and thus may become subject of an SPHI market. The characteristics used refer to the three exclusion strategies set out earlier. Other strategies could be modelled as scenarios by translating them into the risk and information characteristics with which the SPHI market would be confronted. Scenario assumptions, their relation to the exclusion strategies, and results are presented in the following.
First, the ‘‘baseline’’ case functions as a point of reference for the scenarios. With high dispersion of risks but even levels of information on both market sides, it allows for significant cream-skimming. Yet insurer profits only make up half of the latter gains. This is because for high risks in the market both consumers and insurers by given information levels under-estimate the actual risk when contracting. The losses incurred for insurers make up the negative market profitability which is calculated net of adverse selection – which does not occur in this case – and of cream-skimming.
Scenario 1 is the ‘‘information change’’scenario. It continues to use baseline risk levels, but explores the impact of asymmetrically improved information. Information on risk is increased by 10 per cent on the side of insurers, while consumer information is assumed to grow by even 20 per cent. This advantage on the side of consumers might derive from better knowledge about individual risk for specific service packages while average risk in the population may have remained the same. These characteristics reflect exclusion strategy 1. The information change reduces the number of contracts by a quarter, and, in consequence, revenue by about one-fifth. For the improved information level, adverse selection of high risks is emerging to a significant degree. While high risks underestimate their risk, adverse selection in the calculation is not restricted to the part known by the consumer, but fully includes the difference between supply price and actual risk, as it is realized on the market. As better informed low risks who have a low risk aversion leave the market and thereby markedly reduce cream-skimming, total profits vanish to a large extent. Risk underestimation is reduced, and because of the way of calculating adverse selection already described, market profitability goes down to zero.
Ta b le 4 : Scenarios and par ameter assumptions, total mar ket Lo w risk High risk Insur er inf ormation le v e l
Access high risks Consumer information
le v e l Risk a v ersion, lo w Risk a v ersion, high Market shar e, lo w risks Baseline 0.2 0.8 0.5 1 0.5 0.5 0.9 0.5 Scenario 1 0.2 0.8 0.6 1 0.7 0.5 0.9 0.5 Scenario 2 0.25 1 0.5 1 0.5 0.5 0.9 0.5 Scenario 3 0.25 1 0.6 1 0.7 0.5 0.9 0.5 Scenario 4 0.25 1 0.6 1 0.7 0.5 0.9 0.3 Scenario 5 0.25 1 0.6 0.75 0.7 0.5 0.9 0.3 Note : Cost of disease is set at 1.
Ta b le 5 : Scenario results, total mar ket Contracts Rev enue Ad v erse selection Cr eam-skimming Market pr o fi tability Insur er pr o fi t Absolute Baseline 16 9.20 0.00 2.40 1.20 1.20 Scenario 1 1 2 7.44 0.96 1.20 0.00 0.24 Scenario 2 1 6 11.50 0.00 3.00 1.50 1.50 Scenario 3 1 2 9.30 1.20 1.50 0.00 0.30 Scenario 4 1 4 11.38 1.68 1.26 0.00 0.42 Scenario 5 1 1 9.00 1.26 1.26 0.00 0.00 % o f baseline % o f baseline % o f re v en ue % o f re v en ue % o f re v en ue % o f re v en ue Baseline 100.0 100.0 0.0 26.1 13.0 13.0 Scenario 1 75.0 80.9 12.9 16.1 0.0 3.2 Scenario 2 100.0 125.0 0.0 26.1 13.0 13.0 Scenario 3 75.0 101.1 12.9 16.1 0.0 3.2 Scenario 4 85.0 123.7 14.8 11.1 0.0 3.7 Scenario 5 67.5 97.8 14.0 14.0 0.0 0.0
Scenario 2 is the ‘‘costly technology’’ scenario. It describes a situation where a new, effective medical technology becomes available that is relevant for all individuals. It is assumed to increase risk in both groups by 25 per cent, thus leading to higher absolute increases for high risks than for low ones. This is a scenario relevant when interventions are excluded from social coverage because they are considered not to be cost-effective. These characteristics reflect exclusion strategy 2. In this case, the information implications are not necessarily straightforward. With information thus reset to baseline, all risk types again contract and revenue expands, as compared with baseline, by 25 per cent due to the increase of risk. There is no adverse selection, but cream-skimming increases as the mean risk grows at two and a half times the actual increase of low risk, thus extending the profitability of this group. Related to revenue, however, this indicator remains constant as compared with baseline. The same is true for the negative market profitability which results from risk underestimation on both sides of the market.
Scenario 3 is the combined ‘‘information change and costly technology’’ scenario, integrating the changes in assumptions of both scenarios 1 and 2. Risk has increased, and for the clear specification of the technology, information gains are assumed on both sides of the market, but with an advantage on the consumer side. These characteristics reflect exclusion strategy 3. Under the assumptions described, one-quarter of the contracts are lost for low risks that can now escape cream-skimming. As compared with the ‘‘costly technology’’ scenario alone, the profit contribution from the latter group is cut by half. Revenue returns to a level slightly above baseline. Due to increased risk, the impact of adverse selection increases in absolute terms as compared with the ‘‘information change’’ scenario. Information improve-ments, however, even out negative market profitability. Adding together all market effects gives a small profit for insurers. Adding asymmetric information change to the advantage of consumers to the change in technology leads to losses both by increased adverse selection and by reduced cream-skimming. The gains of medical progress alone enjoyed by insurers now only start out on the basis of the ‘‘information change’’ scenario, thus reducing profits, as a percentage of revenue, by three-quarters.
The impact of combining the ‘‘information change’’ scenario and the ‘‘costly technology’’ scenario may however significantly vary for different risk structures. Taking a baseline level for low risks of 0.25 (instead of 0.2), leaving all other assumptions unchanged, and combining the two scenarios completely changes the picture: profits as a percentage of revenue increase, as compared with baseline, by half! This is as with increasing risk, the risk premium increases and is then sufficiently large to have all low risks in the market contract. Those low risks that in Table 5 could escape cream-skimming are thus profitably pulled back into the market. Further sensitivity analysis of baseline levels for low risks reveals two thresholds: from 0.206 up to 0.246, insurer profits as a percentage of revenue are also reduced by three-quarters in the combined scenario. Again, this is because low risks with low risk aversion can escape cream-skimming. Yet, for this range of risks, there is a significant difference as compared with the results in Table 5 when only the assumptions of scenario 1 on information change are considered: these alone are not sufficient to let low risks leave the market, and, in consequence of the risk increase, profits increase instead. Within the range for the baseline level of low risk discussed, only the combination of ‘‘information change’’ and ‘‘costly technology’’, that is, scenario 3, is sufficient to let the low risks with low risk aversions leave the market, escape cream-skimming and thus reduce profits.
Scenario 4 is an ‘‘unattractive market’’ scenario. It uses all the assumptions of the combined ‘‘information change and costly technology’’scenario. But while market shares for low and high-risk types had been kept equal so far, this scenario looks at the implications of a
market where there are 70 per cent high risks. Revenue increases significantly as compared with the former scenario, as all high risks contract. Also, mean risk has increased, but better cream-skimming per case is more than balanced by the decreased market share these individuals have. Given the asymmetric information levels, adverse selection reaches the maximum of all scenarios investigated. Market profitability again is zero, yet leaving in sum insurers with a clear loss.
Scenario 5 is the ‘‘marketing’’ scenario, in an unattractive market. It investigates the potential of insurer marketing activity with respect to the access of the various risk groups. It is assumed that marketing activities focus on low risks and thus implicitly reduce the share of high risks. For assumptions other than high-risk access, those of scenario 4 are used. For simplicity, marketing activities are not costed. Still, their effect is taken to reduce the access of high risks by 25 per cent. If this is achieved, total contracts are reduced to about two-thirds of the individuals in the market. Revenue falls again, slightly below baseline. There is a very small reduction of adverse selection relative to revenue. With absolute cream-skimming remaining constant, this indicator improves when related to revenue. Market profitability remains zero. Even with such a significant change in market access for high risks, just the breakeven point is reached. About two-thirds of the high risks would have to be kept out of the market if the baseline profit rate was to be achieved just by this measure. While marketing measures imply a significant potential to influence profits in this example, their power may be too small when the attractiveness of the total market remains too low.
7. Conclusions
This paper has investigated the potential functioning of SPHI for services which have been excluded from social security coverage. As trends in demography and technological change may increasingly constrain the ability of social security systems to fully cover costly medical progress, opportunities for supplementary insurance may emerge. To analyse the potential impacts on private insurance markets, several steps were taken. Exclusion strategies were defined. Information levels on both sides of the market and risk characteristics were identified as the variables that determine the functioning of SPHI. The impact of exclusion strategies on these determinants describes the transmission mechanism between the func-tioning of social health coverage and SPHI. Contracts and revenue as well as adverse selection, cream-skimming, insurer profits and the residual variable of market profitability were used as performance indicators in order to quantify the functioning of the SPHI market. For analysis, a simulation model was developed. It uses four variables to describe risk types and six variables for market performance. Numerical simulation allows various multivariate changes to be analysed. Given the number of variables included, this leads beyond what could be achieved by comparative static variation of individual variables. Key determinants were analysed in sub-markets of specified risk types. The total market, aggregated over all risk types, was analysed by a number of scenarios which described relevant supplementary market situations. These situations were related to the exclusion strategies defined earlier. Beyond providing results, the model enabled investigation into how market results were composed and how they were achieved. Using the model to describe scenarios allowed different market situations to be quantitatively compared and thus their characteristics relative to each other or to a chosen baseline case to be assessed.
As always, there are a number of restrictions to the model. It does not integrate dynamic processes that may be highly relevant. To grasp, for example, market functioning and its sustainability over time in case adverse selection occurs, it would be necessary to model a
sequence of periods. Integrating dynamic aspects could also include a new technology that has been supplementarily insured undergoing further technological advance, thus eventually increasing risk again. This would lead to the well-known problems in calculating long-term contracts in a technologically advancing society. The model also did not cover cost-sharing arrangements but only used full insurance contracts. It has not dealt with insurer competition that may influence supply price, and it has not considered loading fees that the insurer requires to finance administration, marketing, and interest. The assumptions on insurer behaviour differed from pure actuarial calculation by using mean risk of the market under investigation as a minimum supply price for all low risks, but separating known high risks into individually priced contracts. Concerning the information level, only lack of information on the true risk has been considered, leaving out the possibility of misestimating risk. Last, but not least, neither moral hazard was included nor consumers’ willingness to pay for insurance contracts. Some of these restrictions may be overcome in further work and thus make the model more realistic with respect to specific market situations. Yet, in spite of all restrictions, the model was able to generate some relevant insight into the functioning of SPHI markets, including potential impact of medical progress.
Model results show that for high risks, insurer information must reach at least that of the consumer in order to avoid adverse selection, and that this is especially important when insurer information is low. For low risks, on the other hand, cream-skimming is much less dependent on information levels. Rather, its occurrence primarily varies by the degree of risk aversion. In the total market, insurer profits are positively correlated both with the degree of risk dispersion and with the market share of low risks. Scenario analysis furthermore showed that insurer profits may react quite sensitively to variations in the key variables. The impact of key variables may differ in different markets, sometimes even with qualitative changes within small ranges of parameter assumptions. The model allows this to be investigated in a simultaneous, multivariate approach, accounting for the utility-based decisions of individuals in a range of market segments. Scenarios were also used to derive opportunities and constraints when introducing measures such as marketing for low risks.
In consequence, it seems highly important for profit-oriented insurers to empirically understand the key parameters in the markets in which they wish to operate, and to consider how multivariate changes of these market parameters may affect profits. It remains for future work to elaborate by which techniques and to what quality these variables can best be measured.
Last, but not least, the results of this paper also have implications for those developing exclusion strategies in social health insurance. The information properties of the services that are being excluded, the risk incurred in an actuarial calculation and the risk attitudes of those excluded from social coverage will determine whether a supplementary market will develop and thrive. Policymakers should thus consider the potential performance of private markets if they intend to rely on supplementary coverage: there may be a provision of supplementary private insurance for excluded services in some cases, but not in all.
Annex: the risk premium
In an expected utility framework with risk averse individuals, the risk premium is calculated as follows. Variables used include utilityU, probabilitypof getting the disease, costs of medical care costs, risk equallingp:costs, incomeYat states healthyhand with diseased, incomeYat certainty equivalentc, and risk aversion. By definition, the expected utility and certainty equivalent must render the same utility level:
(a) pU(Yd)þ(1p)U(Yh)¼U(Yc)
Standardizing Yh¼1 and Yd¼0 and choosing U ¼Y(1risk aversion) as a given utility
function yields:
(b) (1p)¼Yc(1risk aversion)
The variable risk aversion is defined 1 for risk neutrality,.1 for risk-seeking preferences and ,1 for risk-averse preferences; it equals the Arrow–Pratt coefficient of relative risk aversion given the above utility function. Standardizing costs at 1 (which makes risk equalp), (b) can be transformed into
(c) Yc¼(1risk)1=(1risk aversion)
The risk premium equals the expected income minus the certainty equivalence income (d) 1risk(1risk)1=(1risk aversion)
As the consumer does not know her actual risk, risk must be substituted in the calculation by the costs expected by her.
REFERENCES
ATHERLY, A., 2001, ‘‘Supplemental insurance: Medicare’s accidental stepchild’’,Medical Care and Research Review, 58, pp. 131–161.
DANZON, P.M., 2002, ‘‘Welfare effects of supplementary insurance: a comment’’,Journal of Health Economics, 21, pp. 923–926.
HANSEN, B.O. and KEIDING, H., 2002, ‘‘Alternative health insurance schemes: a welfare comparison’’,Journal of Health Economics, 21, pp. 739–756.
KIFMANN, M., 2002, ‘‘Community rating in health insurance and different benefit packages’’,Journal of Health Economics, 21, pp. 719–737.
MOSSIALOS, E. and THOMSON, S.M., 2002, ‘‘Voluntary health insurance in the European Union: a critical assessment’’,International Journal of Health Services, 32, pp. 19–88.
WEDIG, G.J. and TAI-SEALE, M., 2002, ‘‘The effect of report cards on consumer choice in the health insurance market’’,Journal of Health Economics, 21(6), pp. 1031–1048.