Particle size effect on porosity and specific surface area
measurements of shales
Ali Tinni, Carl Sondergeld, Chandra Rai.
Mewbourne School of Petroleum and Geological Engineering, University of Oklahoma This paper was prepared for presentation at the International Symposium of the Society of Core
Analysts held in Avignon, France, 8-11 September, 2014
ABSTRACT
Petrophysical properties such as surface area and porosity control the hydrocarbon storage properties in shales. These two properties are generally measured on crushed samples. Concerns have been raised regarding the potential damage induced to the samples during the crushing process and how crushed rock porosity and specific surface area can be related to porosity and specific surface area measured on intact rocks.
To address these potential issues we have measured the specific surface area and porosity of several Haynesville, Wolfcamp, and Barnett shale samples as a function of sample sizes. The Haynesville and Barnett samples were selected from gas producing wells while the Wolfcamp samples were selected from an oil producing well. Porosity was measured on samples having particles sizes of 5.7mm, 3.5mm, 1.6mm and 0.7mm. Specific surface area was measured on 1.6mm and 0.7mm and 0.07mm particle sizes. Specific surface area was measured with the standard BET method while porosity was measured with mercury porosimetry after conformance and blank correction. Additional porosity measurements were performed using the crushed rock helium porosity method.
Our results show that porosity is fairly constant when the particle size is larger or equal to 1.6mm. However below 1.6mm we observed a noticeable increase in porosity. Specific surface area is constant between particle sizes of 1.6mm and 0.7mm but increases between 0.7mm and 0.07mm. This increase in porosity and surface area is due to an increase in accessibility to the pore volume as the particle size decreases.
Introduction and Background
Hydrocarbons are produced from shale reservoirs after the host rocks are hydraulically fractured. Hydraulic fracturing is necessary because the low permeability of the shale formations does not allow hydrocarbon to flow at commercial rates without stimulation. This low permeability renders numerous standard laboratory techniques impractical. In shales, porosity and permeability are often measured on crushed rock particles [1]. The early study by Luffel et al., (1993) [1] known as the GRI method, proposed crushing the shale samples before porosity and permeability measurements were performed because shale plugs generally contain numerous fractures that can affect the measurements. Luffel et al., (1993) [1] assumed that the crushing process would minimize the number of fractures present because the sample will break along the
fracture plans. They proposed 0.7mm particle size (20-30 mesh size) for porosity measurement on crushed shales using helium pycnometry.
Comisky et al., (2011) [2] investigated the particle size effect on Eagle Ford shale samples porosity measurements using the mercury injection capillary pressure technique (MICP). Their study shows that porosity increases as the particle size decreases. They found a good agreement between the porosity measured with MICP on 0.68 mm (20-35 mesh) and porosity measured with helium pycnometry on crushed samples. Tinni et al., (2012) [3] studied the factors affecting the crushed rock permeability measurements. One of the most important factors they have highlighted was the particle size. Tinni et al, (2012) [3] showed that permeability decreased as the particle size becomes smaller. They also imaged the crushed samples with a micro CT scanner and showed the presence of micron sized fractures even in different particle sizes of shale samples.
The following study presents the summary of porosity and specific surface area measurements as a function of particle size on various shale samples.
Experimental procedure and sample description
Sample descriptionFor the purpose of this study we have selected samples from Haynesville, Barnett, and Wolfcamp shale formations. We selected two samples for each formation. The properties of theselected shale samples are summarized in Table I.
Table I: Sample properties. The mineralogy data were obtained with FTIR method [4].
Formation Sample ID Quartz + Feldspars
(wt%) Total Clays (wt%) Total Carbonates (wt%) TOC (wt%) Haynesville H-1 15 68 8 3.5 H-2 5 43 44 2.5 Barnett B-1 21 25 47 2.8 B-2 22 69 4 5.5 Wolfcamp W-1 46 51 3 6.5 W-2 29 46 24 1.9
The Haynesville and Barnett samples were obtained from gas producing wells while the Wolfcamp samples were obtained from an oil producing well.
Sample preparation
The samples selected were prepared for MICP, specific surface area and low pressure helium porosity experiments.
For the MICP and specific surface area measurements, about 150 g of each sample was hand crushed in a ceramic mortar with a pestle and sieved with U.S. standard sieves. Particle sizes of 5.7mm, 3.5mm, 1.6mm, and 0.7mm were selected for the MICP measurements. Particle sizes of 1.6mm, 0.7mm, and 0.07mm were used for the surface
area measurements. The crushed samples were dried in a convection oven at 100oC for at least 48 hours.
Before the MICP measurements the samples were cooled for 30 minutes in a desiccator. In addition to being dried in the convection oven, the samples used for specific surface area measurements were degassed at 100oC under 50mTorr of vacuum.
Nine to 11 grams of sample was selected for crushed helium porosity measurements. The samples used for crushed helium porosity measurements were obtained from the same depths as the samples used for MICP and specific surface area measurements. The selected samples were crushed in a crucible and were not sieved. More details about the sample preparation for the crushed samples helium porosity measurements can be found in Karastathis (2007) [5].
MICP measurements
The MICP measurements were conducted with an Autopore IV on crushed samples of 5.7mm, 3.5mm, 1.6mm and 0.7mm particle sizes. The Autopore IV has a low and high pressure system. The samples were placed in glass penetrometers filled through metallic coated hollow stems. The penetrometer cup containing the sample is placed in the low pressure system where after evacuation mercury is injected in the penetrometer through its stem up to a pressure of 27 psi. After completion of the low pressure steps the penetrometer filled with mercury is placed into the high pressure system, where mercury is pushed in the sample using mineral oil up to a pressure of 60000 psi following logarithm pressure steps. During the mercury injection process (low and high pressure) the volume of mercury introduced is quantified by measuring the capacitance change of the penetrometer stem. To account for the mercury compressibility and the penetrometer compliance a complete MICP experiment was conducted in an empty penetrometer and the apparent intrusion due to mercury and penetrometer compressibility is subtracted from the intrusion data of the samples. This is a normal blank correction.
When mercury is injected within crushed particles a certain pressure is required for mercury to fill all the voids between the particles (conformance volume) before entering the particles. This pressure also known as closure pressure was determined for every MICP measurement by using the method proposed by Bailey (2009) [6] for conformance correction (closure).
Specific surface area measurements
Surface area was determined after a nitrogen gas adsorption experiments. Nitrogen gas adsorption experiments are conducted in subcritical conditions, where the samples are placed in liquid nitrogen bath (77 oK), and nitrogen gas is injected in small pressure increments up to a relative pressure ( ratio of measured pressure to saturation pressure) of 1. The measured adsorbed gas (Q) as function of relative pressure can be used to calculate the total surface area of the sample with the BET theory.
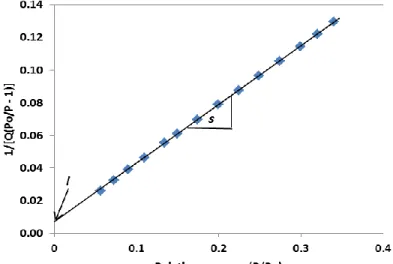
The BET theory is an extension of the Langmuir theory to multilayer adsorption. To calculate the total surface area we plot 1/(Q(P/Po -1)) as a function of the P/Po for 0.05≤ P/Po ≤0.35 (Figure 1). Q is the adsorbed quantity. This plot yields a straight line with a slope, s, and an intercept, i.
From the BET theory the slope of this line is defined by Eqn 1. Where Qm is the amount of adsorbed gas forming a monolayer and C is constant representing the heat of enthalpy.
Figure 1: Example of a BET transform plot. The monolayer capacity can be calculated from the slope and intercept.
(1)
The slope is defined by Eqn 2.
(2)
From Eqns 1 and 2 the monolayer capacity can be computed and the total surface area is calculated with Eqn 3.
(3)
Here, A represents the cross sectional area of the N2 molecule (0.162 nm2). Na is Avogadro’s number and M is the molecular weight of N2. The specific surface area is obtained by dividing the surface area by the weight of the sample.
Results
The conformance corrected MICP porosities for six shales as a function of particle size (Figure 2) show that for samples H-2, B-1, W-2 and W-1 porosity is fairly constant down to a particle size of 1.6mm. Below a particle size of 1.6mm we observed a noticeable increase in porosity by as much as a factor of 2 for the lower porosity samples. For samples H-1 and B-2, it appears that porosity increases linearly from a particle size of 5.7mm to 0.7mm; this increase is 34% for sample H-1 and 87% for sample B-2.
Figure 2: Conformance corrected MICP porosity for six shales as a function of particle size. For the majority of the samples, noticeable changes in porosity occur between 1.6mm and 0.7mm particle sizes.
The comparison between the MICP porosity measured at different particle size and the crushed helium porosity (Figure 3) shows that for these samples, the crushed helium porosity is always higher than the MICP porosity regardless of the particle size.
Figure 3: Comparison between the crushed helium porosity and the MICP porosity for the selected shales at different particle sizes.The MICP porosity is always smaller than the crushed helium porosity.
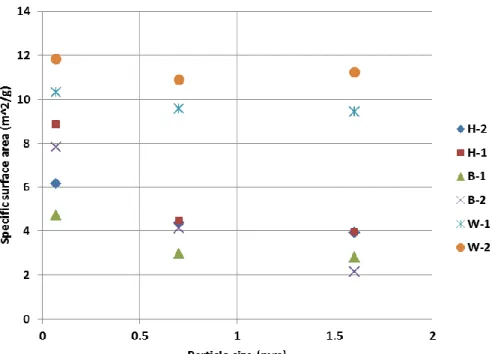
Figure 4 shows the specific surface area measurements as a function of particle size. The specific surface area is constant between 1.6 and 0.7mm for most of the samples.
However, for sample B-2 we observe an increase in specific surface area by a factor 2 between a particle size of 1.6mm and 0.7mm. When the particle size decreased from 0.7mm to 0.07mm specific surface area increased for all samples. The maximum increase in specific surface area was observed for sample H-1 where specific surface area doubles between particle sizes of 0.7mm to 0.07mm.
Figure 4: Specific surface area as a function of particle size for six shale samples. We observe a noticeable increase in specific surface area between 0.7mm and 0.07mm particle sizes.
We have summarized the different porosity and specific surface area measurements in two tables contained within the appendix.
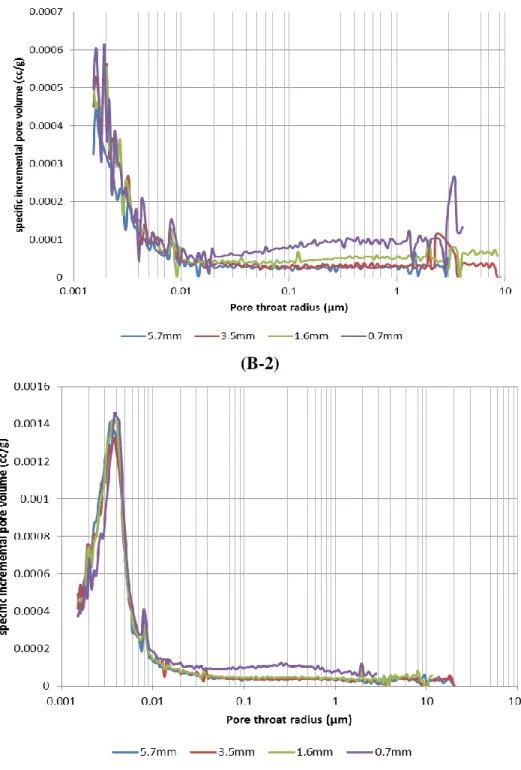
Figure 5 shows the MICP pore throat size distributions for sample B-2 and W-1 at different particle sizes. B-2 exhibits porosity and specific surface area changes at every particle size and W-1 shows little variation in porosity and surface area.
The MICP pore throat size distributions for sample B-2 do not exhibit a peakin intrusion volume. When the particle size decreases from 5.7mm to 3.5mm, 90% of the porosity increase is associated with an increase of the pore throats smaller than 10 nm. The rest of the porosity increase (10%) is associated with an increase of the volume associated with pore throats having a radius between 2-4µm. These micron sized pores are within the size range of the cracks observed in a previous study [3]. From 3.5mm to 0.7mm, the pore volume accessed by pore throats smaller than 10 nm is constant. However, we observe an increase in thepore volume accessed by pore throats larger than 20 nm.
Regarding sample W-1, the pore throat curves are the same for all particle sizes, except at 0.7mm where we observe an increase of the pore throats larger than 20nm.
(B-2)
(W-1)
Figure 5: Pore throat size distributions as a function of particle sizes for sample B-2 and sample W-1. These distribution have been conformance corrected with the method of Bailey (2009) [6]. Note that in both sets
Discussion
The comparison between the MICP porosity and crushed helium porosity at different particle sizes (Figure 3) is in disagreement with the results of Comisky et al., (2011) [2] where they found good agreement between the MICP porosity at 0.68mm particle size and the crushed helium porosity. We have followed the same sample preparation protocol as well as the same conformance correction as Comisky et al., (2011) [2]. Therefore the discrepancy between the two studies can be attributed to the difference between the texture of Eagle Ford samples used by Comisky et al., (2011) and the samples used in the present study.
In a previous study [9] we have established that a significant portion of the flow path in shales is controlled by pores generally associated with the clays. Curtis et al., (2011) [10] observed with TEM techniques that the clay pores have a diameter generally smaller or equal to 3nm, while the smallest diameter accessible with mercury at 60,000psi is about 3nm. These small pores will control the access to relatively larger pores contained within the organic matter. Therefore crushing the sample will expose more of the larger pores, which can be accessed easier by mercury. We observe this phenomenon in our dataset where the samples that exhibit porosity increase at every particle size have the highest clay content (68wt% for H-1 and 69wt% for B-2).
The increase of porosity from 1.6mm to 0.7mm particle size is not associated with an increase in specific surface area because the large pores accessed by mercury at 0.7mm particle do not have a significant surface area. The lack of increase in specific surface area between 1.6mm and 0.7mm particle size also shows that the creation of new cracks is negligible because the low aspect ratio of the cracks would have increased the specific surface area.
The increase of accessibility to larger pores when particle size decreases is counter intuitive if we consider the crushed rock permeability measurements where apparent permeability decreases as particle size decreases [3], [11]. The crushed rock permeability measures an apparent permeability which is highly affected by gas slippage [3], [12] due to the low pore pressure used and overall small pore size. Gas slippage tends to increase the value of apparent permeability. Therefore, when the particle size decreases, access to larger pores increases, while apparent permeability decreases because of a reduction in gas slippage.
Figure 6 shows the difference between the specific surface areas measured at 0.07mm and 0.7mm particle size. This difference depends on the amount of organic matter contained within the sample. This observation implies an increase in accessibility of organic pores when the particle size decreases. However, sample W-1 does not follow the general trend. This is probably due to better pore accessibility than the other samples at 0.7mm particle size.
Figure 6: Difference between specific surface areas measured at 0.07mm and 0.7mm particle size. Sample W-1 (square) does not follow the general trend because of better pore accessibility than the other samples at
0.7mm particle size.
Conclusion:
In this study, porosity and specific surface area were measured as a function of particle sizes for 6 shale samples selected from various producing shale formations. The measured MICP porosity is independent of particle size over the range of sizes from 5.7mm to 1.6mm. However, a noticeable increase in porosity is observed between 1.6mm and 0.7mm particle size. The crushed rock helium porosity is always higher than the MICP porosity regardless of the particle size used for MICP measurements. This difference can reach, on average, a factor of 2.3 for 5.7mm particle size and 1.5 for 0.7mm particle size. Specific surface area is constant between 1.6mm and 0.7mm, but increases between 0.7mm and 0.07mm. These changes in porosity and specific surface area reflect the accessibility to various parts of the pore space as a function of particle size. The generation of new cracks in the samples appears to be negligible.
References
1- Luffel, D.L., Hopkins, C.W., Holditch, S.A., and Schettler, P.D. “Matrix Permeability Measurement of Gas Productive Shales”. SPE 26633 presented at the SPE Annual Technical Conference and Exhibition, Houston, Texas, 3-6 October, 1993.
2- Comisky, J.T., Santiago, M., McCollom, B., Buddhala, A., and Newsham, K.E. “Sample Size Effects on the Application of Mercury Injection Capillary Pressure for Determining the Storage Capacity of Tight Gas and Oil Shales”. SPE 149432 presented at the Canadian Unconventional Resources Conference, Alberta, Canada, 15-17 November, 2011.
3- Tinni, A., Fathi, E., Agarwal, R., Sondergeld, C., and Rai, C. “Shale Permeability Measurements on Plugs and Crushed Samples”. SPE 162235 presented at the Canadian Unconventional Resources Conference, Alberta, Canada, 30 October – 1 November, 2012.
4- Sondergeld, C. H. and Rai, C. “A New Exploration Tool: Quantitative Core Characterization”. PAGEOPH, 1993, 141, 2/3/4, 249-268.
5- Karastathis, A.” Petrophysical Measurements on Tight Gas Shale”. Master’s Thesis, University of Oklahoma, Norman, Oklahoma, 2007.
6- Bailey, S. “Closure and Compressibility Corrections to Capillary Pressure Data in Shales”. Oral presentation given at the DWLS 2009 Fall Workshop.
7- Clarkson, C. R., Wood, M. J., Burgis, S. E., Aquino, S. D., Freeman, M., and Briss, V. “Nanopore Structure Analysis and Permeability Predictions for a Tight Gas/Shale Reservoir using Low-Pressure Adsorption and Mercury Intrusion Techniques”. SPE 155537 presented at the SPE Americas Unconventional Resources Conference, Pittsburgh, Pennsylvania, 5-7 June, 2012.
8- Kuila, U., Prasad, M., Derkowski, A., and McCarty, D. K. “Compositional Controls on Mudrock Pore-Size Distribution: An Example from Niobrara Formation”. SPE 160141 presented at the SPE Annual Technical Conference and Exhibition, San Antonio, Texas, 8-10 October, 2012.
9- Tinni, A., Oudusina, E., Sulucarnain, I., Sondergeld, C., Rai, C. “NMR Response of Brine, Oil and Methane in Organic Rich Shales”. SPE 168971 presented at the SPE Unconventional Resources Conference, Woodlands, Texas, 1-3 April, 2014.
10- Curtis, M., Ambrose, R., Sondergeld, C., Rai, C. “Transmission and Scanning Electron Microscopy Investigation of Pore Connectivity of Gas Shales on the
Nanoscale”. SPE 144391 presented at the North American Unconventional Gas Conference and Exhibition, Woodlands, Texas, 14-16 June, 2011.
11- Suarez-Rivera, R., Chertov, M., Willberg, D., Green, S., Keller, J. “Understanding Permeability Measurements in Tight Shales Promotes Enhanced Determination of Reservoir Quality”. SPE 162816 presented at the Canadian Unconventional Resources Conference, Alberta, Canada, 30 October – 1 November, 2012. 12- Fathi, E., Tinni, A., and Akkutlu, Y. “Shale Gas Correction to Klinkenberg Slip
Theory”. SPE 154977 presented at the SPE Americas Unconventional Resources Conference, Pittsburgh, Pennsylvania, 5-7 June, 2012.
Appendix
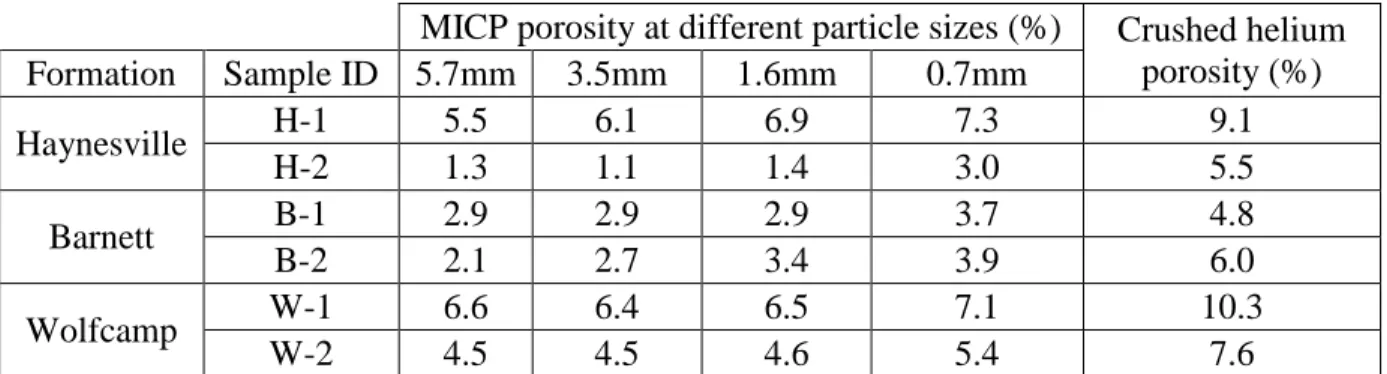
Table A-I: MICP porosity measured at different particle sizes and crushed helium porosity.
MICP porosity at different particle sizes (%) Crushed helium porosity (%) Formation Sample ID 5.7mm 3.5mm 1.6mm 0.7mm Haynesville H-1 5.5 6.1 6.9 7.3 9.1 H-2 1.3 1.1 1.4 3.0 5.5 Barnett B-1 2.9 2.9 2.9 3.7 4.8 B-2 2.1 2.7 3.4 3.9 6.0 Wolfcamp W-1 6.6 6.4 6.5 7.1 10.3 W-2 4.5 4.5 4.6 5.4 7.6
Table A-II: Specific surface area measured at different particle sizes.
Specific surface area at different particle sizes (m2/g)
Formation Sample ID 1.6mm 0.7mm 0.07mm Haynesville H-1 3.95 4.48 4.73 H-2 3.94 4.38 7.84 Barnett B-1 2.81 2.97 10.32 B-2 2.16 4.12 11.83 Wolfcamp W-1 9.42 9.57 6.17 W-2 11.23 10.89 8.87
![Table I: Sample properties. The mineralogy data were obtained with FTIR method [4].](https://thumb-us.123doks.com/thumbv2/123dok_us/419053.2548049/2.918.127.838.635.806/table-sample-properties-mineralogy-data-obtained-ftir-method.webp)