NUKLEONIKA 2010;55(4):501−505
Introduction
The transport of radon (222Rn) from the ground towards the surface is influenced by a number of geophysical and geological parameters, among them seismicity. Prior to an earthquake, the formation of stress causes changes in the strain field. The displacement of rock mass within the earth’s crust before an earthquake leads to changes in gas transport from deep layers in the earth to the surface [5]. As a result, larger quantities of radon are released from the pores and fractures of the rocks towards the surface. This may be considered as an anomaly in the concentration of radon. Because of seismicity, changes in underground fluid flow may ac-count for anomalous changes in concentration of radon and its progeny [8]. A small change in velocity of gas [6] into or out of the ground causes a significant change in radon concentration at shallow soil depth as changes in gas flow disturb the strong radon concentration gradient existing between the soil and the atmosphere. A small change in gas flow velocity causes a significant change in radon concentration. Thus, monitoring of radon in soil gas is a means of detecting changes related to an earthquake.
For small earthquakes, it is often impossible to identify an anomaly caused by a seismic event and not by meteorological or hydrological events. Therefore, the implementation of more advanced statistical methods in data evaluation appears to be essential [1, 3, 7].
In this contribution, the 32-month time series of radon concentration together with the environmental parameters (air and soil temperature, barometric
pres-Identification of radon anomalies in soil
gas using decision trees and neural
networks
Boris Zmazek, Sašo Džeroski, Drago Torkar, Janja Vaupotič, Ivan KobalB. Zmazek, S. Džeroski, D. Torkar, J. Vaupotič, I. Kobal
Jožef Stefan Institute,
39 Jamova Str., 1000 Ljubljana, Slovenia, Tel.: +386 1 477 3213, Fax: +386 1 477 3811, E-mail: janja.vaupotic@ijs.si
Received: 13 August 2009 Accepted: 30 December 2009
Abstract. The time series of radon (222Rn) concentration in soil gas at a fault, together with the environmental param-eters, have been analysed applying two machine learning techniques: (i) decision trees and (ii) neural networks, with the aim at identifying radon anomalies caused by seismic events and not simply ascribed to the effect of the environmental parameters. By applying neural networks, 10 radon anomalies were observed for 12 earthquakes, while with decision trees, the anomaly was found for every earthquake, but, undesirably, some anomalies appeared also during periods without earthquakes.
sure, rainfall) has been analysed in order to find radon anomalies, possibly caused by earthquakes.
In a 480 cm deep borehole at the Orlica fault in the Krško basin in SE Slovenia (Fig. 1), radon concentration in soil gas was measured continuously (once an hour) using a Barasol radon probe (MC-450, ALGADE, France). In addition to radon, the probe also measures barometric pressure and temperature. The borehole wall was protected with a plastic tube and isolated from the atmospheric air with a plastic cap and soil cover to reduce hydro-meteorological influence on the mea-surement. Decision trees and artificial neural networks have been applied to predict radon concentration from meteorological data.
As often experienced, for earthquakes Dobrovolsky’s equation [4] was used to calculate RD, i.e., RD = 100.43M, where M is the earthquake magnitude and RD the radius of the zone within which precursory phenomena may be manifested (the so-called Dobrovolsky’s radius in km). Earthquakes, for which the ratio between RE (distance between the epicentre and our measuring site) and RD is less than 2, have been used in the interpretation.
Methodology
The time series was divided into two subsets: (i) the seismic activity (SA) subset possibly affected by seismic activity, comprising the data recorded during periods (called “seismic windows”) lasting from n days before to
n days (n varying from 1 to 10 days) after the occurrence of a seismic event, and (ii) the non-SA subset without seismic events, with data remained after subtracting the SA subset from the entire database. Both decision trees and neural networks were trained to predict the radon activity concentration based on the non-SA subset of the environmental data. The entire series was then subjected to analysis and the prediction appeared to fail during the SA periods. By appropriately chosen analytical condi-tions, a statistically significant difference between the measured and predicted values of radon concentration was observed before earthquakes (called “correct anoma-lies” – CA). Unfortunately, anomalies were observed also during non-SA periods (called “false anomalies” – FA). On the other hand, for some earthquakes no anomaly was found (called “no anomalies” – NA).
Results and discussion
Experimental details are described elsewhere [12]. Air temperature and rainfall were measured at the meteo-rological station Bizeljsko, approximately 14 km from the boreholes. Data recorded are shown in Fig. 2.
Decision trees
Since radon concentration is a numeric variable, we have approached the task of predicting radon concen-Fig. 1. The map of Slovenia with the measurement site at the Krško town (black circle) and epicentres of the earthquakes (open circles, with radii corresponding to their magnitudes) which occurred from April 1999 to October 2001, and taken into account in our calculations.
tration from meteorological data using regression (or function approximation) methods. We used regression trees [2], as implemented with the WEKA data mining suite [9].
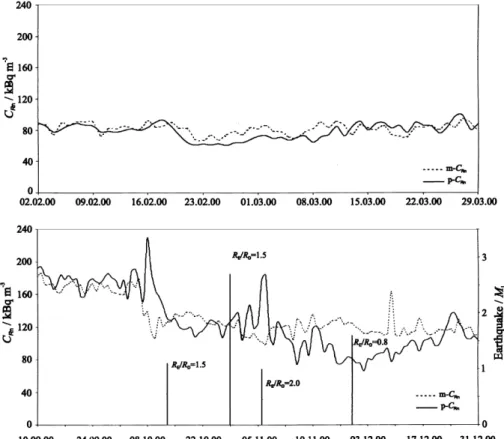
When seismic windows of 7 days have been used, the best agreement between the measured and calculated concentrations during the non-SA periods has been found by an analysis in which the length of the SA pe-riods was varied from 1 to 7 days [11]. The largest drop in the correlation coefficient was observed between 6 and 7 days before an earthquake. For every earthquake, a CA anomaly was found, but, undesirably, we have not been able to decrease the number of FA anomalies below 6. Figure 3 shows the measured radon concentra-tion (m-CRn; dotted line) and that predicted by decision trees (p-CRn; full line). While the upper plot shows good agreement between the measured and predicted values in a non-SA period (from February 2, 2000 to March
3, 2000), the lower one shows a significant difference between the 2 in the SA periods (from September 9, 2000 to December 31, 2000). Next to bars, showing the magnitude of the earthquakes, values of the RE/RD ratios are also given.
Neural networks
The ANNs (artificial neural networks)are a well estab-lished tool for forecasting problems in different areas, like weather, econometrics, financial, stock prices, material science, with over 40 years of tradition [10]. Be-cause of their universal approximated functional form, ANNs also appear to be an appropriate choice for mod-elling nonlinear dependency of radon concentrations on multiple variables. An enormous number of various topologies, training algorithms and architectures exist, Fig. 2. Time run of daily average radon concentration in soil gas and of soil temperature recorded with Barasol probes in 480 cm deep boreholes at the Krško-1 station at the Orlica fault in the Krško basin during the period from June 2000 to Janu-ary 2002. Local earthquakes with RE/RD equal to or less than 2 [4], barometric pressure, air temperature and rainfall at the nearby meteorological station Bizeljsko are also shown.
applicable to a class of modelling problems. It is difficult to tell in advance which training rule is the most suitable for a certain problem or which topology would produce the best results. After extensive experimentation using the collected data we have chosen the traditional MLP (multilayer perceptron) with conjugate gradient learn-ing algorithm for use in further actions.
The non-SA datasets contained from 816 samples (seismic window 0 days) to 550 samples (seismic window 10 days) and were firstly randomized and then each of them was divided into three sets: (i) the training set (60%), (ii) the cross-validation set (15%) and (iii) the test set (25%). The training and the cross-validation sets were used to train the ANN while the test set was Fig. 3. Comparison of the measured radon concentration (m-CRn; dotted line) and the radon concentration predicted by decision trees (p-CRn;full line) for non-SA period from February 2, 2000 to April 29, 2000 (upper graph) and for SA period from September 10, 2000 to December 31, 2000. Also earthquakes are drawn as bars and RE/RD ratio is given.
Fig. 4. Comparison of the measured radon concentration (m-CRn; dotted line) and radon concentration predicted by ANN (p-CRn; full line) for the non-SA period from Febru-ary 2, 2000 to April 29, 2000 (upper graph) and for the SA period from September 10, 2000 to December 31, 2000. Also earthquakes are drawn as bars with the values of RE/RD ratios attached.
used to verify its performance. The number of hidden layers and the training parameters (the learning step, the momentum) were selected by a well known genetic algorithm which creates a population of solutions and applies genetic operators such as mutation and cross-over to evolve the solutions in order to find the best one. For the transfer function tanh() was used in all four layers.
For each dataset out of 11, the ANN with two hid-den layers with 5 neurons in the input layer fed by the five environmental data, 8 neurons in the first hidden layer, 7 in the second hidden layer and one neuron in the output layer was generated. The network was trained two times for predefined 45 000 epochs with reset of weights after the first training although the training and cross-validation error converged much sooner in most of the cases.
We also investigated the possibility of an automatic definition of anomaly detection parameters for the available dataset. Observing the difference in correlation coefficients between the ANN prediction of non-SA data and SA + non-SA data we indicated that SA affects the radon concentrations mostly for ± 7 days away from the seismic event. From 13 earthquakes, 10 CA and no FA or NA anomalies were found.
Figure 4 shows the measured radon concentration (m-CRn;dotted line) and radon concentration predicted by ANN (p-CRn;full line). While the upper plot again shows good agreement between the measured and predicted values in a non-SA period (from February 2, 2000 to March 3, 2000), the lower one shows a signifi-cant difference between them in the SA periods (from September 9, 2000 to December 31, 2000). Earthquakes are shown as bars with RE/RD ratio.
Conclusion
The results of applying decision trees and neural networks to identify radon anomalies, possibly caused by seismic events and not solely ascribed to the effects of environ-mental parameters, are encouraging. We shall direct our efforts towards improvement in applying both methods, in order to have the number of CA anomalies equal to the number of earthquakes, and to reduce the number of FA and NA anomalies to a minimum, desirably to zero.
Acknowledgment. The study was financed by the Slove-nian Research Agency.
References
Belyaev AA (2001) Specific features of radon earthquake 1.
precursors. Geochem Int 12:1245–1250
Breiman L, Friedman JH, Olshen RA, Stone CJ (1984) 2.
Classification and regression trees. Wadsworth, Bel-mont
Di Bello G, Ragosta M, Heinicke J
3. et al. (1998) Time
dynamics of background noise in geoelectrical and geochemical signals: an application in a seismic area of Southern Italy. Il Nuovo Cimento 6:609–629
Dobrovolsky IP, Zubkov SI, Miachkin VI (1979) Estima-4.
tion of the size of earthquake preparation zones. Pure Appl Geophys 117:1025–1044
Fleischer RL (1997) Radon in earthquake prediction: 5.
radon measurements by etched track detectors: applica-tions in radiation protection. In: Durrani SA, Ilic R (eds) Earth sciences and the environment. World Scientific, Singapore, pp 285–299
Grammakov AG (1936) On the influence of some factors 6.
in the spreading of radioactive emanations under natural conditions. Zh Geofiz 6:123–148
Negarestani A, Setayeshi S, Ghannadi-Maragheh M, 7.
Akashe B (2001) Layered neural networks based analysis of radon concentration and environmental parameters in earthquake prediction. J Environ Radioact 62:225–233 Steinitz G, Begin ZB, Gazit-Yaari N (2003) Statistically 8.
significant relation between radon flux and weak earth-quakes in the Dead Sea rift valley. Geology 31:505–508 Witten IH, Frank E (1999) Data mining: practical ma-9.
chine learning tools and techniques with Java implemen-tations. Morgan Kaufmann, San Francisco
Zhang G, Patuwo BE, Hu MY (1998) Forecasting with 10.
artificial neural networks: the state of the art. Int J Fore-casting 14:35–62
Zmazek B, Todorovski L, Džeroski S, Vaupoti
11. č J, Kobal
I (2003) Application of decision trees to the analysis of soil radon data for earthquake prediction. Appl Radiat Isot 58;6:697–706
Zmazek B, Živ
12. čić M, Vaupotič J, Bidovec M, Poljak M, Kobal I (2002) Soil radon monitoring in the Krško basin, Slovenia. Appl Radiat Isot 56:649–657