L.H. Lee, M. E. Kuhl, J. W. Fowler and S.Robinson, eds.
ABSTRACT
There are two key issues in assuring the accuracy of esti-mates of performance obtained from a run of a single sce-nario with a simulation model. The first is the removal of any initialization bias, the second is ensuring that enough output data are produced to obtain an accurate estimate of performance. This paper describes the results of a three year project which aimed to produce an automated proce-dure, for inclusion into commercial simulation software to achieve these key aims. Our automatic output analyser will estimate the length of warm-up to remove initializa-tion bias from the simulainitializa-tion output data. It then estimates the number of replications required to achieve a set preci-sion in the output point estimator or analyses a single run. 1 INTRODUCTION
The adoption of simulation software by non-experts has almost certainly led to a significant problem with the use of the simulation models that are being developed. The ap-propriate analysis of simulation output requires specific skills in statistics that many non-experts do not possess. Decisions need to be made about initial transient problems, the length of a simulation run and the number of independ-ent replications that need to be performed (Law, 2007; Robinson, 2004). These decisions are often left to the user with little or no help from the software. As a result, it is likely that many simulation models are being used poorly. Indeed, Hollocks (2001) in a survey of simulation users provides evidence to support the view that simulations are not well used. The consequences are that incorrect conclu-sions might be drawn, at best causing organizations to for-feit the benefits that could be obtained, and at worst lead-ing to significant losses with decisions belead-ing made based on faulty information. One solution is to implement an au-tomated output analysis procedure in simulation software. This would overcome the problem of the need for a high level of statistical skills.
This paper recommends the structure for an automated analyser based on research to provide the most appropriate techniques for this purpose. The analyser has a branching decision structure, appropriate for a range of simulation models and may be implemented, in part, or as a whole in any simulation package. It is called the Automated Simula-tion Output Analyser (AutoSimOA). SecSimula-tion 2 provides a specification of the objectives with an overview of Auto-SimOA. Section 3 describes the 3 main components of AutoSimOA: warm-up analyser, replications calculator and single run analyser. Section 4 illustrates how AutoSimOA works with an example case study. A discussion on im-plementation issues and conclusions can be found in Sec-tions 5 and 6 respectively.
2 AN OVERVIEW OF AUTOSIMOA
Our objective is to achieve a non-biased point estimate and confidence interval for the finite population mean = E(X), where X represents an output variable produced from a dis-crete event simulation model by automating the procedures for gaining sufficient accuracy to obtain that estimate. 2.1 AutoSimOA
Figure 1 is a schematic overview of the components of Au-toSimOA. It consists of three main parts: the warm-up analyser, the replications calculator and the single run ana-lyser. The person running the simulation model (i.e. the user) interacts with the analyser. He/she is first asked to choose between running the model using multiple replica-tions, usually for a terminating simulation, or one (long) run, usually for a non-terminating simulation.
The choice defines the path(s) that they will be able to take through AutoSimOA. On either path, the user will then decide whether the simulation needs a warm-up analysis. AUTOMATING DISCRETE EVENT SIMULATION OUTPUT ANALYSIS – AUTOMATIC ESTIMATION OF
NUMBER OF REPLICATIONS, WARM-UP PERIOD AND RUN LENGTH.
Kathryn Hoad Stewart Robinson
Ruth Davies Warwick Business School The University of Warwick
Once the warm-up is determined, if needed, the analyser will determine the necessary number of replications or the length of the run, depending on the path. In more detail:
• Multiple replications (left side): a choice of multiple replications will result in the warm-up analysis (if required) being carried out on data av-eraged over a number of replications (default of 5 replications). The replications calculator compo-nent is then used to estimate how many replica-tions should be run to achieve the required preci-sion in the mean estimate.
• One long run (right side): a choice of one run causes AutoSimOA to use one run for any warm-up analysis. The user is then given a choice of running the model for a set time period and ana-lyzing the data produced using the batch means calculator, or allowing the run-length calculator component to choose a run length (with or with-out a precision requirement).
Figure 1: Paths through the Automated Simulation Output Analyser (AutoSimOA).
3 THE THREE MAIN COMPONENTS 3.1 Warm-Up Analyser
MSER-5 (White, 1997) was selected from a total of 44 ‘warm-up’ methods found in the simulation literature, by a combination of short-listing and testing (Hoad et al.., 2008a). Extensive testing of the MSER-5 method showed that this method was robust and ideally suited to automa-tion (Hoad et al.., 2008b). Those finding the warm-up for a simulation with multiple replications would use MSER-5 with 5 replications as it is more robust (Hoad et al.., 2008b) whereas those using one run, would use only the one run data. In order to ensure that the user has sufficient steady state data in order to find an appropriate cut-off point, the MSER-5 calculations are embedded in a sequential heuris-tic procedure. This procures more data (i.e. in pracheuris-tice, the simulation run is continued) until a truncation point is found and accepted by the user.
3.2 Replications Calculator
The approach we have chosen to adopt (Hoad et al.., 2008c) is analogous to the sequential procedure due to Chow and Robbins (1965), and is described in Law (2007) and Robinson (2004). We shall refer to it as the confi-dence interval method. The method is summarized here and described in detail in Hoad et al.et al.. (2008c).
The user is asked to specify the precision and signifi-cance level they require for a confidence interval around the mean of the output variable of interest. The precision is defined in terms of the half-width of the confidence in-terval as a percentage of the mean. Replications are then run, and confidence intervals constructed around the se-quential cumulative means, until the desired precision in the output is achieved. We have automated this basic method and further adapted it to include a ‘look ahead’ step. This is to try to avoid the occurrence of premature convergence, where the data converges to the required pre-cision by chance, but not necessarily around the true mean value and then quickly diverges again. When the precision requirement is first met the algorithm is run with a further set number of replications in order to check that the preci-sion requirement continues to be met.
A ‘fail safe’ is incorporated into the Replications Algo-rithm to warn the user if the algoAlgo-rithm is likely to take a long period of time to converge to the desired precision (Hoad et al.., 2008c). The analyser also includes the ability for the user to specify the required precision in absolute terms and allows the user to specify different precision values for each output variable of interest. The user should be able to call up graphs of every output variable during
and after the trial calculator has stopped running. The dis-played results contain the name of the output variable with the estimated number of replications for that output. Un-finished output variables (produced when the ‘fail safe’ procedure is evoked) are also included in the final dis-played results with a suitable comment and the estimated number of replications required as calculated when the al-gorithm was terminated (Hoad et al.., 2009).
3.3 Single Run Analyser
Assuming the user wants to use only one run there are three main possible options:
1. The user has a specific set run length in mind (e.g. one month) and wants a mean value with a valid confidence interval at the end of this set time (i.e. no precision requirement).
a. The output analyser should therefore imple-ment a suitable algorithm to calculate the mean and confidence interval from the given data and report the precision achieved. b. If the data are not sufficient to produce a
va-lid confidence interval the algorithm should advise the user accordingly.
2. The user desires a mean estimate with a confi-dence interval of a specific precision.
a. The output analyser should therefore run the model until enough data are collected for a suitable algorithm to achieve a valid confi-dence interval to the required precision. b. The user must be given the ability to abort the
procedure if the method is taking too long (i.e. too much data are required for the speci-fied precision). The algorithm should then form a valid confidence interval, if possible, using the data created thus far, and report the precision achieved.
3. The user neither requires a specific precision nor does the user have a set run length in mind. a. The output analyser should therefore run the
model until enough data are collected for a suitable algorithm to achieve a valid confi-dence interval.
b. The user must be given the ability to abort the procedure if the method is taking too long. The methods investigated in this project were ‘batched means’ methods (Conway, 1963; Fishman, 1978; Fox et al.., 1991), as these were deemed to be amenable for auto-mation. A search of the simulation literature was carried out to find and assess the existing batch means methods (Hoad et al.., 2009).
Batch methods generally fall into one of two categories, sequential or set sample size. The first indicates methods that sequentially request more data until some stopping cri-terion (e.g. precision requirement) is fulfilled. These
me-thods are therefore appropriate for achieving options 2 and 3 above. The second category of methods acts upon a set amount of data, producing results if possible, with only the data given. These methods are appropriate for achieving option 1 above.
Bearing this in mind we selected a method from each category, ASAP3 (Steiger et al.., 2005) and LABATCH2 (Fishman, 1998). Both of these methods are fairly recent and received good recommendations and test results in the literature (Steiger et al., 2005, Alexopoulos 2006, Lada et al., 2008, Fishman 1998). ASAP3 is a sequential proce-dure that attempts to create a valid confidence interval around the mean estimate to a set precision (described in either absolute or relative terms). It can however also run with no precision requirement and hence seemed appropri-ate for applying to options 2 and 3 above. The LABATCH2 algorithm seemed appropriate for achieving option 1, as it does not work to a set precision but uses a set number of data.
4 USING AUTOSIMOA – A CASE STUDY
AutoSimOA was implemented in a spreadsheet in order to test its use. All the paths were tested with real model out-put (Hoad et al.., 2009). We illustrate this here with an ex-ample that uses just one of the paths (see figure 2).
The chosen model simulates calls received, processed and actioned at an IT support help desk (Robinson, 2001). The output of interest is the average time the calls spend in the system. This is a steady state output with a substantial initial bias. The true steady-state mean is estimated to be 2269 using 54,000 steady-state data points.
Figure 2: Path through AutoSimOA for example model shown on an outline of figure 1.
4.1 Results
Five replications of length 500 were run and averaged to give 500 averaged data points. These were input into the warm-up analyser which recommended a warm-up period of 70 data points. From the graph produced (Figure 3) it
appeared that the data had stabilized and a truncation point of 70 seemed reasonable. This recommended warm-up pe-riod was therefore accepted and the current data (5 replica-tions) truncated accordingly. This left a truncated run-length of 430.
Figure 3: Warm-up calculator output showing MSER-5 test statistic and batched data
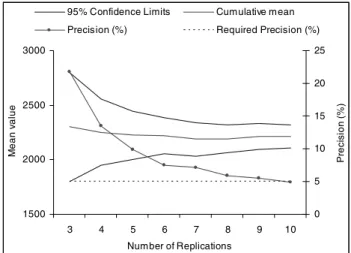
AutoSimOA then determined the number of replica-tions. On entering the replications calculator the user can determine the run length to be different than that used by the warm-up analyser, It was increased to a 1000 in this case. More simulation output data were therefore created to bring each of the 5 truncated replications to a length of 1000. The input parameters for the replications calculator were set at 5% for required precision and a significance level for the confidence intervals of 95%. The calculator recommended that 10 replications be run to achieve the re-quired precision. A 95% confidence interval (2104.5, 2318.1) was also constructed around the mean estimate of 2211.3, which gave coverage of the estimated true mean. The analyser showed a graph of the cumulative mean with confidence limits and precision overlaid (see figure 4).
1500 2000 2500 3000 3 4 5 6 7 8 9 10 Number of Replications M ean v alue 0 5 10 15 20 25 P rec is ion ( % )
95% Confidence Limits Cumulative mean
Precision (%) Required Precision (%)
Figure 4: Replications Calculator output showing the cu-mulative mean with 95% confidence intervals and preci-sion.
5 SOME IMPLEMENTATION ISSUES
Simulation users invariably produce multiple outputs and they may be interested in getting an accurate sample mean and confidence interval on any one of these. Some of these results accumulate as the simulation runs (e.g. average queue length). This makes it unsuitable for use in MSER-5 and batch means methods as the variance in the data re-duces as the number of data points increases and the data are very highly auto-correlated. Such data need to be dis-aggregated prior to analysis by AutoSimOA.
If AutoSimOA is used with with multiple outputs., es-timates for the warm-up period, the number of replications or run-length with mean estimates and confidence intervals would be produced for each output of interest to the user.
The user can decide to run the model for other scenar-ios, using the largest warm-up period, number of replica-tions or run-length estimated for all the output variables of interest. Alternatively the user can run each specific sce-nario through AutoSimOA, but this could lead to different warm-up periods and the use of different amounts of data which makes comparison of scenarios more difficult to in-terpret. Fixing the warm-up and number of replications for all scenarios does, therefore, have its benefits. It is rec-ommended, however, that the user at least check periodi-cally that warm-up periods and the amount of data required have not significantly changed while running multiple sce-narios.
Regarding the Run-length Calculator, using ASAP3 for different scenarios may well lead to the results of each sce-nario being based on a different data total. This has impli-cations when comparing results across scenarios. A prag-matic option is to take the batch size and number of batches used to create the summary results for one scenario and use these in subsequent runs of the model. The danger with this approach is that ASAP3 produces a correlation adjusted confidence interval based on previous calculations and therefore the validity of the summary results is not just dependent on the batch size and number used. It would perhaps be safer to take the data total used by ASAP3 and use this in LABATCH2. The user would then be able to see for each scenario when and if the confidence interval appeared valid and of a reasonable precision and adapt ac-cordingly.
6 CONCLUSION
An automated simulation output analyser, AutoSimOA, has been created in order to estimate the mean and variance of output data. The main components of AutoSimOA ana-lyze and advise on the warm-up period and number of
rep-lications or run-length that should be used. It is currently being implemented into the Simul8 simulation software. ACKNOWLEDGEMENTS
This work was part of the Automating Simulation Output
Analysis (AutoSimOA) project (www.wbs.ac.uk/go/autosimoa) that was funded
by the UK Engineering and Physical Sciences Research Council (EP/D033640/1). The work was carried out in col-laboration with SIMUL8 Corporation, who also provided sponsorship for the project.
REFERENCES
Alexopoulos, C. 2006. A comprehensive review of meth-ods for simulation output analysis. Proceedings of the 2006 Winter Simulation Conference, p168-178 Chow YS, Robbins H. 1965. On the asymptotic theory of
fixed-width sequential confidence intervals for the mean. The Annals of Mathematical Statistics; 36: 457-462.
Conway, R.W. 1963. Some technical problems in digital simulation. Management Science, 10 (1), 47-61. Fishman,G.S. 1978. Grouping observation in digital
simu-lation. Management Science, 24 (5), 510-521.
Fishman,G.S 1998. LABATCH2: Software for statistical analysis of simulation sample path data. Proceedings of the Winter Simulation Conference, p131-139 Fox, B.L, Goldman D., Swain, J.J. 1991. Spaced batch
means. Operations Research Letters, 10,
Hoad, K, Robinson S, and Davies, R. 2008a. Automating warm-up length estimation. Part 1: Review of meth-ods and short-listing. Last revised July 2008, http://www2.warwick.ac.uk/fac/soc/wbs/projects/auto simoa/warmup/
Hoad, K, Robinson S, and Davies, R. 2008b. Automating warm-up length estimation. Part 2: MSER-5 – A full analysis. Last revised July 2008, http://www2.warwick.ac.uk/fac/soc/wbs/projects/auto simoa/warmup/
Hoad, K, Robinson S, and Davies, R. 2008c. Automating DES output analysis: How many replications to run.
Last revised July 2008, http://www2.warwick.ac.uk/fac/soc/wbs/projects/auto
simoa/replications/
Hoad, K, Robinson S, and Davies, R. 2009. Automating discrete event simulation output analysis – Automatic estimation of number of replications, warm-up period and run length. Last revised January 2009, http://www2.warwick.ac.uk/fac/soc/wbs/projects/auto simoa/overall_framework/
Hollocks, B.W. 2001. Discrete-Event Simulation: An In-quiry into User Practice. Simulation Practice and Theory, 8, pp. 451-471.
Lada, E. K., N. M. Steiger, and J. R. Wilson. 2008. SBatch: A spaced batch means procedure for steady-state si-mulation analysis. Journal of Sisi-mulation 2 (3): 170– 185
Law, A M. 2007. Simulation Modeling and Analysis, 4th ed. McGraw-Hill, New York.
Robinson, S. 2001. Soft with a Hard Centre: Discrete-Event Simulation in Facilitation. Journal of the Op-erational Research Society, 52 (No. 8), pp. 905-915 Robinson, S. 2004. Simulation: The Practice of Model
De-velopment and Use. Wiley, Chichester, UK.
Steiger, N. M., Lada E. K., Wilson, J. R., Joines, J. A., Alexopoulos, C. and Goldsman, D. 2005. ASAP3: A Batch Means procedure for steady-state simulation analysis. ACM transactions on modeling and com-puter simulation, vol 15, no.1, pages 39-73
White, K. P., Jr. 1997 An effective heuristic for bias reduc-tion in simulareduc-tion output. Simulareduc-tion, 69(6)323-334. White, K. P., M. J. Cobb, and S. C. Spratt. 2000. A
com-parison of five steady-state truncation heuristics for simulation. Proceedings of the Winter Simulation Conference 2000.
AUTHOR BIOGRAPHIES
KATHRYN A. HOAD is a Research/Teaching Fellow in the Operational Research and Management Sciences Group at Warwick Business School. Her email address is <[email protected]>
STEWART ROBINSON is a Professor of Operational Research at Warwick Business School, University of Warwick, in the ORMS group. His Web address is
<www.btinternet.com/~stewart.robinson1/sr.htm> and
email <[email protected]>
RUTH DAVIES is a Professor of Operational Research in Warwick Business School, University of Warwick, in the ORMS group. Her email address is [email protected]