Sensor-Based Organizational Design and Engineering
byDaniel Olgu´ın Olgu´ın
B.S. Electronics and Communications Engineering, Tecnol´ogico de Monterrey (2003) M.S. Electronic Systems Engineering, Tecnol´ogico de Monterrey (2005)
M.S. Media Arts and Sciences, Massachusetts Institute of Technology (2007) Submitted to the Program in Media Arts and Sciences,
School of Architecture and Planning,
in partial fulfillment of the requirements for the degree of Doctor of Philosophy in Media Arts and Sciences
at the
MASSACHUSETTS INSTITUTE OF TECHNOLOGY June 2011
c
Massachusetts Institute of Technology 2011. All rights reserved.
Author
Program in Media Arts and Sciences April 29, 2011
Certified by
Alex P. Pentland Toshiba Professor of Media Arts and Sciences Program in Media Arts and Sciences Thesis Supervisor
Accepted by
Mitchel Resnick LEGO Papert Professor of Learning Research Program in Media Arts and Sciences Academic Head
Sensor-Based Organizational Design and Engineering by
Daniel Olgu´ın Olgu´ın
Submitted to the Program in Media Arts and Sciences, School of Architecture and Planning,
on April 29, 2011, in partial fulfillment of the requirements for the degree of
Doctor of Philosophy in Media Arts and Sciences
Abstract
We propose a sensor-based organizational design and engineering approach that combines behavioral sensor data with other sources of information such as e-mail, surveys, and per-formance data in order to design interventions aimed at improving organizational outcomes. The proposed system combines sensor measurements, pattern recognition algorithms, simu-lation and optimization techniques, social network analysis, and feedback mechanisms that aim at continuously monitoring and improving individual and group performance. We de-scribe the system’s general specifications and discuss several studies that we conducted in different organizations using the sociometric badge experimental sensing platform. We have deployed such system under naturalistic settings in more than ten organizations up to this date. We show that it is possible to automatically capture group dynamics, and an-alyze the relationship between organizational behaviors and both subjective and objective outcomes (such as job satisfaction, quality of group interaction, stress, productivity, and group performance). We propose the use of static and dynamic simulation models of group behavior captured by sensors, in order to optimize group configurations that maximize indi-vidual and group outcomes, both in terms of job quality characteristics and organizational performance.
Thesis Supervisor: Alex P. Pentland
Sensor-Based Organizational Design and Engineering by
Daniel Olgu´ın Olgu´ın
The following people served as readers for this thesis:
Thesis Reader
Irving Wladawsky-Berger Strategic Advisor, Innovation and Technology IBM and Citigroup Visiting Lecturer, Sloan School of Management and ESD Massachusetts Institute of Technology
Thesis Reader
Peter A. Gloor Research Scientist, Center for Collective Intelligence Massachusetts Institute of Technology
Acknowledgments
I dedicate this thesis to my beloved family: Amparo, Daniel, Marisol, and Roberto.
I thank my parents Amparo and Daniel for their constant and unconditional love and support, my sister Marisol for her wise advice, and my dearest Roberto for being next to me throughout my journey at MIT and making it the best time of my life. I also thank him for painstakingly reading this dissertation.
I wish to express my greatest appreciation and deepest gratitude to my mentor “Sandy”, who gave me the chance to grow professionally and who offered me the rare opportunity to make his vision come into life.
Many thanks to my thesis readers Peter Gloor and Irving Wladawsky-Berger for their invaluable feedback. I also thank Prof. Rosalind Picard and Prof. Joe Paradiso for being a source of inspiration and learning.
Special thanks to my dear friends Taemie Kim and Ben Waber. Without their hard work none of this would have been possible. We made a great team and we all made it to the end together. I would also like to thank all the other members of the Human Dynamics group for their insightful comments and questions.
Finally, I thank the many collaborators from which this thesis benefited so much, in particular Koji Ara, Miki Hayakawa, Casper Lassenius, Tuomas Niinimaki, Per Lagerstrom, and Michelle Kam, as well as my UROPs Nathan Davis, Agustya Mehta, Erik Verlage, and Alejandro Hasfura for their important contributions to this work. Last but not least, I would like to acknowledge the MIT Media Lab and other sponsor companies for their financial support throughout my doctoral studies.
Contents
1 Introduction 17 1.1 Research Question . . . 18 1.2 Motivation . . . 18 1.3 Main Hypothesis . . . 19 1.4 Research Approach . . . 20 1.5 Outline . . . 212 Organizational Research Background 23 2.1 Organizational Design . . . 23
2.2 Organizational Engineering . . . 24
2.3 Organizational Intervention Theory . . . 25
2.3.1 Physical Environment . . . 26
2.3.2 Feedback Intervention Theory . . . 26
2.3.3 Continuous Change . . . 27
2.4 Organizational Performance . . . 28
3 Proposed Sensor-Based Organizational Design and Engineering Approach 29 3.1 Proposed System . . . 29
3.2 Environmental Sensors . . . 31
3.3 Wearable Sensors . . . 31
3.4 Database . . . 32
3.5 Feedback and Visualization Software . . . 33
4 Sensing Human Behavior and Social Interactions 35 4.1 Individual Behavior . . . 36 4.2 Group Behavior . . . 37 4.3 Social Signaling . . . 38 4.3.1 Physical Activity . . . 38 4.3.2 Speech Activity . . . 39 4.3.3 Face-to-face (f2f) Interaction . . . 41 4.3.4 Proximity . . . 41 4.3.5 Social Network . . . 41 4.4 Sociometric Badges . . . 42 4.4.1 Previous Work . . . 42 4.4.2 Lessons Learned . . . 48 4.4.3 System Requirements . . . 50 4.4.4 Hardware Architecture . . . 52
4.4.5 Firmware and Software Architectures . . . 53
5 Social Network Simulation and Optimization 59 5.1 Social Network Analysis . . . 59
5.2 Social Network Properties . . . 60
5.2.1 Degree Centrality and Prestige . . . 61
5.2.2 Closeness Centrality and Proximity Prestige . . . 62
5.2.3 Betweenness Centrality . . . 63
5.2.4 Status or Rank Prestige . . . 63
5.2.5 Eigenvector Centrality . . . 64
5.3 Social Network Simulation . . . 64
5.3.1 Agent-based Models . . . 65
5.3.2 N K Models . . . 66
5.3.3 Exponential Random Graph Models (ERGMs) . . . 68
5.3.4 Longitudinal Social Network Models . . . 68
5.4 Social Network Optimization . . . 70
5.5.1 Bootstrapping Regression Models . . . 71
5.5.2 Response Surface Methodology . . . 72
6 Experimental Results 75 6.1 Case Study 1: Retail Bank . . . 75
6.1.1 Introduction . . . 75 6.1.2 Background . . . 76 6.1.3 Hypotheses . . . 80 6.1.4 Experimental Setting . . . 82 6.1.5 Measures . . . 82 6.1.6 Analysis . . . 84 6.1.7 Findings . . . 84
6.1.8 Social Network Optimization . . . 88
6.1.9 Discussion . . . 91
6.1.10 Proposed Organizational Intervention . . . 93
6.2 Case Study 2: Hospital Post-Anesthesia Care Unit . . . 93
6.2.1 Introduction . . . 93 6.2.2 Background . . . 94 6.2.3 Hypotheses . . . 95 6.2.4 Experimental Setting . . . 95 6.2.5 Measures . . . 97 6.2.6 Findings . . . 97
6.2.7 Social Network Optimization . . . 102
6.2.8 Discussion . . . 104
6.2.9 Proposed Organizational Intervention . . . 106
6.3 Case Study 3: Call Center . . . 107
6.3.1 Introduction . . . 107
6.3.2 Hypotheses . . . 107
6.3.3 Experimental Setting . . . 108
6.3.4 Measures . . . 108
6.3.6 Findings . . . 109
6.3.7 Social Network Optimization . . . 109
6.3.8 Discussion . . . 111
6.3.9 Proposed Organizational Intervention . . . 112
7 Conclusions and Future Work 113 7.1 Contributions . . . 115
List of Figures
4-1 Hardware architecture block diagram . . . 54 4-2 Sociometric badge printed circuit board . . . 55 4-3 Sociometric badge evolution . . . 56
6-1 Contour plot displaying areas filled with constant colors between isolines for response variable y1 (performance) . . . 91
6-2 Contour plot displaying areas filled with constant colors between isolines for response variable y2 (stress level) . . . 92
6-3 Contour plot displaying areas filled with constant colors between isolines for response variable y1 (patient LOS) . . . 105
6-4 Contour plot displaying areas filled with constant colors between isolines for response variable y2 (nurses’ stress level) . . . 106
6-5 Contour plot displaying areas filled with constant colors between isolines for response variable y1 (AHT) . . . 111
6-6 Contour plot displaying areas filled with constant colors between isolines for response variable y2 (stress level) . . . 112
List of Tables
3.1 Sensors and measurements for wearable sensing device. . . 32
4.1 Sociometric badge comparison . . . 57
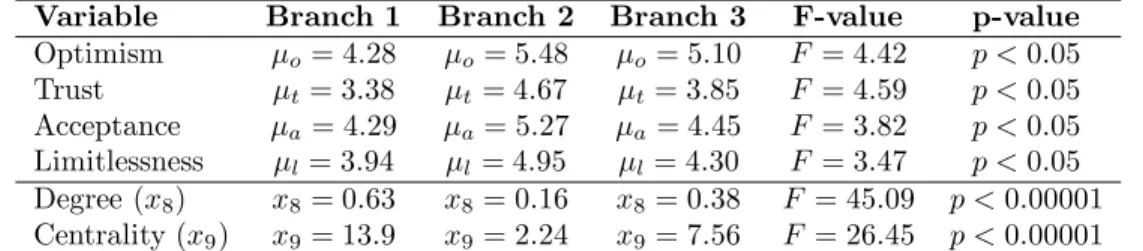
6.1 Significant differences across the three branches in terms of job attitudes and f2f social network features (ANOVA),N = 41 employees. . . 85 6.2 Model 1. Prediction of monthly sales for branches 1 and 3 using monthly f2f
social network features as predictor variables (R2= 0.68, adjustedR2= 0.46,
F = 3.12,∗=p <0.05,N = 21 employees). . . 85 6.3 Model 2. Prediction of monthly sales for branch 2 using monthly f2f social
network features as predictor variables (R2 = 0.72, adjusted R2 = 0.57,
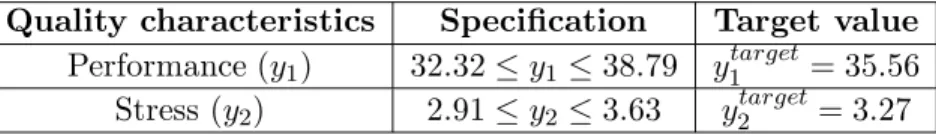
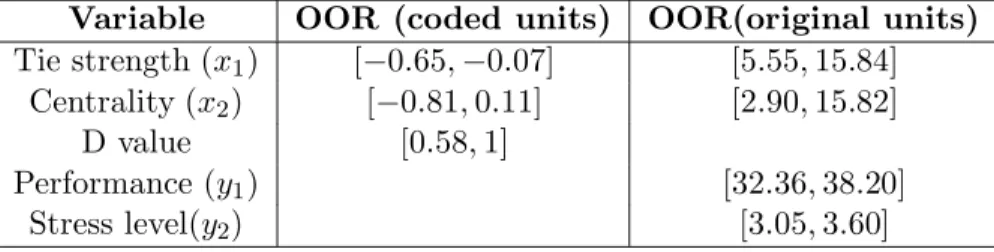
F = 4.61,∗=p <0.01,N = 23 employees). . . 86 6.4 Regression models for the individual number of monthly sales (N = 41) . . 87 6.5 Optimal quality characteristics . . . 88 6.6 Optimal operational regions (OOR) from simulation . . . 90 6.7 Per-minute sensor features . . . 98 6.8 Daily sensor features, whereh(k) = 1 ifF1(k)>1 (when wearing the badge),
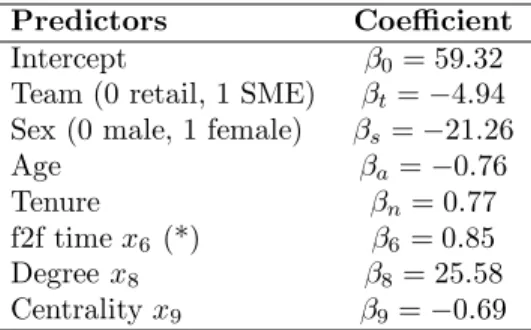
and h(k) = 0 if F1(k)≤1 (when not wearing the badge) . . . 99 6.9 Correlation coefficients between monthly badge features and personality traits.
∗=p <0.05,∗∗=p <0.01. . . 99 6.10 Group’s perception of workload (Q1) using badge features across subjects . 100 6.11 Group’s perception of difficulty to obtain information (Q2) using badge
6.12 Group’s perception of quality of group interaction (Q3) using badge features
across subjects . . . 101
6.13 Group’s perception of productivity (Q5) using badge features across subjects 101 6.14 Group’s perception of stress (Q6) using badge features across subjects . . . 101
6.15 Daily average LOS in minutes using badge features across subjects (p <0.005)102 6.16 Daily average number of delays (going out of the PACU) using badge features across subjects (p <0.05) . . . 102
6.17 Optimal quality characteristics . . . 103
6.18 Optimal operational regions (OOR) from simulation. . . 104
6.19 Optimal quality characteristics . . . 109
Chapter 1
Introduction
Recently, organizations have started mining data from e-mail, web pages, and other digital media for clues that will help them manage their knowledge-based systems in a more effec-tive way. Studies of office interactions indicate that as much as 80 percent of work time is sometimes spent in spoken conversation (Allen 1997), and that critical pieces of informa-tion are transmitted by word of mouth in a serendipitous fashion (Pentland et al. 2004). Fortunately, the data infrastructure for mining real-world interactions is already in place. Most working professionals already carry electronic badges and mobile phones that can be enhanced with a few sensors and computational power.
This capability can be an extraordinary resource for capturing interaction patterns and modeling group behavior. The technology ofReality Miningallows one to cluster people on the basis of profiles generated from an aggregate of conversation, e-mail, location, and web data (Eagle & Pentland 2005). This clustering, in turn, enables one to identify collaboration or the lack thereof. For instance, if the members of two groups working on similar tasks never talk face-to-face, this suggests that they are not coordinating their efforts.
By leveraging recent advances in human behavior sensing, pattern recognition, and social network analysis, computational models that simulate the effects of organizational disruptions in existing social networks can be built. One could, for example, predict the organizational effects of merging two departments. Such data-driven models help transcend the traditional organizational chart, allowing organizations to form groups on the basis of communication behavior rather than hierarchy. In previous work, we have shown that
active analysis of interactions within the workplace can radically improve the functioning of an organization. By aggregating this information, interpreting it in terms of work tasks, and modeling the dynamics of the interactions, a better understanding and management of complex organizations may be achieved.
In this thesis, we propose a sensor-based organizational design and engineering approach that combines sensor measurements, pattern recognition algorithms, simulation and opti-mization techniques, social network analysis, and feedback mechanisms that aim at contin-uously modeling and improving individual and group performance. We describe the specifi-cations for a sensor-based organizational engineering system and discuss preliminary studies that we have conducted in several organizations using such platform to study communica-tion patterns, task efficiency, productivity outcomes, and simulate optimal configuracommunica-tions of groups.
1.1
Research Question
How can behavioral sensor data be used to enhance organizational performance?
Organizational Data Mining (ODM) leverages data mining tools and techniques to en-hance the decision-making process by transforming data into valuable and actionable knowl-edge to gain a competitive advantage (Nemati & Barko 2004). Advances in ODM technology have helped organizations optimize internal resource allocations while better understanding and responding to the needs of their customers. By applying ODM techniques and simula-tion algorithms to behavioral sensor data, we will show that it is possible to recognize social patterns, infer relationships, model organizational dynamics, and enhance organizational performance.
1.2
Motivation
Human sensing refers to the use of sensors to capture human behavioral signals includ-ing facial expressions, body gestures, nonlinclud-inguistic vocalizations, and vocal intonations (Pantic et al. 2007). Context sensing also plays an important role in understanding
hu-man behavior. Its goal is to characterize the situation in which specific behaviors are displayed. There is a large body of research in context sensing using wearable and environ-mental sensors (Gellersen et al. 2002, Harter et al. 1999, Jones & Brown 2002, Mantyjarvi et al. 2004, Van Laerhoven et al. 2002). The ultimate goal of human and context sensing is to automatically interpret the sensed behavioral signals to understand and describe the observed behaviors.
Our research group has developed several tools for analyzing voice patterns and quan-tifying social context in human interaction, as well as several socially aware platforms that objectively measure different aspects of social context, including non-linguistic social sig-nals measured by a person’s tone of voice, movements or gestures. We have found that nonlinguistic social signals are particularly powerful for analyzing and predicting human behavior, sometimes exceeding even expert human capabilities (Pentland 2005).
To the best of our knowledge, however, organizational studies have not yet incorporated data from social interactions in the workplace collected using electronic sensors. We pro-pose the use of sensors capable of automatically identifying, quantifying and characterizing social interactions in order to incorporate this rich and untapped information (which was not possible to measure with such detail before) into formal organizational models. Our proposed approach augments traditional methods of gathering social interaction data such as surveys or ethnographic studies and incorporates behavioral sensor data into current Organizational Design and Engineering (ODE) practices.
1.3
Main Hypothesis
By combining behavioral sensor data with other information such as text documents, e-mail, surveys, and performance data; and using data mining and simulation techniques, it is possible to model human social behavior and enhance organizational performance.
In order to test this hypothesis, we developed a sensor-based organizational engineering system that uses wearable and environmental sensors to automatically quantify certain aspects of human social behavior such as non-linguistic social signals (contained in speech and body movement), face-to-face interaction, proximity and displacement.
1.4
Research Approach
Our goal is to design organizational interventions aimed at enhancing individual and group performance by applying a number of statistical analysis and simulation techniques to be-havioral sensor data. With this in mind, we have devised a sensor-based organizational de-sign and engineering approach to study the relationship between social de-signaling behavior, face-to-face communication patterns and social network characteristics, with organizational performance metrics such as task efficiency, productivity and job satisfaction. We have deployed our experimental research platform under naturalistic settings. Our approach is based upon the following propositions:
Proposition 1. Social signaling behavior and face-to-face interaction networks can be automatically captured using electronic sensors.
Proposition 2. Social signaling behavior is correlated with a variety of organizationally relevant outcomes such as performance and job satisfaction.
Proposition 3. Face-to-face interaction network characteristics are predictive of indi-vidual and group performance.
This approach to measure human behavior has several advantages over existing methods such as direct observation by humans, the use of pervasive cameras to videotape social interactions, or the use of surveys. Direct observation of humans by humans is expensive and limited to a few people per observer, and observers do not always agree. Deploying pervasive cameras is extremely expensive and their range of measurement is constrained to a particular place. The use of surveys is often subjective, inaccurate, and time consuming. In contrast, it would be a great advantage to be able to automatically capture the behavior of hundreds of people at the same time with unobtrusive sensors. The use of pervasive sensors allows us to study human behavior with unprecedented levels of detail. By capturing individual behaviors such as the amount of face-to-face interaction, speaking patterns, and non-linguistic social signals; and aggregating them at the group level, we show that it is possible to assess group performance and design organizational interventions aimed at improving organizational performance.
We present the results from several case studies where we have instrumented several participants with sociometric badges capable of measuring social signals (i.e. non-verbal
cues extracted from speech and body movement), face-to-face interaction, and physical proximity. Each of the case studies are different in nature due to the difficulty in obtaining access to organizational performance data and digital communication records, as well as the complexity involved in deploying an experimental research platform under naturalistic settings in real organizations. The data that were made available to us by each organization were also slightly different in nature, therefore each case study addresses one or more hy-potheses (specified in the corresponding sections) that support the abovementioned research propositions.
1.5
Outline
We begin chapter 2 with a brief review of organizational design and engineering theory. Next, we describe our proposed sensor-based organizational design and engineering ap-proach in chapter 3. In chapter 4, we present an overview of the technologies and method-ologies for sensing human behavior. In chapter 5, we describe the modeling and simulation techniques that were used to analyze the behavioral sensor data and optimize organizational performance. In chapter 6 we describe several case studies and discuss experimental results. Finally, we conclude and discuss further implications of the proposed approach in chapter 7.
Chapter 2
Organizational Research
Background
2.1
Organizational Design
The basic goal of organizational research is to study what kinds of organizational designs or structures are most effective in different situations, as well as to identify variables that enable researchers to make consistent and valid predictions of such organizational structures (Tushman & Nadler 1978).
Organizational behavior is the systematic study of the actions and attributes that peo-ple exhibit within organizations. It seeks to replace intuitive explanations with systematic study, that is, the use of scientific evidence gathered under controlled conditions and mea-sured and interpreted in a rigorous manner to attribute cause and effect (Robbins 2005). Analists of this field attempt to help managers understand people better so that productiv-ity improvements, customer satisfaction, and a better competitive position can be achieved through better management practices (Gibson et al. 2009).
A recent approach that brings together organization and information systems research and that focuses on building and deploying computer-based tools for organizational design was proposed by Magalh˜aes & Rito Silva (2009). They address the need to bring together the engineering and the design of organizations and define Organizational Design and En-gineering (ODE) as “the application of social science and computer science research and
practice to the study and implementation of new organizational designs, including the inte-grated structuring, modeling, development and deployment of artifacts and people”. They draw a parallel with the agile software development process and suggest a combination of short observation stage, where the relevant parts of the organization’s design are observed, followed by a rapid intervention design and deployment stage. This process would go on continuously as a sequence of short observation steps, followed by short intervention steps. This approach can be applied in sensor-based organizational design systems.
To understand how individual behavior affects performance, it is necessary to take into consideration several variables that directly influence individual behavior, such as abilities and skills, personality, perception, attitudes, values, and experience among others (Bowditch & Buono 2005). Behavior is also affected by a number of environmental variables such as the organizational structure, policies and rules, resources, and job design. While the individual variables are most likely fixed and do not change much over time, the environmental vari-ables can be continuously manipulated in order to modify individual behavior and promote a desired outcome.
2.2
Organizational Engineering
Research in organizational theory and organizational behavior has contributed to the cre-ation of a new field known as organizcre-ational engineering, whose focus is:
“...to increase the efficiency, productivity, communication, and coordination of groups of people. These may include teams, departments, divisions, commit-tees and many other forms of goal directed organizations. Focusing on how relationships and information are structured allows groups to be engineered to produce superior results on a consistent basis” (Organizational-Engineering-Institute 2007).
Tourish & Hargie (2009) argue that modern research on organizational communication must turn its efforts to exploring the in-situ, moment-to-moment, everyday communication practices of organization members. This means extending communication research beyond
self-report techniques that rarely capture the full complexities of observed behavior in real-world organizations.
There exist several relatively disconnected perspectives within the field of organizational engineering (Castro Melo Godinho de Matos 2007): (i) Business Engineering is concerned with automation, elimination of bureaucracy, simplification of work flows, refinement of in-formation infrastructure, and elimination of unnecessary work (Martin 1995); (ii) Enterprise Architecture is concerned with the role that information technology plays in organizations and with the adaptation that most enterprises have to face in order to remain competi-tive in the process of change (Winter & Fisher 2007); (iii) Language Action Perspeccompeti-tive sees communication as a form of action and considers that people act through language (Dietz 2002, Reijswound & Lind 1998, Winograd 1986); and (iv) Computational Organiza-tion Theory studies organizaOrganiza-tions as computaOrganiza-tional entities (Carley 1995).
The work of Carley (2002) at Carnegie Melon University is particularly relevant to the design of organizational engineering systems. She has proposed that the same techniques used to engineer a product to meet some set of specifications can be applied to organizations and that it should be possible to design an organization, group, or team, so that it is “optimal” given some set of criteria (Carley & Kamneva 2004). Her research group has focused on several computational simulation tools for organizational design: (i) agent-based models that simulate the behaviors of the actors who make up a social system, and where the behavior of the social system is not modeled directly, rather the systems behavior emerges from the interaction of its agents; (ii) systems dynamics models that focus on modeling the behavior of the system as a whole; and (iii) cellular automata models for studying local interactions (Harrison et al. 2007). We believe this approach could be complemented with sensor data from social interactions in order to initialize simulation parameters and solve optimization problems.
2.3
Organizational Intervention Theory
Cummings & Worley (2009) define Organizational Development as “a process that applies a broad range of behavioral-science knowledge and practices to help organizations build their
capacity to change and to achieve greater effectiveness, including increased financial per-formance, customer satisfaction, and organization member engagement”. Organizational interventions are change processes that imply an intentional entry into an ongoing system of relationships (Rothwell et al. 2010). There are many possible ways to engineer organiza-tional interventions, therefore we will only describe some background theory related to the proposed interventions that are presented in chapter 6.
2.3.1 Physical Environment
Proximity among people within an organization is known to exert considerable influence on face-to-face communication, coordination, balance of members’ contribution, mutual support, effort, and cohesion (Hoegl & Proserpio 2004). The seminal work of Allen (1971) uses a dyadic measure of physical distance in terms of feet or meters that refers to pairs of physical locations that do not vary in reciprocal distance over time. Monge et al. (1985) define organizational proximity as “the extent to which people in an organization share the same physical locations at the same time providing an opportunity or psychological obligation to engage in face-to-face communication”. They observed daily variations in organizational proximity as well as day-to-day regularities by asking employees from a software systems firm to indicate, in 15-minute intervals, where they spent their time during all five days of a typical work week. Their research suggests that the expected level of organizational proximity at any point in time and the patterns across time is a function of the nature of the physical facilities, the nature of the work, and the reporting relations. Several organizational interventions that rely on the modification of the physical environment to promote face-to-face interaction in the workplace (e.g. office layout redesign and office renovation) have been studied (Heubach et al. 1995, Shpuza 2006, Zagenczyk et al. 2007).
2.3.2 Feedback Intervention Theory
According to Alder (2007), performance feedback has been a topic of interest to organiza-tional behavior and organizaorganiza-tional-psychology researchers for over a century due to the fact that feedback affects numerous organizationally-relevant outcomes such as employees’ job motivation, satisfaction, absenteeism and turnover. Kluger & DeNisi (1998) proposed the
first comprehensive theory of feedback. Their Feedback Intervention Theory (FIT) states that behavior is regulated by comparisons to standards or goals and that feedback inter-ventions affect behavior by changing individuals’ locus of attention. Alder (2007) examined the effect of Computer Performance Monitoring (CPM)-based feedback on individual’s task performance and found that allowing participants to control the amount and frequency of feedback they received enhanced their desire to respond to their feedback with improved performance.
Coaching can help individual learning and development. Individual feedback may help to understand the effects of one’s own behavior on others. Individual feedback can take many forms, such as personal feedback, norm-based assessments, surveys, 360◦ feedback, and
tests (Boonstra 2004). Recent research on real-time feedback interventions has shown that it is possible to modify group’s behavior by displaying information about group interaction dynamics in real time (DiMicco et al. 2004, Kim & Pentland 2009). Laboratory study results show that sociometric feedback helps groups achieve higher interactivity levels and better communication (Kim et al. 2008). In a recent study, Kim et al. (2010) found that when given feedback on their communication patterns, individuals became more cooperative, increasing the overall performance of the group. These results suggest that real-time sociometric feedback can indeed change group dynamics and enhance group performance.
2.3.3 Continuous Change
There are two different kinds of organizational change: “episodic change”, which is dis-continuous and intermittent; and “dis-continuous change”, which is ongoing, evolving and incremental (Weick & Quinn 2004). The distinctive quality of continuous change is the idea that small continuous adjustments, created simultaneously across units, can cumulate and create substantial change.
One focal point of organizational development is organizational culture change (Rothwell et al. 2010). Intervention methods based on culture are mainly in the form of large-scale training and communication programs. According to Boonstra (2004), the first step in cul-tural change is to assess the organizational culture by using survey feedback or by bringing groups together to identify values and underlying assumptions. The next step is to identify
cultural assumptions that aid to or prevent from getting to shared goals. After a reflective diagnosis, an action plan is developed to determine what steps might be appropriate. Fi-nally, the execution of the action plan is monitored by members of the organization with the help of a facilitator. Culture change is a continuous change process.
2.4
Organizational Performance
Organizational performance cannot be measured using a single method or metric. There are many different ways of interpreting, defining and assessing organizational performance, as well as a wide range of stake-holders involved. Richard et al. (2008) make a distinction between “organizational performance” and “organizational effectiveness”:
Organizational performance encompasses three specific areas of firm out-comes: (1) financial performance (profits, return on assets, return on investment, etc.); (2) market performance (sales, market share, etc.); and (3) shareholder return (total shareholder return, economic value added, etc.).
Organizational effectiveness is broader and captures organizational perfor-mance plus the plethora of internal perforperfor-mance outcomes normally associated with more efficient or effective operations and other external measures that relate to considerations that are broader than those simply associated with economic valuation.
In this thesis we use both subjective and objective measures of individual and group performance related to both organizational performance and organizational effectiveness. Business firms are usually compared in terms of profits, sales, market share, productivity, debt ratios, and stock prices. Hospitals use cost of recovery time, mortality rates, and occupancy rates. Universities use research productivity, faculty prestige, test scores of stu-dents, and rankings by popular magazines (March & Sutton 1997). Chapter 3 describes our proposed approach, and we argue that it can be applied to multiple performance measures as it will be shown in chapter 6.
Chapter 3
Proposed Sensor-Based
Organizational Design and
Engineering Approach
3.1
Proposed System
We have developed a set of tools and methods to automatically capture, measure, and analyze human behavior in organizational settings in order to improve performance and optimize organizational structures and decisions, e.g. office layout, team formation, and organizational structure (Olgu´ın-Olgu´ın, Waber, Kim, Mohan, Ara & Pentland 2009). Our goal is to be able to map behavioral patterns to quantifiable outcomes and provide employees and managers with feedback that allows them to adjust their behavior in order to optimize a desired outcome. Our proposed approach includes the following steps:
1. Capturing the interactions and social behavior of employees, managers and customers using wearable and/or environmental sensors. Other sources of information that can be incorporated into the system are any form of digital records (e.g. e-mail, chat, phone logs).
2. Performing data mining and pattern recognition to extract meaningful information from these data.
3. Combining the extracted information with performance data (e.g. sales, tasks, timing) and finding relationships between objective measurements and performance outcomes.
4. Behavior modeling and simulation.
5. Organizational intervention design.
6. Intervention implementation by means of generating feedback in the form of graphs, interactive visualizations, reports, or real-time audio-visual feedback for employees, managers and/or customers.
7. Continuous measurement and performance assessment.
A sensor-based system for organizational design consists of environmental and wearable sensors, computers, and software that continuously and automatically measure individual and collective patterns of behavior, identifies organizational structures, quantifies group dynamics, and provides feedback to its users. The purpose of such system is to improve productivity, efficiency, and/or communication patterns within an organization. The pro-posed system is compro-posed of one or more wearable sensing devices functioning in a wireless sensor network, one or more radio base stations, a computer system, and several data processing algorithms. The system may include some of the following:
• Environmental sensors that monitor the current conditions of the workplace (temper-ature, light, movement, activity, sound, video, etc.).
• Wearable sensors that employees carry around and that measure human behavior (social interaction, activities, location, etc.). These can be mobile devices such as cell phones, PDAs, or electronic badges that collect data, communicate with a database (via Ethernet or wirelessly) to retrieve information, and provide feedback to their users.
• Software that automatically identifies relevant keywords in documents, web pages, e-mail, and instant messaging communication.
• A database that stores all the information collected by the environmental, wearable and software sensors (who-knows-what, who-knows-who, and where-is-who).
• Simulation and data mining algorithms.
• Feedback and visualization mechanisms.
3.2
Environmental Sensors
In addition to the wearable sensors, base stations can be placed in fixed locations inside a building in order to track the location of interaction events as well as subjects. A central computer can be used for data collection. Data from the wearable sensors is transferred wirelessly to the base stations and then uploaded to a server. The base stations may contain environmental sensors (temperature, light, sound, movement, activity, etc.) that capture the current conditions in an office environment, such as the number of people walking by, ambient noise, temperature and lighting conditions.
3.3
Wearable Sensors
Wearable sensing devices may include electronic badges, mobile phones, wrist-mounted de-vices, head-mounted dede-vices, and electronic textiles, among others. These wearable devices could function as self-contained monitoring devices or communicate with each other and with fixed radio base stations in a wireless sensor network. The wearable sensing devices should have a small form factor, be comfortable to wear over long periods of time, and have a long battery life. A behavioral wearable sensor should be able to:
• Recognize common daily human activities (such as sitting, standing, walking, and running) in real time.
• Extract speech features in real time to capture non-linguistic social signals such as interest and excitement, and unconscious back-and-forth interjections, while ignoring the words in order to assuage privacy concerns.
• Communicate with base stations over radio and measure the radio signal strength (to estimate proximity and location).
• Perform indoor user localization by measuring received signal strength and imple-menting triangulation algorithms.
• Capture face-to-face interactions.
The wearable sensing device may include one or more of the following modules:
Table 3.1: Sensors and measurements for wearable sensing device.
Module Sensors Measurements
Audio Electret or MEMS-type
micro-phone.
Speech detection and segmen-tation, speaking time, speech features (e.g. energy, pitch, speaking rate, etc.), non-linguistic signals (e.g. activ-ity, consistency, mirroring, in-fluence).
Motion Accelerometers, inclinometers,
gyroscopes, piezoelectric vi-bration sensors.
Body movement detection, body energy level, body pos-tures and physical activities. Face-to-face interaction Infrared transceivers, CMOS
cameras.
Time spent in face-to-face in-teractions.
Proximity Ultrasonic sensors, sonar, ra-dio transceivers (e.g. ZigBee, WiFi, Bluetooth).
Proximity to other people and base stations (from radio sig-nal strength).
Location Radio transceivers (e.g.
Zig-Bee, WiFi, Bluetooth).
Triangulation (using radio sig-nal strength).
Input interface Buttons, keyboard, touch-screen, haptic interface
Output interface Speaker, LCD, light emitting diodes.
Memory Flash, RAM, SD card
inter-face.
Processor Micro-controller / DSP.
Power Battery and power
manage-ment circuitry.
3.4
Database
A database containing individual attributes (values, attitudes, self-concept, abilities, person-ality, job satisfaction, etc.); sociometric data captured from sensors (speaking state, speak-ing style, motion state, location, face-to-face interaction, proximity, etc.); group attributes
(team assignment, communication frequency, social network features derived from the so-ciometric data); and performance data (projects or tasks, completion time, success/failure, resources, follow-ups, etc.) from each person in an organization must be maintained in order to manage the vast amounts of information generated by the system. Database soft-ware includes: MySQL, Microsoft SQL Server, Oracle, and IBM DB2. Analysis softsoft-ware includes: Matlab, Microsoft Visual Studio, UCINET, among others.
3.5
Feedback and Visualization Software
By aggregating information from sensor data, interpreting it, and modeling the dynam-ics of human interactions, one can create sensor-based feedback systems that help better understand and manage complex organizations. Performance dashboards are becoming in-creasingly popular, but how to structure this feedback, particularly when it comes from sensor data, is an unanswered question. Feedback on group dynamics has been proven to help with the performance of small group collaboration (Kim & Pentland 2009). Kim et al. (2009) have proposed a system to detect group dynamics and provide feedback according to a group’s goals. By synchronizing multiple wearers’ sociometric data, it is possible get information such as turn-taking, influence, body movement mimicry, and similarities in be-havior. This information is then visualized in order to provide real-time feedback on group dynamics.
3.6
Organizational Re-engineering Process
Once the system has been put in place and sociometric data has been collected, the following steps would constitute an organizational re-engineering cycle:
1. Access personal attributes, sociometric data, and performance data.
2. Apply data mining and data processing algorithms.
3. Find relationship between desired/undesired performance outcomes and sociometric data.
4. Find relationship between personal attributes and sociometric data.
5. Set individual and group performance goals.
6. Design and perform an organizational intervention.
7. Provide users with feedback in order to induce behavioral changes and achieve the desired goals.
8. Deploy the data collection system again. If the performance goals have not been reached, predict future performance outcomes based on the sociometric data, and start organizational re-engineering cycle again.
We envision short cycles of measurement-feedback-intervention-measurement until sig-nificant improvements have been reached. The first measurement phase may last a few weeks or up to a few months. The feedback phase can happen in real time (while socio-metric data is being collected), or after the first measurement phase. Interventions have to be implemented soon after the feedback phase and the second measurement phase has to be carried out a few weeks after the intervention has been put into practice. The second measurement phase is confirmatory step and the entire cycle can be repeated again.
Chapter 4
Sensing Human Behavior and
Social Interactions
To date, research on human interactions has relied mainly on one-time, self-reported data on relationships. New technologies, such as video surveillance, e-mail, and mobile phones, offer an uninterrupted stream of interaction data over extended periods of time, providing information about both the structure and content of relationships. This has given rise to the emerging field of “Computational Social Science” that leverages the capacity to collect and analyze data with an unprecedented breadth and scale (Lazer et al. 2009). Vast amounts of data are created everyday from the use of personal electronic devices such as mobile phones and RFID cards. This calls for the use of pattern recognition and data mining techniques to uncover hidden structures of human behavior and social interactions.
In this section we present an overview of the state of the art in individual behavior recognition from sensor data including motor activities and social signaling behavior. We then move on to discuss the latest developments in group behavior recognition, such as face-to-face interaction, conversation detection and conversation dynamics. We also present a brief overview of pattern recognition methods in social network analysis for the automatic identification of groups and the study of social network evolution.
4.1
Individual Behavior
We are interested in recognizing human behavior from sensor data at the individual and group levels, as well as combining pattern recognition methods with dynamic social network analysis, with the goal of creating a general framework for modeling group dynamics.
At the individual level, several researchers have applied pattern recognition methods to sensor data that capture different aspects of human behavior such as primitive motor activities, e.g. standing, walking, running, etc. (Kern & Schiele 2003, Lee & Mase 2002, Mantyjarvi et al. 2001, Van Laerhoven & Cakmakci 2000); as well as complex or high-level activities, e.g. working on computer, having a phone conversation, etc. (Bao & Intille 2004); and body posture, facial expressions, hand gestures, and displacement patterns (e.g. location tracking).
Another aspect of individual behavior is the unconscious or “honest” signaling dis-played during social interactions. According to Pentland (2008), these honest signals can be measured by analyzing the timing, energy, and variability of speech and body move-ment patterns. He describes four different types of honest signals in humans: influence (the extent to which one person causes the other person’s pattern of speaking to match their own pattern), mimicry (the reflexive copying of one person by another during a conversa-tion), activity (speaking time and energy), and consistency (low variability in the speech signal). The pattern of signaling behavior and social roles largely determines the pattern of communication within an organization. Consequently, the dynamics of group interaction can be inferred from the pattern of communication. For instance, dominant, high-influence individuals cause the pattern of communication to flow through them, making them more central in the organization.
Dong et al. (n.d.) use an “influence model” to represent the group discussion dynamics as interacting stochastic processes, in which each participant is represented by a single process. Their method identifies the different functional roles that the participants take at each time in a group discussion and evaluates the discussion efficiency within the framework of the stochastic process.
4.2
Group Behavior
At the group level, we are interested in automatically identifying face-to-face interactions, conversations, and conversation dynamics. Studies have shown that hand-coded analyses of communication in teams can predict performance (Foltz & Martin 2009). These studies have looked at the frequency, patterns and content of communication. For instance, an analysis of the communication patterns of air-crews in flight simulation experiments revealed significant differences between successful and unsuccessful crews (Bowers et al. 1998). In some cases, high-performing teams communicate with higher overall frequency than low-performing teams, but in other cases, this finding has not been supported.
According to Foltz & Martin (2009), to develop a human performance model, one needs to find out if, and the degree to which, a relationship between communication and perfor-mance exists. Computational models must accurately measure features in communication that relate to measures of team performance. To create such model, recent advances in the fields of computational cognitive models (e.g. latent semantic analysis, or LSA, so-cial network analysis, and pattern recognition techniques (e.g. clustering, classification, generalization) can be leveraged.
More recently, there has been increasing interest on modeling more complex patterns of behavior over extended periods of time. Oliver et al. (2004) proposed the use of Layered Hidden Markov Models (LHMMs) to classify different office activities (e.g. phone conver-sation, face-to-face converconver-sation, distant converconver-sation, presentation, etc.). In their model, there is a hierarchy with multiple HMMs, each corresponding to a certain concept (for ex-ample, audio signals). These HMMs take as observations either the features computed from the raw signals or the inferential results from the previous level. In LHMMs, each layer of the architecture is connected to the next layer via its inferential results.
Gatica-Perez (2006) discusses some work on automatic analysis of face-to-face multi-party conversations from multi-sensory data that has appeared in the literature spread over several communities, including signal processing, computer vision, multi-modal processing, machine learning, human-computer interaction, and ubiquitous computing. The author proposes a categorization of conversational group activities on the basis of temporal scale and group size. The proposed categories are: addressing (e.g., who speaks to whom at
every time), turn-taking patterns (e.g. floor control, discussions, monologues), and group trends (e.g. interest levels, dominance, and influence). Gatica-Perez (2009) later extended his review to more than a hundred different works addressing the computational model-ing of interaction management, internal states, personality traits, and social relationships in small group conversations. His review focuses on small groups, non-verbal behavior, computational models, and face-to-face conversations.
4.3
Social Signaling
As argued before, honest signals are unconscious indicators displayed during social inter-actions. People display combinations of honest signals when they assume different social roles such as: exploring, listening, teaming, and leading. For instance, the social role of exploring combines low consistency and high activity. The role of active listening displays low consistency and low activity. The teaming role requires a combination of high influ-ence, high mimicry, and high consistency. When adopting the role of leading there is high levels of influence, high activity, and high consistency. The pattern of signaling behavior and social roles largely determines the pattern of communication within an organization. Consequently, the dynamics of group interaction can be inferred from the pattern of com-munication.
In this section we describe the social signals that we implemented and used in the case studies discussed in chapter 6.
4.3.1 Physical Activity
A 3-axis accelerometer signal should be sampled atfs≥30 Hz in order to capture the range
of human movement since 99% of the acceleration power during daily human activities is contained below 15 Hz (Mathie et al. 2004). The acceleration signal vector magnitude (|~a0
i|)
provides a measure of the degree of movement intensity that includes the effect of signal variations in the three axes of acceleration (Karantonis et al. 2006). |~a0
i| is calculated on
|~a0i|= q a02 xi +a 02 yi+a 02 zi (4.1)
The mean accelerometer signal magnitude is indicative of an individual’s “physical ac-tivity level” and is calculated as follows:
F1(k) = 1 fsT fsT k X i=1+fsT(k−1) |~a0i| (4.2)
whereT = 60 seconds, fsis the accelerometer sampling frequency, andkis thekth minute.
The standard deviation of the accelerometer signal magnitude is calculated as follows:
F2(k) = v u u u t 1 fsT fsT k X i=1+fsT(k−1) [|~a0 i| −F1(k)]2 (4.3)
This feature is indicative of an individual’s “consistency of body movement” (1−F2(k)). The signal power or energy per minute is calculated as follows:
F3(k) = 1 fsT fsT k X i=1+fsT(k−1) |~a0i|2 (4.4) 4.3.2 Speech Activity
The speech signal must be sampled at fs≥8000 Hz since the voice frequency band ranges
from 300 to 3400 Hz approximately. The voiced speech of a typical adult male has a fundamental frequency between 85 and 155 Hz, and that of a typical adult female between 165 and 255 Hz. (Baken 1987). Several speech enhancement and speech recognition front-end systems based on band-pass filter banks have been shown to be effective in detecting speech (Ellis et al. 2002, Mouchtaris et al. 2005). A band-pass filter bank that divides the speech frequency spectrum [85,4000] Hz into four (or more) frequency bands (e.g. f1 from
85 to 222 Hz,f2 from 222 to 583 Hz, f3from 583 to 1527 Hz, andf4 from 1527 to 4000 Hz)
can be used to detect speech.
We can compute the speech volume modulation from the output of filter 1, since that is where the majority of the speaking energy resides:
v(i) =|(f1(i) +f1(i−1))−(f1(i−2) +f1(i−3))| (4.5)
FeatureF4(k) (mean volume modulation per minute, or “speech activity”) is then ob-tained as: F4(k) = 1 fsT fsT k X i=1+fsT(k−1) v(i) (4.6)
The standard deviation of volume modulation per minute is calculated as:
F5(k) = v u u u t 1 fsT fsT k X i=1+fsT(k−1) [v(i)−F4(k)]2 (4.7)
“Speech consistency” can then be calculated as 1−F5(k). The amount of speaking time per minute is simply calculated by counting the number of samples in one minute where the volume modulation isv(i)>0:
F6(k) = 1 fsT fsT k X i=1+fsT(k−1) v(i)h(i) (4.8)
whereh(i) is the step function:
h(i) = 1 ifv(i)>0 (speaking) 0 ifv(i) = 0 (not speaking)
An experimental threshold value for each of the band-pass filters can be determined in order to detect voiced and unvoiced speech. These threshold values can be coded using a bit mask and the amount of voiced speech per minute can be obtained as:
F7(k) = 1 fsT fsT k X i=1+fsT(k−1) v(i)b(i) (4.9)
4.3.3 Face-to-face (f2f) Interaction
Infrared (IR) transmissions can be used as a proxy for the detection of face-to-face interac-tion between people (Choudhury & Pentland 2003). In order for one person to be detected through IR, two IR transceivers must have a direct line of sight and the receiving sensor must be within the transmitter’s IR signal cone of heighthand radius r≤htanθ.
We define the amount of face-to-face interactionF8(k) as the total number of IR
detec-tions per minute divided by the IR transmission rate (T Rir). Feature F9(k) is simply the
number of different IDs detected every minute.
4.3.4 Proximity
The Radio Signal Strength Indicator (RSSI) is a measure of the signal strength between transmitting and receiving devices. An average threshold can be determined experimentally in order to detect when two people are in close proximity to each other by collecting RSSI measurements over an extended period of time under different environmental conditions. The time spent in close proximity to another person F10(k) is calculated by dividing the
number of radio packets with RSSI >RSSIth by the radio transmission rate (T Rradio).
4.3.5 Social Network
Social network attributes can be calculated using the number of IR and radio detections as the link strength between two actors. We have used conventional social network analysis as described by Wasserman & Faust (2005). In particular, we have used individual and group degree and betweenness centrality as well as contribution index (Gloor et al. 2003). Betweenness centrality is a measure of power and influence within a group. Degree centrality measures the number of direct interaction partners. Contribution index measures how much of a sender or a receiver within a group somebody is.
4.4
Sociometric Badges
4.4.1 Previous WorkThe first electronic ID badge was developed at Xerox PARC as a solution to the problem of efficient location and coordination of staff in large organizations (Want et al. 1992). The electronic tag was designed as anActive Badgethat emitted a unique code every 15 seconds. These signals were then picked up by other infrared sensors placed around a building. The size of the badge was roughly 55 x 55 x 7 mm and weighted 40 g. The design of this first badge was very simple: it consisted of a commercial remote controller encoder, an infrared emitter driver, a timing circuit, and a test button.
More complex badge platforms have been developed after the Active Badge. In 1996, the Thinking Tags (Borovoy et al. 1996) were the first computationally augmented name tags that were capable of displaying how much two people at a conference or meeting had in common, simply by lighting LEDs of different colors depending on how many questions the participants had previously answered the same. Two years later they evolved into the so-called Meme Tags(Borovoy et al. 1998), allowing conference participants to electronically share brief ideas or opinions through a large LCD screen. This system further evolved into thenTAG System, a commercial system to improve, measure, and automate meetings and events (Ntag Interactiven.d.).
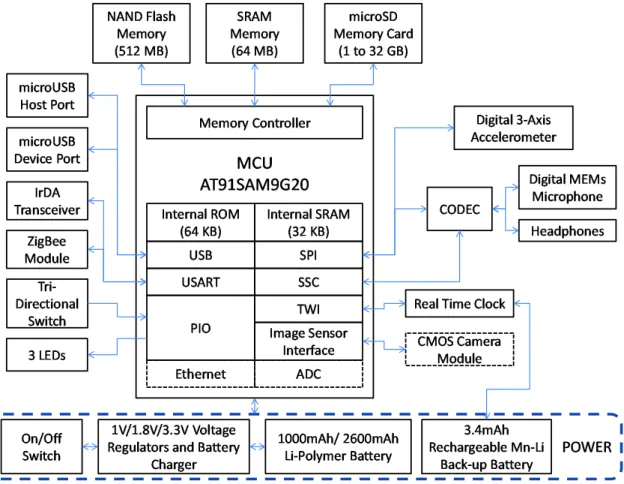
The Wearable Sensor Badge developed at Philips Research Labs in 1999 (Farringdon et al. 1999) was capable of detecting simple pre-ambulatory activities using an accelerom-eter. The iBadge (Park et al. 2002) was designed to be worn by children to capture in-teractions with teachers and common classroom objects. The UbER Badge developed at the MIT Media Laboratory in 2006 was a research platform for facilitating interaction in large professional or social events (Laibowitz et al. 2006). These badges were equipped with a large LED display, wireless infrared and radio frequency networking, and a host of other sensors used to develop features and algorithms aimed at classifying and predicting individual and group behavior (Paradiso et al. 2010). It measures 110 x 120 x 20 mm and weighs 170 grams.
contin-ually growing and adapting multimedia diary was developed at the MIT Media Laboratory (Blum et al. 2006). It used patterns in sensor readings from a camera, microphone, and accelerometers to classify the user’s activities and automatically collect multimedia clips when the user was in an interesting situation. Microsoft Research developed SenseCam, a sensor augmented wearable still camera designed to compile a digital record of the user’s day, by recording a series of images and capturing a log of sensor data without user inter-vention (Hodges 2006). It was built around a PIC micro-controller and contained several sensors such as a VGA camera module, a 3-axis digital accelerometer, a temperature sensor, a passive IR sensor, audio recording, and a standard SD card. It has been used in several memory recall research projects since then.
The Mobile Sensing Platform (MSP) 2.0, developed at Intel Research in 2008, is a wearable device specifically designed for embedded activity recognition and context aware applications (Choudhury 2008). It is based on Intel’s iMote2 board containing one XScale processor and one ATMega128 micro-controller, measures 60 x 60 x 50 mm, and weighs 115 g. It was designed to be worn with a belt clip. This device includes several sensors such as an electret microphone, a light sensor, a 3-axis digital accelerometer, a digital barometer, and a digital temperature sensor, among others. One featured application was for on-body sensing, real-time activity inference, and a mobile ambient display to encourage individuals to be physically active.
The first sociometric sensor developed at the MIT Media Laboratory was called the
SocioMeter. It was a wearable sensor package designed to measure face-to-face interactions between people with an IR transceiver, a microphone, and two accelerometers (Choudhury 2004). These early prototypes were used in a group study involving 25 participants wearing the badges for two weeks. The low-level sensor data were used to learn and model the structure and dynamics of the social network (e.g. who was talking to whom and how someone’s turn-taking patterns influenced the other person’s interaction style) (Choudhury 2004). However, due to its size and weight, users reported feeling somewhat uncomfortable while wearing it.
In order to test our proposed system, we developed the Sociometric Badges, wearable electronic sensors capable of detecting face-to-face interactions, conversations, body
move-ment, and proximity to others (Olgu´ın-Olgu´ın 2007). The sociometric badges are capable of extracting speech features without recording the content of conversations (in order to preserve privacy), and of wirelessly transferring data to a central server. We have used them in several organizations to capture face-to-face communication patterns and study the relationship between collective behavior and performance outcomes, such as produc-tivity and job satisfaction (Olgu´ın-Olgu´ın, Gloor & Pentland 2009, Olgu´ın-Olgu´ın, Waber, Kim, Mohan, Ara & Pentland 2009, Wu et al. 2008).
The design of the sociometric badges was motivated by the fact that a large number of organizations already require employees to wear RFID name tags that identify them and grant them access to several locations and resources. These traditional RFID name tags are usually worn around the neck or clipped to the users clothing. With the rapid miniaturization of electronics, it is now possible to augment RFID badges with more sensors and computational power that allow measuring human behavior without requiring any additional effort on the user’s side. By capturing individual and collective patterns of human behavior with sociometric badges and correlating these behaviors with individual and group performance, it is possible to identify successful vs. unsuccessful teams, high performing teams, and predict group outcomes. The added value for the users is the feedback that they can receive about their daily behaviors and interactions with others, and how these behaviors affect their individual and group performance.
The following is a list of some of the social signals that have been implemented for the sociometric badges:
1. Body movement activity. Minute-by-minute body energy (motion sensor).
2. Consistency of body movement. Negatively proportional to the minute-by-minute variation in body energy (motion sensor).
3. Speech activity. Minute-by-minute speech energy (microphone).
4. Consistency of speech. Negatively proportional to the minute-by-minute variation in speech energy (microphone).
6. Other speech features such as mirroring and turn-taking patterns (microphone).
7. Face-to-face (f2f) time. Minute-by-minute number of infrared detections divided by the maximum transmission rate (infrared sensor).
8. Proximity time. Minute-by-minute number of radio detections divided by the max-imum transmission rate and minute-by-minute average radio signal strength (radio transceiver).
9. Degree. Number of different participants with whom there was face-to-face interac-tion, normalized by the maximum number of participants (calculated from the f2f network).
10. Centrality. It indicates to what extent an actor has a central position in the organi-zation (calculated from the f2f network).
11. Cohesion. It is a measure of how well connected an actor’s acquaintances are connected to each other.
We have manufactured several hundred sociometric badges and used them in organiza-tions to automatically measure individual and collective patterns of behavior, and help or-ganizations maximize their groups’ performance through specialized software that analyses behavioral patterns and generates automatic feedback reports and dynamic visualizations. It is possible to design organizational interventions based on these measurements and feed-back mechanisms. In the following section we discuss four different case studies and several proposed organizational interventions.
Based on the first version of the badges and with some major hardware and firmware improvements, a second version of the badges was designed (Olgu´ın-Olgu´ın 2007). More than 600 prototypes were built and used under naturalistic and laboratory settings in several research projects that we will briefly describe next:
• Face-to-face communication vs. e-mail. We instrumented a group of 22 employ-ees of a marketing division in a German bank for 20 working days (Olgu´ın-Olgu´ın, Waber, Kim, Mohan, Ara & Pentland 2009). Face-to-face communication patterns
were compared with e-mail exchange patterns. Based on our findings we suggested as a possible intervention to modify the employees’ team configuration and seating arrangement in order to minimize the physical distance among members of each team, as well as the distance between teams that interacted the most. This would ideally promote more face-to-face interaction and reduce the amount of e-mail, resulting in less communication overload.
• Task performance. Sociometric badges were deployed for 20 working days at a Chicago-area data server configuration firm that consisted of 28 employees (Waber et al. 2008). The analysis examined employee behavior at the task level rather than at the individual level. Results indicate that there are behavioral clusters that exhibit completion times and number of follow-ups that vary according to physical activity levels and speaking time. It was also found that in the face-to-face network, network cohesion is positively correlated with higher worker productivity (Wu et al. 2008).
• Nurse behavior.We instrumented a group of 67 nurses working in the Post-Anesthesia Care Unit (PACU) of a Boston area hospital with sociometric badges (Olgu´ın-Olgu´ın, Gloor & Pentland 2009). Each nurse wore a sociometric badge for 27 days. Reduc-ing the patient’s length of stay (LOS) within the PACU would help lower costs. We found that the nurses’ social signaling behavior and face-to-face interaction patterns captured with the badges were predictive of patients’ LOS, having a direct effect on cost savings.
• Bank sales. A sociometric badge study was carried out in three branches of a bank in the Czech Republic (Olgu´ın-Olgu´ın & Pentland 2010b). 52 employees and 6 managers participated in the study and wore the badges for 20 working days. We studied the relationship between several behavioral features captured by the sociometric badges, and employee self-perceptions (from surveys) and productivity data. Several features from the face-to-face social network that were captured by the badges were predictive of sales performance in the three branches.
• Call center.We deployed our system at a bank’s call center, where a group of 80 employees and managers used sociometric badges for 30 days (Kim et al. 2009).
Pre-liminary results indicate that cohesion in the face-to-face social network captured by the badges is negatively correlated with the average phone call handle time. Our sug-gested intervention was to change the way employee’s breaks are currently scheduled so that more people working in the same team can take a break at the same time. This would allow members of the teams to form more cohesive ties over time.
• Team performance. We used sociometric badges during the Entrepreneurship De-velopment Program (EDP) at MIT in January of 2009 to capture the participants’ social interactions and predict team performance (Olgu´ın-Olgu´ın & Pentland 2010a). 109 participants used a sociometric badge during the first day of the program. There were 17 different teams and three of them were judged as winners in an elevator pitch contest. We used logistic regression and bootstrapping to predict the winning teams from the badge features averaged across members of each team with 90% accuracy.
• Real-time feedback. The badges have also been used in conjunction with mobile phones to create a real time group feedback system for meetings (Kim et al. 2008). This system, called “Meeting Mediator”, attempts to bridge the communication gap in distributed groups by detecting and reincorporating lost social signals. More than 120 4-person teams have been studied in-lab so far. Results from these studies show that the system effectively reduces the dynamical difference between co-located and distributed collaboration as well as the behavioral difference between dominant and non-dominant people.
• One-on-one interaction. Ten cohabiting couples shopping for furniture were stud-ied with sociometric badges to test if the interaction patterns among shoppers convey their interest level and predict the probability of purchase (Kim & Pentland 2009). Sensible differences in customer behavior depending on their interest level were ob-served. When couples were interested in an item they discussed it for a longer period of time and had a more balanced speaking style.
• Collective intelligence. In a recent study with more than 600 participants working in groups, evidence of a general collective intelligence factor that explains a group’s performance on a wide variety of tasks was found (Williams-Woolley et al. 2010).
Sociometric badges were used in a subset of these participants and the collective intelligence factor was found to be correlated with the equality in distribution of conversational turn-taking.
• Personality traits. Personality tests have been applied to the participants in some of the studies described above. It has been found that several personality traits (e.g. extroversion, neuroticism, openness, and agreeability) can be estimated from the sociometric badge measurements (Olgu´ın-Olgu´ın, Gloor & Pentland 2009), (Gloor et al. 2010).
• Software programming teams. There is a pilot study currently going on in three industrial software development teams in two multinational software companies in Finland (Niinimaki et al. 2009). Sociometric badges are being used to capture face-to-face interaction patterns, in addition to collecting electronic communication logs across different media. The goal of the study is to establish data collection and analysis methods to empirically evaluate and verify the claims made by agile software development practices.
Due to the encouraging results obtained in the studies carried out with the previous version of the badges, and the increasing interest of researchers from several research com-munities in using the badges for multiple applications, we decided to design and build a third generation that would make it easier for others to collect and analyze their own sociometric data.
4.4.2 Lessons Learned
Having deployed and used the sociometric badges 2.0 in a variety of settings and applications has allowed us to learn from their shortcomings and common deployment mistakes.
• Real-time clock. One of the first hardware limitations that we encountered with the sociometric badge 2.0 was the lack of a real-time clock. Without it, data synchro-nization was quite challenging and required the use of one or several “global” base stations (badges placed in fixed locations and turned on at a precise date and time).