AN INDIGENOUS ANALYSIS OF THE GRADUAL INFORMATION DIFFUSION MODEL
A Thesis
Presented to the Faculty of the Graduate School of Cornell University
in Partial Fulfillment of the Requirements for the Degree of Master of Science in Applied Economics and Management
by Bochen Yu December 2018
ABSTRACT
The main task of this work is to find out-of-sample evidence of the proposed predictions of Hong and Stein (1999) in the Chinese stock market – the Shang-Hai Stock Exchange (SSE) and the Shen-Zhen Stock Exchange (SZSE). Specifically, in this paper I explicitly test the three sets of implications derived from the gradual information flow model of Hong and Stein (1999). I found some supporting evidence for the gradual information flow model of Hong and Stein (1999). Using firm size as a proxy for information diffusion rate, I confirmed that momentum profits follow a term structure consistent with the prediction of the model. However, I did not find ubiquitous evidence of firms whose information travels slower should exhibit greater long-term reversal, following more pronounced overshooting. I also arrived at a contradictory observation in which stocks with longer trading horizon show virtually muted positive autocorrelations.
iii
BIOGRAPHICAL SKETCH
Bochen Yu, from Beijing, China, is a second year graduate student at Charles H. Dyson School of Applied Economics and Management under the S.C Johnson College of Business at Cornell University. Yu spent his youth in China and Australia, gaining perspectives from diverse cultures. He attended the High School Affiliated to Renmin University of China from 2006 to 2012, and received his bachelor’s degree in Economics and Music double major from Colgate University in May 2016, graduating cum laude. He received scholarships for academic
excellence sponsored by Mizuho Bank Ltd, Japan in 2011, and multiple Dean’s Award for Academic Excellence in college. Besides exploring his career path in finance, Yu is also an ardent student musician with experiences in composition, chamber music, and choral ensemble. He also played intramural soccer in division B in college, demonstrating his versatility. In 2015, Yu participated in outreach to Washington D.C. to provide food services to the local homeless population, where he made an impact to the underserved community.
iv
ACKNOWLEDGMENTS
I would first like to thank my advisor Professor Byoung-Hyoun Hwang of the Charles H. Dyson School of Applied Economics and Management at Cornell University for his guidance on this project and his patience on me.
I would also like to thank Professor Bart Selman of the School of Computing and Information Science at Cornell University whose research interests inspired me when I was searching for the research topic.
I would also like to thank our director of graduate studies Professor Calum G. Turvey for his kindness and support.
Lastly I would like to express my gratitude to my family for their constant support and their unconditional love, with which I am able to accomplish goals that otherwise seemed impossible.
v
TABLE OF CONTENTS
Biographical Sketch iii
Acknowledgements iv
List of Figures vi
List of Tables vii
Chapter 1 Introduction (3) 1
Chapter 2 Hong and Stein (1999) Revisited (7) 4
Chapter 3 Literature Review (7) 11
3.1 The Model (3) 11
3.2 The Market (3) 14
3.3 Momentum (2) 16
Chapter 4 Data and Empirical Approach (18) 18
4.1 The First Test (9) 19
4.2 The Second Test (4) 28
4.3 The Third Test (4) 32
Chapter 5 Conclusions and Extensions (2) 36
vi
LIST OF FIGURES
Figure 1.A Momentum Return against Holding Periods 24
Figure 1.B Momentum Return against Holding Periods (Naughton et al. 2008) 24
Figure 2.A Momentum Return against Firm Size (J=1 K=2 SZSE) 27
Figure 2.B Momentum Return against Firm Size (Hong et al. 2000) 27
vii LIST OF TABLES Table 1 22-23 Table 2 26 Table 3 30 Table 4 34-35
1 CHAPTER 1
Introduction
Stock market anomalies have long been an intriguing topic among researchers, because often times they openly confront the implications of traditional economic theories such as the efficient market hypothesis and the utility maximizing decision making under perfect rationality.
Consequently, a new field of study thrives, namely the behavioral economics or behavioral finance, which approaches from a more empirical, psychological prospective in explaining market phenomena and making predictions. A concrete example of such a digression comes to the study of asset-pricing. Traditional asset-pricing models such as the capital asset pricing model (CAPM) of Sharpe (1964) and the arbitrage pricing theory (APT) of Ross (1976) have been shown to fail to capture systematic market anomalies1. Instead, behavioral models such as the overconfidence model of Daniel, Hirshleifer and Subrahmanyam (1998), the representative investor model of Barbaris, Shleifer and Vishny (1998), and the gradual information diffusion model of Hong and Stein (1999) have made substantial achievements in confirming empirical observations.
To look closely, both Daniel et al. (1998) and Barbaris et al. (1998) approach from the individual investor’s point of view, incorporating behavioral heuristics of the kind in Tversky and
Kahneman (1974) to investors’ decision making process, which I would like to call a “micro”
2
prospective. On the other hand, Hong and Stein (1999) focuses on the interactions among categorical investors grouped by similar information processing pattern, which I consider a “macro” prospective. The models are not necessarily toe-to-toe against each other, for manifests of cognitive limitations can take different forms at different levels. However, the models do give divergent and, in certain scenario, contradictory predictions. The main task of this work is to find out-of-sample evidence of the proposed predictions of Hong and Stein (1999) in the Chinese stock market – the Shang-Hai Stock Exchange (SSE) and the Shen-Zhen Stock Exchange
(SZSE). Specifically, in this paper I explicitly test the three sets of implications derived from the gradual information flow model of Hong and Stein (1999). Although the other two models are equally interesting, they are left for future similar analysis, and the findings of this work neither validate nor invalidate the other two models.
Overall, I found some supporting evidence for the gradual information flow model of Hong and Stein (1999). Using firm size as a proxy for information diffusion rate, I confirmed that
momentum profits follow a term structure consistent with the prediction of the model. However, I did not find ubiquitous evidence of firms whose information travels slower should exhibit greater long-term reversal, following more pronounced overshooting. I also arrived at a contradictory observation in which stocks with longer trading horizon show virtually muted positive autocorrelations.
This work contributes to the literature in the following departments: 1) built upon previous findings, it is an attempt to go in the direction of a systematic analysis of the gradual information
3
flow model of Hong and Stein (1999). 2) Testing is done in the context of an emerging market, with the belief that if a behavioral model is truly a good model, it should be able to generalize well. 3) In addition to serving as an out-of-sample examination, with the relatively new and large-scaled data, it can also serve as a reference for future research on the momentum effect in the Chinese equity market.
The paper is structured as the following: Section 2 contains a brief recapitulation the gradual information diffusion model of Hong and Stein (1999); Section 3 serves as a literature review of related research on both the model and the market; Section 4 describes data and empirical approaches; Section 5 summarizes conclusions and extensions.
4 CHAPTER 2
Hong and Stein (1999) Revisited
2.1 Overview
Hong and Stein (1999) proposed a unified behavioral model that has both explanatory power and predicting power. That is, the model can parsimoniously explain market phenomena including short-term continuation and long-term reversal, and at the same time can make predictions that can be subject to “out-of-sample” testing. Although pursuing the same goal, the model is fundamentally different from that of Barberis et al. (1998) and Daniel et al. (1998), where the authors assume that prices are driven by a single representative agent, and then posit a small number of cognitive biases that this representative agent might have. Rather, Hong and Stein (1999) focuses on the interaction between heterogeneous agents. Loosely speaking, the model put more emphasis on the way traders interact with each other to find demonstrated biases, rather than on particular cognitive biases attributable to individual traders, as did in Barberis et al. (1998) and Daniel et al. (1998).
In its most basic form, Hong and Stein (1999) features two types of agents in the market, termed “news-watchers” and “momentum traders”. Each is boundedly rational, in a sense that each type of agent is only able to process some subset of the available public information in a given time period. The news-watchers make forecasts based on signals that they privately observe about future fundamentals; their limitation is that they do not condition on current or past prices. Momentum traders, in contrast, do condition on past prices changes. However, their limitation is
5
that their forecasts must be “simple” (i.e., univariate) functions of the history of past prices. Additionally, a third assumption is imposed to add to the reasonability of the model: private information diffuses gradually across the news-watcher population. Based on these settings, when there is only news-watchers active in the market, prices adjust slowly to new information, causing short-term underreaction. Then, with momentum traders involved, the underreaction is arbitraged away by these momentum traders. Because of their using simple strategies, for example they condition only on prices in the past 1 or 2 periods, this attempt to profit from underreacting prices results in long-term overshooting – the initial reaction of prices in the direction of fundamentals is accelerated, but comes at the expense of eventual overreaction.
2.2 Mathematical Derivation
Mathematically, in a market with only news-watchers, let 𝐷0 denote the value of a risky asset on which investors trade claims at current time 𝑡 = 0. The asset pays a single liquidating dividend that accounts for its ultimate value at some future time 𝑡 = 𝑇 where 𝑇 goes to infinity for the purpose of applying steady-state trading strategy. Then we have 𝐷𝑇 = 𝐷0 + ∑𝑇 𝜖𝑡
𝑡=0 where each
𝜖𝑡 denotes the dividend innovation at time 𝑡 and follows a standard Gaussian distribution. Further, each 𝜖𝑡 is divided into 𝑧 independent pieces of equal size: 𝜖𝑡 = 𝜖𝑡1+ 𝜖
𝑡2+ ⋯ + 𝜖𝑡𝑧. At
time 𝑡, innovation for future dividend 𝜖𝑡+𝑧−1 begins to circulate, but each subgroup of the news-watchers only observe one piece of the innovation (group 1 observe 𝜖𝑡+𝑧−11 , group 2 observe
𝜖𝑡+𝑧−12 ,…, group 𝑧 observe 𝜖
𝑡+𝑧−1𝑧 ). In the next period, the groups rotate so that group 1 observe
𝜖𝑡+𝑧−12 , group 2 observe 𝜖
𝑡+𝑧−13 , and group 𝑧 observe 𝜖𝑡+𝑧−11 . In this way, by the time 𝑡 + 𝑧 − 1,
6
formulation 𝑧 can serve as a proxy for the information diffusion rate – when 𝑧 is higher, it takes longer for the information to become public.
Assuming further that the news-watchers all have constant absolute risk aversion utility with the same risk-aversion degree, and that the supply of the asset is fixed at 𝑄. Since the news-watchers are boundedly rational, in other words, there is cognitive limitation in their processing power, they can only form their demand based on the simple buy-and-hold strategy, and they condition only on the information observed but not on prices.
Putting all these assumptions together, one arrives at the pricing formula of the risky asset at time 𝑡:
𝑃𝑡 = 𝐷𝑡+{(𝑧−1)𝜖𝑡+1+(𝑧−2)𝜖𝑡+2+⋯+[𝑧−(𝑧−1)]𝜖𝑡+𝑧−1}
𝑧 − 𝑄.
The next step is to include momentum traders. Momentum traders have the same risk profile as news-watchers, but their trading strategy is assumed to be dependent only on past prices. Specifically, at time 𝑡, a new generation of momentum traders arrive, take a position based on their forecast of the future price 𝑃𝑡+𝑗, and hold this position for 𝑗 periods. The forecast is a simple linear form of the cumulative price change over the past 𝑘 periods. For simplicity, let 𝑘 = 1. So the order flow from these momentum traders at time 𝑡 is 𝐹𝑡 = 𝛷(𝑃𝑡−1− 𝑃𝑡−2) + A =
𝛷∇𝑃𝑡−1+ 𝐴 where 𝛷 is the sensitivity measure and 𝐴 is some constant. Taking in this order flow
as the only possible supply shock, the price at any time 𝑡 is then adjusted by the aggregated 𝑗 order flows over the last 𝑗 − 1 periods and in the current period:
𝑃𝑡 = 𝐷𝑡+{(𝑧−1)𝜖𝑡+1+(𝑧−2)𝜖𝑡+2+⋯+[𝑧−(𝑧−1)]𝜖𝑡+𝑧−1}
𝑧 − (𝑄 − ∑ 𝐹𝑡+1−𝑖
𝑗
7 = 𝐷𝑡+{(𝑧−1)𝜖𝑡+1+(𝑧−2)𝜖𝑡+2+⋯+[𝑧−(𝑧−1)]𝜖𝑡+𝑧−1}
𝑧 − 𝑄 + 𝑗𝐴 + ∑ 𝛷∇𝑃𝑡−𝑖
𝑗
𝑖=1 . ①
At the same time, the following equation is obtained through optimization on the momentum traders’ side:
𝛷∇𝑃𝑡−1= 𝛾𝑣𝑎𝑟𝐸𝑀(𝑃𝑡+𝑗−𝑃𝑡)
𝑀(𝑃𝑡+𝑗−𝑃𝑡), where 𝛾 is the aggregate risk tolerance of the momentum traders.
Solving for the equilibrium 𝛷 yields the following equation: 𝛷 = 𝛾 𝑐𝑜𝑣(𝑃𝑡+𝑗−𝑃𝑡,∇𝑃𝑡−1)
𝑣𝑎𝑟(∇𝑃)∙𝑣𝑎𝑟𝑀(𝑃𝑡+𝑗−𝑃𝑡). ②
Given that there is no closed-form solution to this equation system, computational simulation is utilized to find the equilibrium value of 𝛷. It turns out that 𝛷 must be strictly greater than 0, meaning that the optimal strategy in any covariance-stationary equilibrium for momentum traders must be to follow the price trend. 2
What follows are two pivot propositions that shape the traders’ behavior of the model:
Proposition 1: In any covariance-stationary equilibrium, given a positive one-unit shock 𝜖𝑡+𝑧+1 that first begins to diffuse among news-watchers at time 𝑡:
(i) There is always overreaction, in the sense that the maximum value of the cumulative impulse response of prices is strictly greater than 1;
8
(ii) If the momentum traders’ horizon j satisfies 𝑗 ≥ 𝑧 − 1, the cumulative impulse response peaks at 𝑡 + 𝑗 and then begin to decline, converging to 1;
(iii) If the momentum traders’ horizon j satisfies 𝑗 < 𝑧 − 1, the cumulative impulse response peaks no earlier than 𝑡 + 𝑗 and eventually converges to 1.
Proposition 2: In any covariance-stationary equilibrium, if price changes are positively
correlated at short horizons (e.g., if cov(𝛻𝑃𝑡+1, 𝛻𝑃𝑡−1) > 0), then with risk-neutral momentum traders they are negatively correlated at a horizon no longer than 𝑗 + 1 (e.g.,
cov(𝛻𝑃𝑡+𝑖, 𝛻𝑃𝑡−1) < 0 for some 𝑖 ≤ 𝑗).
These propositions translate into the following streamlined market procedures:
1) At time 𝑡, there is price continuation from the previous time period 𝑡 − 1, possibly due to the ongoing circulation of positive future dividend innovation 𝜖𝑡−𝑥+𝑧−1 among news-watchers. But due to the news’ gradual diffusion, price underreacts;
2) Momentum traders, conditioning only on recent price trend, see positive short-term price continuation and therefore enter the market, arbitraging away any underpricing for some period 𝑗, even causing the price to overreact starting from 𝑡 + 𝑖 (Proposition 1);
3) As momentum traders only condition on recent price trend, they keep entering the market until time 𝑡 + 𝑖, when the price already overreacted to the innovation and starts to drop as previously entered momentum traders close their positions (Proposition 2). Those
momentum traders who still remain in the market get hurt, with the last round of momentum traders immediately experiencing a net loss.
9
Beyond the basic model, the authors also experimented a number of relaxations of the
assumptions. First, by questioning that not all traders have to use some simple strategies, they further added some degrees of heterogeneity to the trader population by introducing contrarian traders. Since it is known that the momentum traders must ultimately cause prices to overreact, it is plausible to have a portion of contrarian traders to exploit this overreaction. Their result shows that price dynamics, after including potential contrarian traders, are qualitatively similar to that of the basic model, and that contrarians have a modest stabilizing effect – the impulse response function peaks at a lower value comparing to that in the basic model. Second, they considered the case where the arbitrageurs have more computational power. Instead of forcing each of them to choose either to be a momentum trader or a contrarian trader, they are allowed to play an optimal mixed strategy. Similar results are found for this more complex version of the model.
2.3 Model Implications
Commentary work Fama (1998) posits that a good behavioral theory should satisfy, at the minimum, the following criteria: 1) should rest on assumptions about investor behavior that are either a priori plausible or consistent with casual observation; 2) should be able to explain the existing evidence in a parsimonious and unified way; 3) should be able to make a number of further predictions that can be subject to “out-of-sample” testing and that are ultimately validated. Obeying to this widely accepted standard, Hong and Stein (1999) posts multiple testable hypotheses.
(1) Rate of Information Flow vs. Momentum Effect
The model offers a testable cross-sectional implication linking the momentum strategies mentioned in Jegadeesh and Titman (1993) and the story of gradual information flow – if
10
momentum in stock returns does indeed come from gradual information flow, then momentum strategies should be more profitable among those stocks for which information moves more slowly across the investors.
(2) Information Diffusion vs. Long-term Reversal
Not only do stocks for which information travels slowly have greater short-term return correlations, but by making prices more attractive to momentum traders, it also leads to more pronounced overshooting and stronger long-term reversals.
(3) Trading Horizons vs. Pattern of Return Correlation
The model parameters provide an explicit correlation between momentum traders’ horizon and the time pattern of return autocorrelation – the longer the trading horizons are, the longer it takes for autocorrelations to go from positive to negative. Using external factors such as trading costs that can proximate trading horizons, one can investigate into the relationship between trading horizons and the time span of return autocorrelation.
11 CHAPTER 3
Literature Review
3.1 The Model
The model of Hong and Stein (1999) have been under some investigations. Most notably, Hong, Lim and Stein (2000), presented as a follow-up of Hong and Stein (1999), took a first step in the direction of giving a detailed testing of the gradual information diffusion story. In particular, the authors look for evidence that momentum reflects the gradual diffusion of firm-specific
information. To do so, they categorize stocks by firm size and analyst coverage, using these metrics as proxies of information flowing rate. The intuition is that information about firms with relatively smaller sizes travels slower, and that information about firms with relatively sparse analyst coverage travels slower. The core prediction is that stocks with slower information diffusion should exhibit more pronounced momentum. Further, using OLS as a baseline model, the authors regress different combinations of market indicators on firms’ performance measures in various time span, and end up with three key results: 1) once one moves past the very smallest stocks, the profitability of momentum strategies declines sharply with firm size; 2) holding size fixed, momentum strategies work better among stocks with low analyst coverage; 3) the effect of analyst coverage is greater for stocks that are past losers than for past winners. Although the authors admitted the possibility of alternative explanations for these results, the findings are consistent with the predictions of the gradual information flow theory.
12
In a different setting, Yalçin (2008) investigated the effect of gradual information diffusion on contrarian strategy returns in the US stock market. Using ex post returns as a proxy for expected returns and analyst coverage as a proxy for the rate of information diffusion, the author shows that returns of contrarian strategies based on past long-term return and fundamental value-to-price ratios decline monotonically with increasing rates of information diffusion, consistent with the predictions of Hong and Stein (1999).
In a different laboratory setting, Bloomfield, Tayler and Zhou (2009) presented their results of three sound experiments that examine the influence of uninformed traders on price momentum and reversal, supporting the view that momentum is a robust phenomenon when news is disseminated slowly, whereas long-term reversal arise only in the presence of uninformed traders. Specifically, using the model of Hong and Stein (1999) as the basis for the market setting, the authors conducted three rounds of experiment – human uninformed traders vs. robot informed traders, human informed traders experiencing gradual information dissemination, and human informed traders vs. human uninformed traders. They find that in the first experiment, human uninformed traders engage in momentum trading, causing prices to overreact in the short-run while eventually reverse; in the second experiment, informed traders fail to infer other traders’ information from market activity, resulting in short-term price momentum, but no long-term reversal; in the third experiment, uninformed traders does not eliminate short-long-term
momentum, but do generate long-term reversal by acting as contrarian traders. Their results are largely in line with the predictions of Hong and Stein (1999), except that the long-term reversal discovered in the third setting is caused by the long-lasting of uninformed traders behaving as
13
contrarian traders. In the original gradual information diffusion model, introducing contrarian traders does not significantly affect the price path.
More recently, Wu and Choudhry (2018) brings the model back to the stage in an investigation of the relationship between information uncertainties and momentum effects amid market swings. Following the discoveries in Wu (2016), the authors conducted detailed analysis linking the return patterns following market UP and DOWN states in the Chinese stock markets to different proxies of information uncertainty, using a method similar to that of Hong et al. (2000), and concluded that information uncertainty has an amplifying effect on momentum returns, and the magnitude is asymmetric in a sense that it is more salient following DOWN market state – a synonymic conclusion to that of Hong et al. (2000).
Although the results of all these works are generally in accord with the predictions of Hong and Stein (1999), one caveat is that they focus mainly on justifying or falsifying one or two particular predictions of the model. For instance, Hong et al. (2000) and Yalçin (2008) used CRSP and COMPUSTAT data and examined the momentum implication of the model in the US stock market, and undoubtedly their results provide a concrete piece of evidence supporting the view of Hong and Stein (1999). However, to further solidify the validity of the model, one would like to see the results be able to generalize to other markets with various indigenous characteristics. Additionally, as there are multiple paralleled predictions following the model, ideally all of them should be tested in order to complete the picture. This desire naturally leads to the development of this out-of-sample examination.
14 3.2 The Market
The Chinese stock market is one of the few equity markets whose performance is negatively correlated with the US stock market (Kang et al. 2002). This trait distinguishes it in the general sense, but as a result, global investors have been less interested in investigating the market for beyond-academic purposes, simply due to there is less material interests (Kang et al. 2002). As it went through waves of regulations and expansions starting from the early 2000s, the market has become more accessible to foreign investors, providing enormous growth opportunities (Wang and Chin 2004; Carpenter et al. 2018). It has then been under the scope of rigorous financial research.
The Chinese stock market has many unique characteristics that have been documented in previous works. To name a few: Drew et al. (2003) suggests that the Chinese stock market is difficult to comprehend using conventional analysis, based on their finding that the mimicking of Fama and French (1996) to form portfolios based on book-to-market ratio yields diverging results; Phylaktis and Ravazzolo (2005) argues that the market can serve as a diversification pool due to its weak interrelation with other major stock markets; Wu (2016) states that the market has segments (Class A and Class B shares, the Shang-Hai Stock Exchange and the Shen-Zhen Stock Exchange, and the split between tradable and non-tradable shares, etc.); Kang et al.
(2002), Naughton et al. (2008), Wu (2016) and Liao and Peng (2018) all mention that the absolute dominance of individual investors provide a great opportunity to investigate investor sentiments, empirical trader behaviors and various momentum phenomena.
15
The Shang-Hai Stock Exchange (SSE) is the largest stock exchange in China by total market capitalization and the 4th largest worldwide. It has a total of over 1400 companies listed with a
total market capitalization of 27 trillion CNY as of December 2017. Stocks in the market are divided into two classes – the class A shares (sector code 600XXX or 601XXX or 603XXX), which constitute more than 95% of the market, and the class B shares (sector code 900XXX), which only takes less than 5%. Initially, trading in class A shares are restricted to domestic investors only while class B shares are available to both domestic (since 2001) and foreign investors. However, after several reforms in December 2002, foreign investors are allowed (with limitations) to trade in class A shares under the Qualified Foreign Institutional Investor (QFII) program which was officially launched in 2003. The constituents of the class A shares tend to be large and state-owned companies, as opposed to its counterpart, the Shen-Zhen Stock Exchange (SZSE), which mainly consists of small and export-oriented joint ventures (Wang et al. 2004).
The Shenzhen Stock Exchange (SZSE) is the other major stock exchange in China, ranking the 8th largest stock market worldwide by total market capitalization, with over 2,100 companies listed on three major boards – the main board (sector code 000XXX), the secondary board (sector code 002XXX), and the ChiNext board (sector code 300XXX)3. Class A shares listed in
the SZSE have been historically different compared to those in the SSE in terms of quantity, liquidity, and market capitalization (Wu 2016). Among its investors, individual traders hold 45% of the tradable shares and account for 85% of the total trading volume (Liao and Peng 2018). Although a portion of the individual investors are de facto shadow accounts backed by
3 The ChiNext is a NASDAQ-style board of the Shen-Zhen Stock Exchange. The first batch of firms started trading on ChiNext on October 30, 2009. As of November 2018, there are 710 firms listed on ChiNext. ChiNext aims to attract innovative and fast-growing enterprises, especially high-tech firms. Its listing standards are less stringent than those of the Main and SME Boards of the Shen-Zhen Stock Exchange.
16
institutions, excluding these accounts still leaves over 80% of the entire investor population (Liao and Peng 2018).
(2) Reasons for Choosing the Chinese Stock Market as a Playground for Empirical Behavioral Evidence
The fact that both markets, albeit different microstructure, have a large market size with an individual-dominated investor composition grants at least two advantages for testing the model: 1) the market is inclusive enough for variations in firm-level characteristics, making it more like a supermarket rather than a grocery store. In such a hodgepodge, if information were indeed to diffuse more slowly in some sections than in others, it should be easier for researchers to detect any cross-sectional discrepancies caused by such gradual diffusions. 2) Individual investors, as opposed to institutional investors, are generally more prone to using behavioral heuristics or simple, unprofessional strategies, due to their cognitive biases and limited computational power (Tan et al. 2010). As a result, behavioral market anomalies should be prevailing and long-lasting in such markets, as there is less rational corrections that exploit the mispricing, comparing to other sophisticated markets such as the US stock market.
3.3 Momentum
The popularity of the momentum strategy documented in Jegadeesh and Titman (1993) does not fade on the other side of the world. Various works have investigated the profitability of
momentum strategies mimicking the kind in Jegadeesh and Titman (1993) in the Chinese stock market. For example, Tan et al. (2010) found undervaluation of 1% during the sample period 2002-2005 for the Shenzhen composite index; the undervaluation can be explained by price momentum. Gan et al. (2013) suggested that the stock profitability is related to size and
book-to-17
market ratio in the Chinese stock market. Wu (2016) found asymmetric momentum effect
following UP and DOWN market states in both SSE and SZSE from 1996 to 2010, which can be explained using individual level behavioral biases such as overconfidence and confirmation. Kang et al. (2002) discovered statistically significant abnormal profits for some short-horizon contrarian and intermediate-horizon momentum strategies. Narayan and Zheng (2010) stated that with the inclusion of market liquidity risk factor proposed by Avramov and Chordia (2006), momentum alone cannot explain abnormal profits. Naughton et al. (2008) reported evidence of substantial momentum profits during the period 1995 to 2005 but finds no strong link between past volume and momentum profits. Cakici et al. (2013) found strong evidence for the value effect in all emerging markets and the momentum effect for all but Eastern Europe for the period of 1990 to 2011. Li et al. (2010) found no profitability in 25 momentum strategies; in contrast, there is some evidence of reversal effects where the past winners become losers and past losers become winners afterward.
18 CHAPTER 4
Data and Empirical Approach
The dataset includes daily market data on 1439 SSE Class A shares and 2115 SZSE Class A shares from January 2005 to December 201745. Excluding stocks with no available data for the sample period, there are 1386 and 2077 left for either market, respectively. Class B shares are not included because there are only less than 50 of them for either market and these stocks are not heavily traded. Each entry contains information of stock’s board, section code, opening price, closing price, yesterday’s closing price, trade volume (in CNY), trade amount (in shares),
number of transactions, highest price, lowest price, price volatility, turnover ratio, total shares outstanding, and total shares. The sample period and stock inclusion is chosen to provide the most recent and comprehensive examination to date of the momentum effect in the Chinese equity market.
Dataset is adjusted for the purpose of this research as the following: to obtain monthly return, I first average the stock price by month, then use percentage change from previous month as measurement of monthly return. Following Naughton et al. (2008) and Wu (2016), I exclude dividends and interests (which are assumed to be reinvested automatically) and use raw returns only. The reason behind is that different from the US market, dividends in the Chinese stock market are not a major source for stock return since 1) they are distributed annually or
4 Data is obtained from Shen-Zhen Securities Information Co., Ltd.
5 The sample period is chosen to begin from 2005, when a major restructuring regarding the share-right split happened in the SZSE, and to end on 2017, in order to include relatively recent market data.
19
annually as opposed to quarterly, but the average holding period for individual investors is 1 month (Wei et al. 2003); 2) there is no dividend policy that requires a certain amount of net income or retained earnings must be paid as dividends, so it is not uncommon for firms to not distribute dividends at all (Wei et al. 2003). To obtain market capitalization, I use price multiply by total share outstanding. Percentage bid-ask spread is calculated as the monthly average of daily high minus low price divided by closing price. Other metrics, such as price volatility, number of transactions, and turnover ratio, are all adjusted to be monthly averages. Missing values on total shares outstanding are replaced by previous trading day’s value. Missing values on turnover ratio are calculated as trade amount divided by total shares outstanding.
4.1 The First Test
The first hypothesis to be tested is: if momentum in stock returns does indeed come from gradual information flow, then momentum strategies should be more profitable among those stocks for which information moves more slowly across the investors. To test this hypothesis, I first construct quintile portfolios based on stocks’ past return, mimicking the momentum strategy of Jegadeesh and Titman (1993). Then, following the methodology of Hong et al. (2000) and Wu and Chaudhry (2018), I use firm size as a proxy for information diffusion rate to further create quintile sub-samples. If the hypothesis holds, one should observe greater momentum profits in the sub-sample consisting small firms (whose information diffusion among news-watchers is assumed to be relatively slow), comparing to the sub-sample consisting large firms (whose information diffusion among news-watchers is assumed to be relatively fast).
20
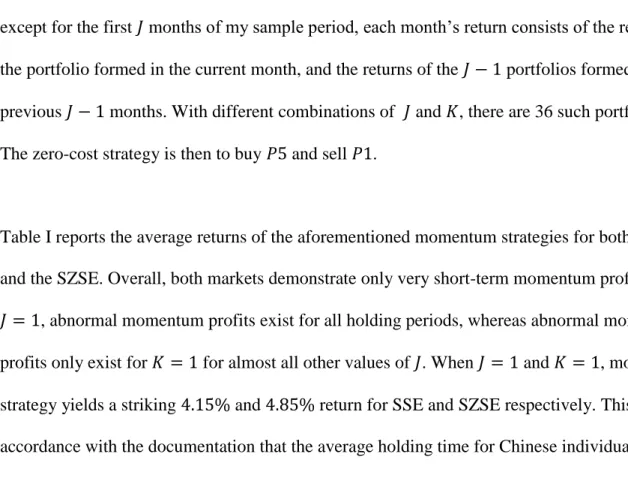
Specifically, at the beginning of each month, I rank all eligible stocks independently based on their past 𝐽 month cumulative returns (𝐽 = 1,2,3,6,9,12) and form equally weighted quintile portfolios 𝑃1 − 𝑃5. 𝑃1 contains stocks whose performances are among the lowest 20% over the last 𝐽 months, called the “loser” portfolio, and 𝑃5 contains stocks whose performances are among the highest 20% over the last 𝐽 months, called the “winner” portfolio. Following the convention to mitigate issues induced by the “bid-ask bounce” bias and return serial correlation (Moskowitz and Grinblatt 1999; Arena et al. 2008), I skip one month between the end of the ranking period and the start of the portfolio formation period. For simplicity, I assume buy-and-hold implementation on the investor side, but on a rolling basis to achieve rebalancing, so that except for the first 𝐽 months of my sample period, each month’s return consists of the return of the portfolio formed in the current month, and the returns of the 𝐽 − 1 portfolios formed in the previous 𝐽 − 1 months. With different combinations of 𝐽 and 𝐾, there are 36 such portfolios. The zero-cost strategy is then to buy 𝑃5 and sell 𝑃1.
Table I reports the average returns of the aforementioned momentum strategies for both the SSE and the SZSE. Overall, both markets demonstrate only very short-term momentum profits. When 𝐽 = 1, abnormal momentum profits exist for all holding periods, whereas abnormal momentum profits only exist for 𝐾 = 1 for almost all other values of 𝐽. When 𝐽 = 1 and 𝐾 = 1, momentum strategy yields a striking 4.15% and 4.85% return for SSE and SZSE respectively. This is in accordance with the documentation that the average holding time for Chinese individual
investors is 1 month (Wei et al. 2003). However, as holding period increases, momentum profits are gradually worn out, with the “loser” portfolios outperform the “winner” portfolios in the intermediate time horizon (3-12 months), benefiting contrarian investors. This finding is
21
consistent with that of Li et al. (2010). To look closely, when holding period is extended to more than 1 month, returns for loser portfolio generally increase; for winner portfolio, returns reach the their best at holding period of 1 month and then gradually decline. This term structure is consistent with Naughton et al. (2008). A connected dot graph is presented here to illustrate the similarity between the momentum profit term structure of SSE found in this work with that of Naughton et al. (2008). However, the magnitude of returns differ from that found in Naughton et al. (2008). In Naughton et al. (2008), momentum profits are more “smooth”, in a sense that they
scatter around 1% to 1.6% and are consistent over different holding horizons. Here the
momentum profits are more transient, clustering around only 𝐾 = 1 but spanning from 0.1% to 4%. With regard to the different return magnitudes between the momentum profits found in this work and that of Naughton et al. (2008), the following argument may serve as an explanation: Naughton et al. (2008) contains a total of 821 stocks from 1995 to 2005, accounting for 57% of all firms in China and 75% of the total market capitalization during that period (Naughton et al. 2008), whereas I use a different set of 1439 stocks from 2005 to 2017. As mentioned in section 2, the modern SSE was established in December 1990, and experienced major reformations in early 2000, including a share-right split regulation and a period of IPO banning in 2005. A relatively young market, the major expansion did not happen until after 2005, marked by the world’s second largest IPO by the Industrial and Commercial Bank of China (ICBC) in 2006. These historical invariances lead to completely different market conditions for the pre-2005 period and the post-2005 period, which is very likely to be the cause of this inconsistency.
22 Table I Panel A K=1 K=2 K=3 K=6 K=9 K=12 J=1 P1 -1.18 0.09 0.44 0.72 0.78 0.81 P5 2.97 1.59 1.21 1.01 1.00 0.98 P5-P1 4.15 1.50 0.76 0.29 0.22 0.17 (12.11)*** (5.83)*** (3.17)*** (1.88)** (1.76)** (1.34)* J=2 P1 0.04 0.72 0.90 1.00 1.00 1.00 P5 1.97 1.05 0.81 0.83 0.88 0.87 P5-P1 1.93 0.33 -0.08 -0.17 -0.12 -0.13 (5.54)*** (1.05) (-0.28) (-0.94) (-0.78) (-0.85) J=3 P1 0.44 0.97 1.10 1.10 1.11 1.12 P5 1.64 0.91 0.73 0.83 0.90 0.90 P5-P1 1.19 -0.07 -0.38 -0.27 -0.21 -0.22 (3.19)*** (-0.19) (-1.29) (-1.31)* (-1.12) (-1.22) J=6 P1 0.76 1.09 1.14 1.14 1.14 1.19 P5 1.35 0.83 0.74 0.81 0.86 0.85 P5-P1 0.58 -0.26 -0.40 -0.33 -0.29 -0.33 (1.94)** (-0.94) (-1.54)* (-1.45)* (-1.35)* (-1.71)** J=9 P1 0.92 1.17 1.23 1.20 1.23 1.26 P5 1.24 0.82 0.76 0.82 0.83 0.83 P5-P1 0.32 -0.36 -0.46 -0.38 -0.40 -0.43 (1.15) (-1.35)* (-1.79)** (-1.48)* (-1.68)** (-1.95)** J=12 P1 0.96 1.20 1.24 1.24 1.26 1.29 P5 1.10 0.74 0.68 0.71 0.74 0.76 P5-P1 0.15 -0.46 -0.56 -0.53 -0.53 -0.52 (0.50) (-1.59)* (-1.93)** (-1.89)** (-1.98)** (-2.08)** Price Momentum Portfolios and Stock Returns: Shang-Hai Stock Exchange 2005-2017 (skip 1 month)
23 Panel B K=1 K=2 K=3 K=6 K=9 K=12 J=1 P1 -1.91 -0.32 0.06 0.38 0.46 0.56 P5 2.94 1.38 0.98 0.72 0.69 0.68 P5-P1 4.85 1.70 0.92 0.34 0.23 0.11 (13.17)*** (6.15)*** (3.77)*** (2.13)** (1.74)** (0.93) J=2 P1 -0.48 0.38 0.59 0.69 0.74 0.80 P5 1.73 0.76 0.57 0.50 0.54 0.55 P5-P1 2.20 0.38 -0.02 -0.19 -0.20 -0.24 (6.11)*** (1.22) (-0.09) (-1.01) (-1.28) (-1.66)** J=3 P1 0.06 0.70 0.85 0.86 0.93 0.97 P5 1.41 0.66 0.49 0.51 0.54 0.59 P5-P1 1.35 -0.04 -0.36 -0.35 -0.39 -0.38 (3.62)*** (-0.13) (-1.21) (-1.63)* (-2.12)** (-2.16)** J=6 P1 0.63 0.97 0.99 1.03 1.08 1.14 P5 1.05 0.45 0.37 0.41 0.50 0.54 P5-P1 0.41 -0.52 -0.63 -0.61 -0.58 -0.60 (1.25) (-1.75)** (-2.30)** (-2.66)*** (-2.86)*** (-3.21)*** J=9 P1 0.80 1.12 1.20 1.20 1.24 1.27 P5 1.01 0.49 0.39 0.48 0.54 0.60 P5-P1 0.20 -0.63 -0.80 -0.72 -0.70 -0.67 (0.69) (-2.27)** (-2.99)*** (-2.90)*** (-3.06)*** (-3.20)*** J=12 P1 1.00 1.24 1.30 1.30 1.33 1.34 P5 0.89 0.47 0.41 0.43 0.47 0.53 P5-P1 -0.11 -0.77 -0.89 -0.87 -0.86 -0.81 (-0.36) (-2.67)*** (-3.12)*** (-3.22)*** (-3.42)*** (-3.44)***
* Statistically significant at 10% level ** Statistically significant at 5% level *** Statistically significant at 1% level
Table I (Continued)
Price Momentum Portfolios and Stock Returns: Shen-Zhen Stock Exchange 2005-2017 (skip 1 month)
This table presents the momentum returns (the difference between average monthly returns of the “winner” portfolios and those of the “loser” portfolios) in the Class A shares listed in the Shang-Hai Stock Exchange and the Shen-Zhen Stock Exchange for the sample period from January 2005 to December 2017. The momentum portfolio formation procedure is akin to the methodology used by Jegadeesh and Titman (1993). At the beginning of each month during the sample period, all the eligible stocks are ranked in ascending order based on their past J month returns. The portfolios are formed one month later, with P1 containing stocks whose performances in the last J months are among the lowest 20%, and P5 containing stocks whose performances in the last J months are among the highest 20%. P5–P1 represents the
momentum return for each momentum trading strategy. All return values are in percentage measure. t-statistics are in parenthesis.
24
Figure 1.A Momentum Return against Holding Periods
Figure 1.B Momentum Return against Holding Periods (Naughton et al. 2008)
Given that the momentum profit is only pervasive in the short run, i.e., when 𝐽 = 1, I focus only
on this set of momentum strategy hereafter. Hong et al. (2000) argues that a combination of smaller firms being more prone to supply-shock-induced reversals due to their thinner market making capacity and that gradual information diffusion results in greater momentum in smaller firms should generate a non-monotonic, inverted U-shaped momentum profit profile. To test if
25
gradual information diffusion is indeed more pronounced in smaller firms, I replicate the momentum analysis in Hong et al. (2000), breaking down the portfolios by raw size.
Specifically, on top of the quintile portfolios, I use an independent sort to generate 5 sub-samples for each of the portfolios based on the market capitalization of firms in that portfolio measured at the ranking period. The intuition is that if smaller firms do have greater information diffusion barrier, one should observe greater momentum profits in 𝑃5𝑠𝑚𝑎𝑙𝑙− 𝑃1𝑠𝑚𝑎𝑙𝑙, as compared to 𝑃5𝑙𝑎𝑟𝑔𝑒− 𝑃1𝑙𝑎𝑟𝑔𝑒. Since there is no equivalent measurement such as NYSE/AMEX deciles, I use market capitalization quintiles as breakpoints for sub-sample portfolio formation.
Table II reports the momentum returns for the two-way independent sort implementation in both markets. For each individual 𝐾, the momentum return for the portfolio containing the largest 20% firms (𝑃5𝑄5− 𝑃1𝑄5) is actually larger than the return for the portfolio containing the smallest 20% firms (𝑃5𝑄1− 𝑃1𝑄1). This is a contradiction to the implication of Hong and Stein
(1999). However, including not just the extreme ends, but also the mid-size portfolios yields a somehow different angle. Figure 2.A shows the momentum returns plotted against different size portfolios in SZSE. Here I pick 𝐽 = 1 and 𝐾 = 2 because this combination provides the closest resemblance to that of Hong et al. (2000). One can observe an inverted U-shaped structure of momentum returns against firm size. When firm size is on the extremely small end, momentum return increases with firm size, possibly due to thin market making capacity dominating (Hong et al. 2000). As momentum return peaks at the third quintile, it monotonically declines. This
observation is quite robust throughout all momentum strategies under examination: of the 12 such graphs generated for different 𝐾 values in both SSE and SZSE, 6 of them exhibit the same
26
hump-shaped structure, in which momentum return peaks at the third quintile and then gradually decreases. Panel A Panel B P1 P5 P5-P1 P1 P5 P5-P1 J=1 K=1 Q1 -0.05 3.15 3.20J=1 K=1 Q1 -1.34 3.18 4.52 Q5 -1.81 2.68 4.49 Q5 -2.39 2.55 4.95 All -1.18 2.97 4.15 All -1.91 2.94 4.85 K=2 Q1 1.04 2.00 0.96 K=2 Q1 0.15 1.37 1.22 Q5 -0.50 1.32 1.82 Q5 -0.61 1.05 1.66 All 0.09 1.59 1.50 All -0.32 1.38 1.70 K=3 Q1 1.30 1.79 0.49 K=3 Q1 0.41 1.07 0.66 Q5 0.18 0.91 1.09 Q5 -0.08 0.69 0.77 All 0.44 1.21 0.76 All 0.06 0.98 0.92 K=6 Q1 1.44 1.68 0.24 K=6 Q1 0.61 0.90 0.29 Q5 0.21 0.58 0.38 Q5 0.23 0.47 0.25 All 0.72 1.01 0.29 All 0.38 0.72 0.34 K=9 Q1 1.50 1.62 0.12 K=9 Q1 0.72 0.75 0.04 Q5 0.35 0.57 0.22 Q5 0.21 0.50 0.29 All 0.78 1.00 0.22 All 0.46 0.69 0.23 K=12 Q1 1.54 1.55 0.02 K=12 Q1 0.77 0.78 0.01 Q5 0.35 0.55 0.19 Q5 0.28 0.47 0.19 All 0.81 0.98 0.17 All 0.56 0.68 0.11
Mean Size 1.32 49.70 Mean Size 0.86 13.50
Median Size 1.35 19.70 Median Size 0.64 7.85
This table presents momentum portfolios based on last 1 month return. Portfolios are held for K months. Stocks whose last 1 month performance is among the lowest 20% are in P1, whereas stocks whose last 1 month performance is among the highest 20% are in P5. At the ranking period, an independent sort is conducted to classify all eligible stocks into size quintiles. Stocks whose market capitalization is among the lowest 20% are in Q1, whereas stocks whose market capitalization is among the highest 20% are in Q5. Momentum returns are then P5-P1 for all Q1 to Q5.All return values are in percentage measure. All mean and median size values are in billion CNY. 1 CNY ≈ 0.14 USD
Momentum Strategies and Stock Returns, Sorting by Size: Shang-Hai Stock Exchange 2005-2017
Momentum Strategies and Stock Returns, Sorting by Size: Shen-Zhen Stock Exchange 2005-2017
27
Figure 2.A Momentum Return against Firm Size (J=1 K=2 SZSE)
28 4.2 The Second Test
The second hypothesis to be tested is: for the same set of stocks whose information travels slowly, not only do they have greater short-term return correlations, but by making prices more attractive to momentum traders, it also leads to more pronounced overshooting and stronger long-term reversals. To test this hypothesis, I again focus on the momentum portfolios with look-back period 𝐽 = 1, but instead of the return during the holding period, I now extrapolate to longer horizons and examine the return of the same set of stocks up to 1 year beyond the formation period. If indeed stocks whose information travels slowly exhibit more pronounced overshooting and stronger long-term reversals, one should observe stocks in the third quintile (with the most pronounced overshooting, as demonstrated in Figure 2.A) exhibit the greatest reversals, and stocks in the fifth quintile (with the highest information diffusion rate) exhibit rather moderate reversals, creating a mirrored image of the inverted U-shaped return profile in the negative region.
To implement this, again at the start of each month, I independently sort all eligible stocks based on their past 1 month returns and their firm sizes, creating quintile portfolios under both metrics. I then use the difference between the return of the “winner” portfolio (𝑃5) and that of the “loser” portfolio (𝑃1) under different size-based sub-samples as a measurement of momentum profits. Among small firms, the momentum profit is 𝑃5𝑄1− 𝑃1𝑄1; among large firms, the momentum profit is 𝑃5𝑄5− 𝑃1𝑄5. For every portfolio formed in each month, I look into its future monthly returns within a year period since the formation time, as well as the average return of this 1-year period.
29
Table III presents the results for both the SSE and the SZSE. In the month immediately
following the portfolio formation period, returns are largely positive, matching the finding in the first test that with 𝐽 = 1 and 𝐾 = 1, there is salient momentum profit. However after that, for the same set of stocks, returns experience a prolonged period of reversal, gradually wiping out the momentum profit. This procedure is numerically captured by a comparison between averaging the monthly returns with and without month 1. When including month 1, the average monthly return is positive for 4 of the size quintiles, and the resulting magnitude matches the finding in the first test that with 𝐽 = 1 and 𝐾 = 12, there is only weak momentum profit. When excluding month 1, the average monthly returns are unanimously negative across all size quintiles,
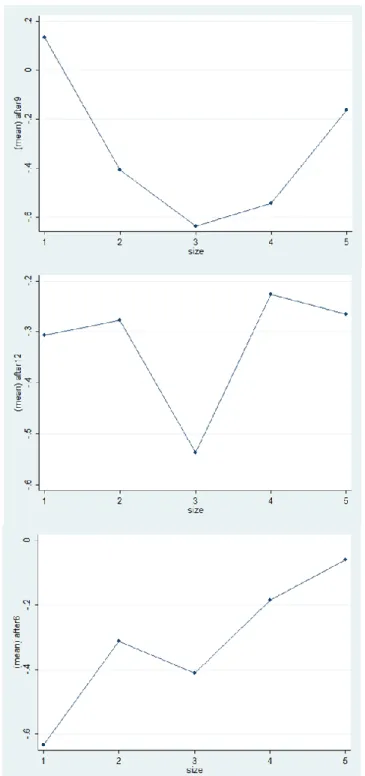
demonstrating pervasive reversals. Looking across different sizes, however, there is no consistent indication of more pronounced reversals in stocks whose momentum profits were more salient in month 1. Among the 22 monthly return profiles, that is, excluding month 1 for both markets, there is only a few that resemble the proposed reversal term structure with the third quintile exhibiting the greatest reversal. Figure 3 gives a demonstration of these return profiles. One common feature shared by these return profiles is that relative to the fourth and the fifth quintile, reversal at the middle quintile is noticeably stronger. But they also exhibit unexplainable patterns such as the abnormal strong reversal in the first quintile of the bottom graph, and the inflection points at the second and the fourth quintile of the middle graph.
31
Figure 3 Extrapolated Momentum Return against Firm Size
This figure shows 3 instances of the extrapolated monthly momentum returns whose return profile roughly matches that predicted by the model. The top graph is the 9th month after the formation period in SSE; the middle graph is the 12th month after the formation period in SSE; the bottom graph is the 6th month after the formation period in SZSE.
32 4.3 The Third Test
The third hypothesis to be tested is: the longer the trading horizons are, the longer it takes for autocorrelations to change sign, as suggested by Proposition 1. To test this, I use trading cost to approximate the length of trading horizon, which seems to be the most intuitive way since trading cost reduces trading frequency. Using percentage bid-ask spread as a measurement for trading cost, I again sort stocks into quintile portfolios, with and without controlling for firm size, and construct autocorrelation series with lags up to 40 months.
As we are only interested in the sign of return autocorrelation, rather than the magnitude, Table IV only presents statistics recoding the first month at which portfolio return autocorrelation turns from positive to negative, for momentum strategies based on 1 month lagged return and bid-ask spread. Panel A and Panel B shows the result for the SSE and SZSE, respectively. Throughout all momentum strategies with different holding periods, there is no significant difference between the arrival of negative autocorrelation for stocks with high bid-ask spread (stocks in portfolio B5, whose trading horizon are long) and that for stocks with low bid-ask spread (stocks in portfolio B1, whose trading horizon are short). Particularly, for the SZSE, when holding period 𝐾 = 1, stocks in B1 actually have much longer positive autocorrelation – a striking 9 month period before negative autocorrelation arrives, whereas that for stocks in B5 is only 1 month. This observation directly contradicts the prediction of Hong and Stein (1999).
Since bid-ask spread may be strongly correlated with firm size, I further control for firm size by breaking down bid-ask spread portfolios by size, and the results are presented in Table IV Panel C and Panel D. Here I only include cases at the extreme end, i.e., for firm sizes being either in
33
the bottom quintile (size = 1) or in the top quintile (size = 5). Results for other quintiles are largely the same. There is no universal bias toward stocks with higher bid-ask spread;
occasionally, negative autocorrelation arrives much later for stocks with low bid-ask spread instead, as suggested by the 21 months in Panel D. One observation is that for the majority cases, negative autocorrelation arrives within 2 months, even for large firms whose idiosyncratic risks are low. This phenomenon is somehow unexpected, as it contradicts the nature of momentum – that past “winners” continue to win. However, this finding is in line with Lewellen (2002), in which the author found that size based portfolios are negatively autocorrelated and cross-serially correlated over intermediate horizons. The argument for the co-existence of both momentum profits and negative autocorrelation is the following: if investors do underreact to firm-specific news, contributing to a positive autocorrelation, but overreact to macroeconomic news,
contributing largely to negative autocorrelation, the mixed result could turn out to be negative. Such an explanation, however, does not help with the justification of the gradual information diffusion model, which, as stated in Hong and Stein (1999), does not differentiate between firm-specific news and macroeconomic news.
34 Panel A Bid-ask Spread K=1 K=2 K=3 K=6 K=9 K=12 J=1 B1 3 2 2 2 2 1 B2 3 2 2 2 2 2 B3 2 2 2 2 2 2 B4 2 2 2 2 2 2 B5 2 2 2 2 2 2 B5-B1 -1 0 0 0 0 1 Panel B Bid-ask Spread K=1 K=2 K=3 K=6 K=9 K=12 J=1 B1 9 3 1 2 2 2 B2 1 2 2 2 2 2 B3 1 3 2 2 2 2 B4 2 2 2 2 1 1 B5 1 1 1 2 2 2 B5-B1 -8 -2 0 0 0 0 Panel C Size=1 Bid-ask Spread K=1 K=2 K=3 K=6 K=9 K=12 J=1 B1 2 1 1 1 2 2 B2 3 1 1 2 2 2 B3 1 3 3 1 1 1 B4 1 1 1 2 2 2 B5 1 2 1 2 2 2 B5-B1 -1 1 0 1 0 0 Size=5 Bid-ask Spread K=1 K=2 K=3 K=6 K=9 K=12 J=1 B1 3 2 2 2 2 2 B2 7 6 6 2 2 2 B3 2 10 6 2 2 2 B4 4 11 2 2 2 2 B5 2 2 2 1 2 2 B5-B1 -1 0 0 -1 0 0 Table IV
Month at which Bid-Ask Spread Portfolio Return Autocorrelation Changes Sign: Shang-Hai Stock Exchange 2005-2017 (controlling for firm size)
Month at which Bid-Ask Spread Portfolio Return Autocorrelation Changes Sign: Shang-Hai Stock Exchange 2005-2017 (bid-ask spread only)
Month at which Bid-Ask Spread Portfolio Return Autocorrelation Changes Sign: Shen-Zhen Stock Exchange 2005-2017 (bid-ask spread only)
35 Panel D Size=1 Bid-ask Spread K=1 K=2 K=3 K=6 K=9 K=12 J=1 B1 21 1 1 1 1 1 B2 1 3 3 1 3 2 B3 1 2 2 2 2 2 B4 1 3 2 2 2 1 B5 2 2 2 2 2 2 B5-B1 -19 1 1 1 1 1 Size=5 Bid-ask Spread K=1 K=2 K=3 K=6 K=9 K=12 J=1 B1 1 2 2 2 3 7 B2 3 9 9 2 2 2 B3 1 5 2 8 2 2 B4 1 2 2 2 2 2 B5 1 1 1 1 1 1 B5-B1 0 -1 -1 -1 -2 -6
This table reports the first month at which the autocorrelation of momentum strategy turns from positive to negative. Momentum strategies are the same as in the first test, with J=1 and K=1,2,3,6,9,12, and skipping 1 month between the ranking period and the portfolio formation period. Panel A contains statistics for an independent sort based on lagged 1 month return and bid-ask spread only, with B1 including stocks whose bid-ask spread being in the bottom 20% at the ranking period, and B5 including stocks whose bid-ask spreak being in the top 20% at the ranking period, for the SSE. Panel B contains statistics under the same setting as in Panel A, but for the SZSE. Panel C contains statistics under the same setting as in Panel A, further controlling for firm size. Panel D contains statistics under the same setting as in Panel B, further controlling for firm size. Momentum return is measured by P5-P1, where P5 is the portfolio containing stocks whose lagged 1 month performance is in the top 20% at the ranking period, and P1 containing stocks whose lagged 1 month performance is in the bottom 20% at the ranking period, for different bid-ask spread profiles. Bid-ask spread is measured by the monthly average of daily high price minus low price divided by closing price for each individual stocks. B5-B1 is the difference between the earliest month in which return autocorrelation turns from positive to negative.
Table IV (Continued)
Month at which Bid-Ask Spread Portfolio Return Autocorrelation Changes Sign: Shen-Zhen Stock Exchange 2005-2017 (controlling for firm size)
36 CHAPTER 5
Conclusions and Extensions
This work aims at conducting a comprehensive “out-of-sample” testing of the gradual information diffusion model proposed by Hong and Stein (1999). Hong and Stein (1999) provided 3 testable hypotheses in justifying their model, namely:
1) if momentum in stock returns does indeed come from gradual information flow, then momentum strategies should be more profitable among those stocks for which information moves more slowly across the investors;
2) for the same set of stocks whose information travels slowly, not only do they have greater short-term return correlations, but by making prices more attractive to momentum
traders, it also leads to more pronounced overshooting and stronger long-term reversals; 3) the longer the trading horizons are, the longer it takes for autocorrelations to change sign.
Utilizing data from the Chinese stock market, I find some supporting evidence for both the first and the second hypothesis, but find contradictory results regarding the last hypothesis.
Specifically, I found that:
1) using firm size as a proxy for information diffusion rate, I analyzed short-term
momentum strategy performances for different size based portfolios. As size increases, the term structure of momentum profit generally follows that predicted by the model, with larger firms exhibiting reduced momentum profits, comparing to their smaller counterparts;
37
2) for the same set of firms, I further investigated into their extrapolated returns. Although momentum returns do exhibit reversals in the intermediate horizon, the term structures vary greatly across different months, with only a few resembling the mirror image of an inverted U-shaped term structure. The evidence is not robust enough to support the hypothesis that stocks with greater overshooting should also experience greater reversals. 3) using bid-ask spread as a proxy for trading horizon, I analyzed short-term momentum
strategy performances for bid-ask spread based portfolios, with and without controlling for firm size. Not only that stocks with longer trading horizon do not have a longer span of positive autocorrelation, they do not experience price continuation at all, with
autocorrelation turning to negative in less than 2 months for most of the cases. Trade-frequent stocks, occasionally, do experience long positive autocorrelation.
Although the results can all find their roots in previous works, there are still improvements than can be done to perfect the standpoint of this work. For example, with respect to the capture of long-term reversals, it might be more convincing to extend holding periods to more than 12 months; more delicate implementations, such as the exclusion of firms whose IPO are within 6 months of the examination period, or the exclusion of stocks whose price is below a certain threshold, could be introduced. There are also limitations arise from insufficient data, in that many previous works use analyst coverage as a proxy for information diffusion rate (Hong et al.
2000; Wu and Chaudhry 2018), which I did not attempt to obtain. Lastly, this work does not question whether firm size or any other indicator is indeed a good proxy for information
diffusion rate; many factors are correlated and can produce results in the same direction. This is a whole other research area.
38 REFERENCES
Arena, Haggard, Yan (2008). “Price Momentum and Idiosyncratic Volatility”, Financial Review, Vol. 43, No. 2, pp. 159-190
Avramov, Chordia (2006). “Asset Pricing Models and Financial Market Anomalies”, The Review of Financial Studies, Vol. 19, Issue 3, pp. 1001-1040
Barberis, Shleifer, Vishny (1998). “A Model of Investor Sentiment”, Journal of Financial Economics, 49, pp. 307-343
Bloomfiled, Tayler, Zhou (2009). “Momentum, Reversal, and Uninformed Traders in Laboratory Markets”, The Journal of Finance, Vol. 64, No. 6, pp. 2535-2558
Cakici, Fabozzi, Tan (2013). “Size, Value, and Momentum in Emerging Market Stock Returns”,
Emerging Markets Review, 16, pp. 46-65
Carpenter, Lu, Whitelaw (2018). “The Real Value of China’s Stock Market”, BOFIT Discussion Papers
Chen, Kim, Yao, Yu (2010). “On the Predictability of Chinese Stock Returns”, Pacific-Basin Finance Journal, 18, pp. 403-425
Daniel, Hirshleifer, Subrahmanyam (1998). “Investor Psychology and Security Market Under- and Overreactions”, The Journal of Finance, Vol. 53, No. 6, pp. 1839-1885
De Long, Shleifer, Summers, Waldmann (1990). “Noise Traders Risk in Financial Markets”, The Journal of Political Economy, Vol. 98, No. 4, pp. 703-738
Drew, Naughton, Veeraraghavan (2003). “Firm Size, Book-to-Market Equity and Security Returns: Evidence from the Shanghai Stock Exchange”, Australian Journal of Management, Vol. 28, No. 2, pp. 119-139
Fama (1998). “Market Efficiency, Long-Term Returns, and Behavioral Finance”, Journal of Financial Economics, 49, pp. 283-306
Fama, French (1996). “The CAPM is Wanted, Dead or Alive”, The Journal of Finance, Vol. 51, No. 5, pp. 1947-1958
Fama, French (2012). “Size, Value, and Momentum in International Stock Returns”, Journal of Financial Economics, 105, pp. 457-472
Gan, Hu, et al. (2013). “An Empirical Cross-Section Analysis of Stock Returns on the Chinese A-Share Stock Market”, Investment Management and Financial Innovations, Issue 1, pp.127-136
39
Gong, Liu, Liu (2015). “Momentum is Really Short-Term Momentum”, Journal of Banking & Finance, 50, pp. 169-182
Hong, Lim, Stein (2000). “Bad News Travel Slowly: Size, Analyst Coverage, and the Profitability of Momentum Strategies”, The Journal of Finance, Vol. 55, No. 1, pp. 265-295 Hong, Stein (1999). “A Unified Theory of Underreaction, Momentum Trading, and Overreaction in Asset Markets”, The Journal of Finance, Vol. 54, No. 6, pp. 2143-2184
Jegadeesh, Titman (1993). “Returns to Buying Winners and Selling Losers: Implications for Stock Market Efficiency”, The Journal of Finance, Vol. 48, No. 1, pp. 65-91
Ji (2008). “Is it Under- or Over-reaction? An Empirical Investigation”, Asia-Pacific Journal of Financial Studies, Vol. 37, No. 2, pp. 185-216
Kang, Liu, Ni (2002). “Contrarian and Momentum Strategies in the Chinese Stock Market: 1993-2000”, Pacific-Basin Finance Journal, 10, pp. 243-265
Lewellen (2002). “Momentum and Autocorrelation in Stock Returns”, The Review of Financial Studies, Vol. 15, No. 2, pp. 533-563
Li, Qiu, Wu (2010). “Momentum and Seasonality in Chinese Stock Markets”, Journal of Money, Investment, and Banking, Issue 17, pp. 24-36
Liao, Peng (2018). “Price and Volume Dynamics in Bubbles”.
Moskowitz, Grinblatt (1999). “Do Industries Explain Momentum?”, The Journal of Finance, Vol. 54, No. 4, pp. 1249-1290
Nayaran, Zheng (2010). “Market Liquidity Risk Factor and Financial Market Anomalies: Evidence from the Chinese Stock Market”, Pacific-Basin Finance Journal, 18, pp. 509-520 Naughton, Truong, Veeraraghavan (2008). “Momentum Strategies and Stock Returns: Chinese Evidence”, Pacific-Basin Finance Journal, 16, pp. 476-492
Phylaktis, Ravazzolo (2005). “Stock Prices and Exchange Rate Dynamics”, Journal of International Money and Finance, 24, pp. 1031-1053
Tan, Gan, Li (2010). “An Empirical Analysis of the Chinese Stock Market:
Overvalued/Undervalued”, International Journal of Applied Economics & Econometrics, Vol. 18, No. 1, pp. 44-74
Tversky, Kahneman (1973). “Availability: A Heuristic for Judging Frequency and Probability”,
Cognitive Psychology, 5, pp. 207-232
40 185, No. 4157, pp. 1124-1131
Tversky, Kahneman (1981). “The Framing of Decisions and the Psychology of Choice”, Science, Vol. 211, pp. 453-458
Wang, Chin (2004). “Profitability of Return and Volume-Based Investment Strategies in China’s Stock Market”, Pacific-Basin Finance Journal, 12, pp. 541-564
Wang, Liu, Wang (2004). “Return and risk interactions in Chinese stock markets”, Journal of International Financial Markets Institutions and Money, Vol. 14, No. 4, pp. 367–383
Wei, Zhang, Xiao (2003). “Dividends Policy and Ownership Structure in China”.
Wu (2016). “The Asymmetric Momentum Effect in the Chinese Class A Share Market Amid Market Swings”, Asia-Pacific Financial Markets, 23, pp. 107-136
Wu, Chaudhry (2018). “Information Uncertainty and Momentum Phenomenon Amidst Market Swings: Evidence from the Chinese Class A Share Market”, Asia-Pacific Financial Markets, 25, pp. 111-136
Yalçin (2008). “Gradual Information Diffusion and Contrarian Strategies”, The Quarterly Review of Economics and Finance, 48, pp. 579-604
Zhang (2006). “Information Uncertainty and Stock Returns”, The Journal of Finance, Vol. 61, No. 1, pp. 105-137