University Library
• • Loughborough
•
University
AuthorfFiling Title ...A ..
~J7:-:-
... .
,-Class Mark ... .Please note that fines are charged on ALL
Predicting Corporate Financial Distress in UK
by
M AdnanAziz
Doctoral Thesis
Submitted
in
partial fulfillment of the requirements for the award of
Doctor of Philosophy degree of Loughborough University
February 2007
U
Loughhorough University Pilkington Library D3\~2S{IO/11
~~I
1A'fft
rt%.
OL.{-o3qI
Dedicated to my
Adored parents, Aziz-ul-Haq and Surayya Jabeen,
Endearing wife, Zainab,
and
Acknowledgement
"For a long time it had seemed to me that life was about to begin--reallife. But there was always some obstacle in the way. something to be gotten through first. some unfinished business. time still to be served. a debt to be paid. Then life would begin. At last it dawned on me that these obstacles were my life. "---- Alfred D Souza
I am glad being able to write these lines, as the work contained in this thesis re-assures to me that nothing is impossible in this life. All one needs is a firm determination and willingness to undertake a particular task. It is, however. not possible to do it alone. We inevitably depend on a number of other factors around. I am extremely beholden to all those who shared this task with me despite their numerous engagements.
This study could only be culminated because of veracious and unfeigned guidance and support extended by my supervisor Dr. Humayon Oar, who not only proved to be an unending source of inspiration for me but also is the man behind the scene.
I owe a lot of gratitude to the Department of Economics of Loughborough University. and the faculty members of it. In particular, I am exceptionally thankful to Professor Tom Weyman-Jones for his patronizing role throughout my stay at the department. I am intensely grateful to the department and Tom's support in offering the PhD studentship to me. I am also grateful to Lawrence Leger for being helpful in formulating and organizing the work on Meta - Analysis in the form of a paper, published by Corporate Governance. Amongst others, I am particularly thankful to Professor Eric Pentecost, Professor Chris Green, Or. Richard Simper, and other support staff of the department.
- -- - -
-My referees and teachers from Pakistan have been very supportive throughout and always encouraged me to carry on with further studies. Professors Abid Aman Burki, Chauhdary Muhammad Ali, Ayub Siddiqi have particularly been instrumental in my endeavor.
My colleagues at Sheikh Khalifa bin Zayed Arab Pakistan School in Abu Dhabi also deserve a word of thanks for egging on my plans for leaving the teaching job there for a PhD at Loughborough. Specifically, I am beholden to Mr. AsifMalik, Mr. Aziz-ur-Rehman, Mr. Abdul Baseer, Mr. Jamshaid Ali and Dr. Javeid for their continuous support. Mr. and Mrs. Javeid Iqbal merit special recognition for their very kind help.
My special appreciation is due to Muslim Aid, for providing me relief at times when I was facing fmancial hardship.
There is a long list of my other friends and colleagues in UK and Pakistan, who comforted me whenever I was in need of moral support and help. Marie, Asyraf, Volkan, Usman, Ye, Galia, Ece, Silvio, Geetha, Zeeshan, Kamran, Shahbaz, Sultan, Sadia, Salman, Haliza, Fareed, Tanya, Surge, Yahya, Mustfa, Saif, Kashfi, Mansoor, Saeed, Arooj, Serfraz, Aziz, and Qaim are some to name.
I am greatly obliged to my uncle and aunt, Mr. Muhammad Khaleeq-uz-Zaman and Mrs. Farkhanda Jabeen, for their continuous support in terms of
educational, moral and fmancial needs. Besides that I am glad with my cousin, Wasif for his assistance as and when needed.
Most importantly, my exclusive and supreme thanksgivings go to my father (Mr. Muhammad Aziz-ul-Haq), mother (Mrs. Surayya Jabeen), brothers (imran and
Irfan), sisters (Humeira and Aqsa) and their families (Mehr Nawaz, Riffat, Ambreen) whose motivation and wishes made this study a valued achievement. I am also thankful to my father-in-law (Dr. Yousuf), mother-in-law (Dr. Farida) and brother-in-law (Mansoor) for their best wishes and support. I am also obliged for sincere prayers of Professor Qari Aleem-ur-Rehman and his family.
Finally, I am immensely beholden to my loving wife, Zainab, whose love, sacrifices, encouragement, patience, and prayers enabled me to work day and night in order to make this study a triumph. My alluring sons, Shaheer and Yahya, need to be
conceded as well for their sacrifices and not being too time demanding, enabling me to work with ease.
Abstract
The motivation for empirical research in corporate financial distress prediction is clear - the early detection of financial distress and the use of corrective measures are preferable to protection under insolvency law. Many different models have been used to predict corporate financial distress, and choosing between them for empirical application is not straightforward. One objective of this research is providing a comprehensive review, clarifying the problem of model choice in empirical
prediction of corporate financial distress. To that end, we conduct a Meta - Analysis of the literature reviewed in this thesis. This analysis supports the use of Multiple Discriminant Analysis on rather objective grounds. This study adopts a novel approach by using a large panel ofUK quoted firms (3135) from 1990 to 2004 and develops a multiple discriminant distress prediction model, using 58 firm - specific financial ratios. The results are also compared with cross-sectional data sets and using GDP growth rate as a control variable. We observe best classification performance of the MDA model when the data is cross-sectional and composes of non-financial or industry only firms in it. The trend is downwards, if financial firms are added to the cross section or if a panel data is used for either form of firms' composition. GDP growth does not play a significant role in predictive accuracy of MDA. Another empirical contribution of this research has been to estimate a wide class of duration models for the same large panel of UK firm survival histories. Overall, the empirical results indicate that stock performance and profitability variables play a highly significant role in determining the survival times ofUK firms. Little evidence is given to the role ofliquidity and asset utilization variables and no support for the role
of technology (R&D) is found. Overall, these results are robust across different parametric specifications. Marginal effect ofleveraging on conditional probability of failure is found to be more effective than other variables. Further, the conditional probability of firm rises gradually for the first 8 years and then falls more rapidly thereafter.
Table of Contents
Contents Page No.
Acknowledgement iii
Abstract VI
Table of Contents viii
List of Tables x
List of Figures Xli
List of Appendices xm
Executive Summary xiv
CHI: Introduction and Research Objectives I
1.1: Introduction to the Research Problem I
1.2: Research Objectives 7
1.3: . Organization of the Chapters 10
CH2: A Review of the Literature 13
2.1: Statistical Models of Distress Prediction 14
2.1.1 : Univariate Models 15
2.1.1.1: Univariate Analysis (in the context of distress prediction) 15
2.1.1.2: Empirical Literature 16
2.1.2: Multivariate Models 18
2.1.2.1: Models Based on Discriminant Analysis 19
2.1.2.2: Models Based on Conditional Probability Analysis 40
2.1.2.3: Models Based on Time Series Analysis 61
2.2: Artificially Intelligent Expert Systems (AlES) Models of Distress 72 2.2.1:
Prediction
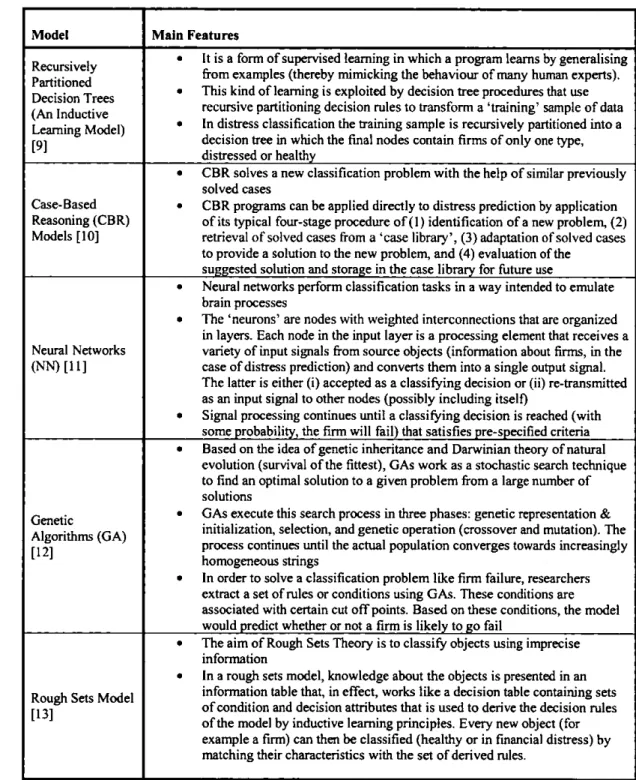
Models Based on Recursively Partitioned Decision Trees (Inductive Learning) 76 2.2.2: 2.2.3: 2.2.4: 2.2.5: 2.3: 2.3.\ : 2.3.2: 2.3.3: 2.3.4: 2.3.5: 2.4:
Case-Based Reasoning Models Models Based on Neural Networks Models Based on Genetic Algorithms Models Based on Rough Sets
Theoretic Models of Distress Prediction Catastrophe Theory
Balance Sheet Decomposition Measure / Entropy Theory Gambler's Ruin Theory
Cash Management Theory of Financial Distress Credit Risk Theories
Methods and Models of Corporate Financial Distress Prediction:
82 86 94 99 103 103 106 110 113 120 129 2.4.1: 2.4.2: 2.4.3: 2.5:
A Summary of the Critique Critiques to Statistical Models Critique to AlES Models Critique to Theoretic Models Conclusion and Observations
129 132 134 137
CID: A Meta Analysis of the Literature Reviewed 139
3.1: Introduction 139
3.2: Methodology of Corporate Financial Distress Prediction 140
3.3: Applications of Corporate Financial Distress Prediction Models 146
3.4: Conclusion and Recommendations 158
CH4: Description of the Data Set 160
4.1 : Introducing the Data Set 160
4.2: Selection of Final Variables 175
CHS: Specification and Empirical Application of Multiple 182
Discriminant Analysis
5.1: Multiple Discriminant Analysis 183
5.2: Empirical Findings of MD A 191
5.2.1: MDA Results from Mix Industry Model: A Panel Data Analysis 192
5.2.2: MDA Results from Industry Only Model: A Panel Data Analysis 198
5.2.3: MDA Results from Mix Industry Model: A Cross-Sectional Data 202
Analysis
5.2.4: MDA Results from Industry Only Model: A Cross-Sectional Data 207 Analysis
5.2.5: Comparing the MDA Results 212
5.2.6: Some Further Extensions of MD A 216
CH6: Specification and Empirical Application of Survival Analysis 233
6.1: Survival Analysis 233
6.2: Empirical findings of Survival Analysis 242
6.3: Some Further Extensions of Survival Analysis 255
CH7: Conclusions and Recommendations 284
References 291
List of Tables
Tables
3.1: Categories of prediction models 3.2: Different types of Statistical models 3.3: Different types of AIES models 3.4: Different types of Theoretical models
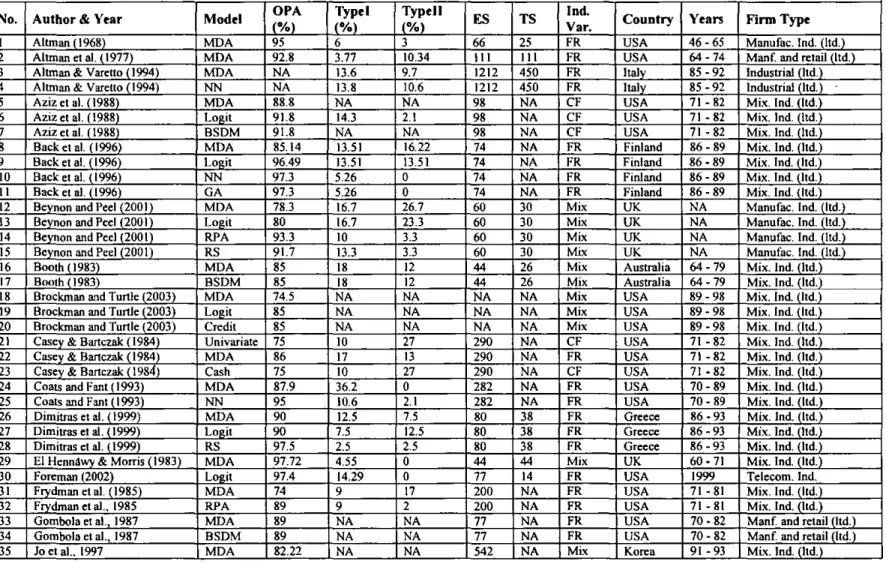
3.5: Summary of previous research attributes and fmdings 3.6: Summary Statistics (individual models)
3.7: Summary Statistics (individual countries) 4.1: The Number and Type of Firms Used
4.2: Breakdown of categories of financial distress according to firm type 4.3: Breakdown of categories of financial distress according to year and
respective firm type
4.4: Descriptive statistics after correcting for outliers (Mix Industry) 4.5: Descriptive statistics after correcting for outIiers (Industrial) 4.6: Descriptive statistics after correcting for outIiers (Financial) 4.7: Components and Variance
4.8: List of variables selected after Factor analysis
5.1: Stepwise selected variables with respective categories 5.2: Classification results of MDA using mix industry panel data 5.3: Stepwise selected variables with respective categories 5.4: Classification results of MDA using industry only panel data 5.5: Stepwise selected variables with respective categories
5.6: Classification results of MDA using mix industry cross-section data 5.7: Stepwise selected variables with respective categories
5.8: Classification results of MD A using industry only cross-section data 5.9: Comparing MDA models
5.IOA: Stepwise selected variables with respective categories 5.IOB: Classification results of MD A using mix industry panel data 5.11A: Stepwise selected variables with respective categories 5.11B: Classification results of MD A using industry only panel data 5.12A: Stepwise selected variables with respective categories
5.12B: Classification results of MD A using mix industry cross-section data
5.13A: Stepwise selected variables with respective categories
5.13B: Classification results of MD A using industry only cross-section data
5.14A: Stepwise selected variables with respective categories
5.14B: Classification results of MD A using mix industry cross-section Data for I 992
5.15A: Stepwise selected variables with respective categories
5.15B: Classification results of MD A using industry only cross-section Data for 1992
5.16A: Stepwise selected variables with respective categories
Page No. 141 142 143 144 147 153 157 162 166 167 169 172 173 177 181 192 196 198 201 203 206 208 211 213 217 218 219 220 221 222 223 224 225 226 227 228 229
5.16B: Classification results of MDA using mix industry cross-section 230 Data for 2002
5.17 A: Stepwise selected variables with respective categories 231
5.17B: Classification results of MD A using industry only cross-section 232 Data for 2002
6.1: Parametric Survival Distributions 241
6.2: Parameter estimates of accelerated hazard models 244
6.3: Estimated Kaplan-Meier hazard function 249
6.4: Estimated Kaplan-Meier survival function 250
6.5: Parameter estimates of Cox Proportional model 253
6.6: Parameter estimates of accelerated hazard models with GDP 257
6.7: Parameter estimates of Cox Proportional model with GDP 259
6.8: Post estimation marginal effects (Accelerated hazard models) 261
6.9: Post estimation marginal effects (Cox proportional model) 262
List of Figures Figures
3.1: Proportion of model categories employed by past studies
3.2:
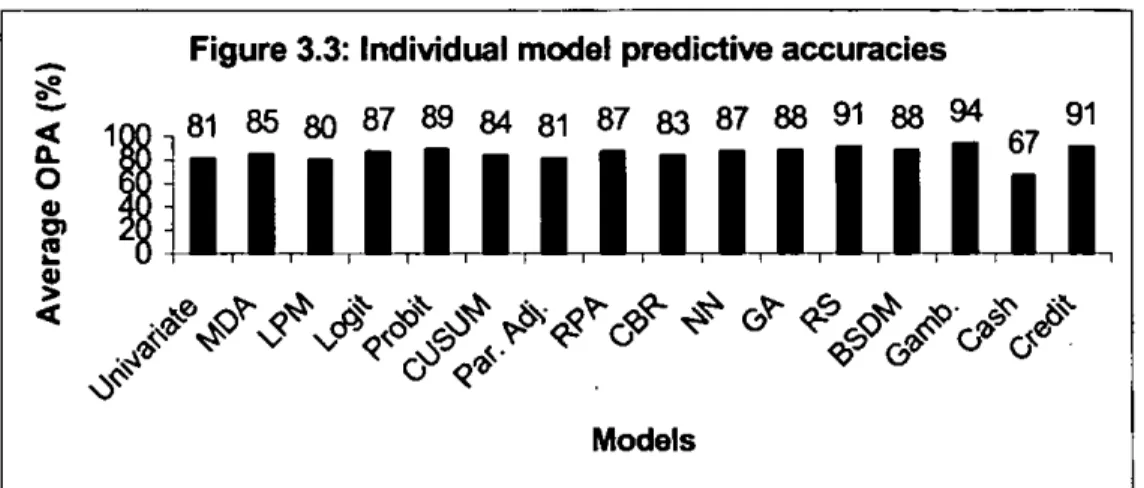
Proportion of models employed by past studies 3.3: Individual model predictive accuracies3.4: Overall predictive accuracies of different approaches 3.5: Type I errors of the models
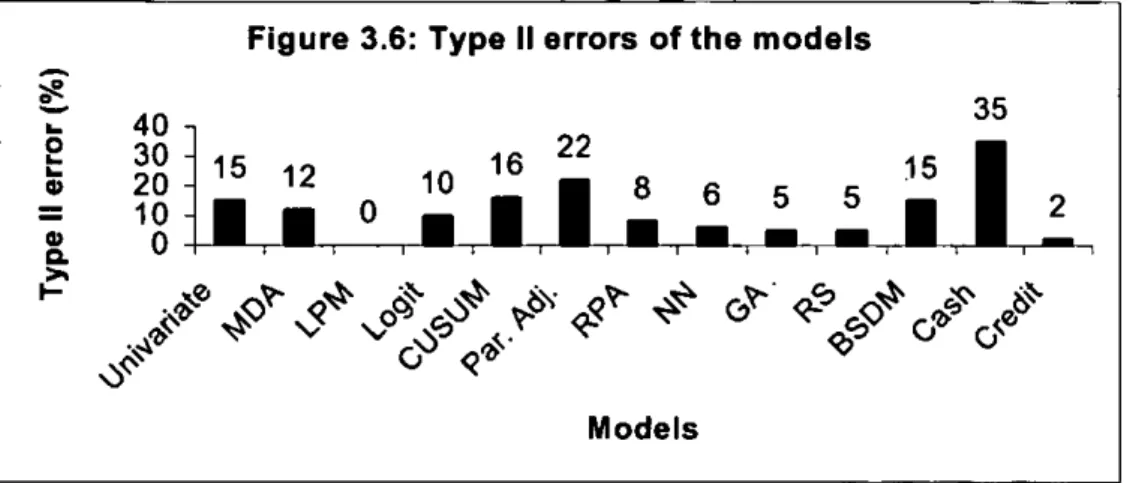
3.6: Type II errors of the models 4.1: Scree plot
6.1: Kaplan Meier Hazard function 6.2: Kaplan Meier Survival function
6.3: Graphical test of proportional hazard assumption (GDP Growth) 6.4: Graphical test of proportional hazard assumption (ACC_REC.) 6.5: Graphical test of proportional hazard assumption (ASS_EMPit) 6.6: Graphical test of proportional hazard assumption (CAP _EXPFASSit) 6.7: Graphical test of proportional hazard assumption (CAP _EXPit) 6.8: Graphical test of proportional hazard assumption (CASH_ASSTSit) 6.9: Graphical test of proportional hazard assumption (CASH_DIVit) 6.10: Graphical test of proportional hazard assumption
(CAS_DN]LWit)
6.11: Graphical test of proportional hazard assumption (COST_SALESit) 6.12: Graphical test of proportional hazard assumption
(PROF _MARGINi,)
6.13: Graphical test of proportional hazard assumption (INV _ASSTSit) 6.14: Graphical test of proportional hazard assumption
(NSALES_ WCAPit)
6.15: Graphical test of proportional hazard assumption (PRICE_ VOLTYi,)
6.16: Graphical test of proportional hazard assumption (pRICE _ CASHit) 6.17: Graphical test of proportional hazard assumption (QUICK;,) 6.18: Graphical test of proportional hazard assumption (R&D_SALESit) 6.19: Graphical test of proportional hazard assumption (RET _ EARNit) 6.20: Graphical test of proportional hazard assumption (SALES_EMP.) 6.21: Graphical test of proportional hazard assumption (INVEST _ RETi,)
Page No. 151 151 153 154 155 156 176 249 250 265 266 267 268 269
270
271 272273
274
275 276 277 278 279280
281 282283
Appendices Appendix No.
Appendix I: List of abbreviations used in Table 3.5
Appendix 1I: Description of financial ratios used for empirical analysis Appendix 1II: Correlation Matrix
Page No. 313 314 319
Executive Summary
The motivation for empirical research in corporate financial distress
prediction is clear - the early detection of financial distress and the use of corrective measures are preferable to protection under insolvency law. Many different models have been used to predict corporate financial distress. These methods all have their particular strengths and weaknesses, and choosing between them for empirical application is not straightforward. There have been several reviews of this literature but these are now either out-of-date or too narrowly focused. None of these studies provides a complete comparison of the many different approaches towards prediction of corporate financial distress. The studies have also failed to provide a solution to the problem of model choice in empirical applications.
One primary objective of this research is, hence, providing a comprehensive review, clarifYing the problem of model choice in empirical prediction of corporate financial distress and suggesting some directions for future research. The study achieves this objective by conducting a Meta - Analysis of the literature reviewed in this thesis.
In empirical applications of these models to the case of UK corporations, with only a few exceptions, the researchers have worked with a sample size of about 100 or less quoted firms. In almost all UK studies, cross-sectional information on finns, usually one year prior to firm's death, is obtained to develop the prediction models.
Albeit useful, models developed with such data are likely to perform less efficiently
for horizons of financial distress longer than one year. Models based on panel data may prove more useful and convincing. To that end, this study adopts a novel
approach by using a large panel ofUK quoted firms (3135) and develops a multiple
discriminant distress prediction model, using firm - specific financial ratios. To
compare the results, we also develop the discriminant model using a cross-sectional
data set of the same firms. To see if firm failure follows the economy's business
cycle, we also introduce GDP growth rate as a control variable.
A key issue in the Industrial Organization literature is identification of the
factors that determine the entry and exit of firms. These studies have employed an
array of analytical techniques, although the preferred approach is survival analysis in
order to model the duration of firm survival. Albeit useful in providing some insight
into exit behavior of UK finns, the studies for UK arguably suffer from a paucity of
substantive quantitative results and so not make sufficient use of survival analysis. In
particular, to date, firms' financial ratios have not been used in survival analysis of
UK corporations. The final aim of this study has, therefore, been to empirically
contribute by estimating a wide class of duration models for a large panel data set of
UK firm survival histories. The methodology allowed for the incorporation of
time-varying fmn-specific financial ratios to impact on the duration of survival in
accelerated hazard models and on the hazard failure rate in the Cox Proportional
hazard model. Post estimation marginal effects are also calculated to gauge the unit
impact of change in respective covariate on the conditional probability of failure.
Meta - Analysis, through a critical analysis of a large number of empirical
studies of corporate fmancial distress prediction based variously on statistical, AlES
and theoretical models, indicates that there is still substantial disagreement over the
analysis shows that statistical techniques (MDA and Logit models in particular) have been most frequently used, that the AlES approach is relatively new and that
theoretical models are relatively uncommon. While predictive accuracy was observed to be generally good across all models, the review also suggests that AlES and theoretical models have slightly better average predictive accuracy than statistical models; although this measured superior performance is based on a smaller number of studies. On the other hand, the consistently high predictive accuracy of MD A model and its low Type I and 11 error rates were achieved in a relatively large number of studies suggesting that MDA may provide overall the most reliable method of distress prediction.
Using MDA model to undertake the prediction task, we observe best classification performance of the MDA model when the data is cross-sectional and composes of non-fmancial or industry only firms in it. The trend is downwards, if financial firms are added to the cross section or if a panel data is used for either form of firms' composition. This trend is consistent, with slight variations, in case of hold out and cross-validation as well. The latter two methods serve as measures of
goodness of fit in case of binary models like MDA. The overall measures of goodness of fit seem to be quite encouraging and hence support the use of MDA. Although GDP enters MDA in determining overall prediction rate of the model, its impact on the predictive accuracy is not significant.
Another empirical contribution of this research has been to estimate a wide class of duration models for a large panel data set ofUK firm survival histories. Overall, the empirical results indicate that stock performance and profitability variables play a
highly significant role in determining the survival times of UK firms. Little evidence is given to the role of liquidity and asset utilisation variables and no support for the role of technology (R&D) is found. Overall, these results are robust across different parametric specifications. Marginal effect of leveraging on conditional probability of failure is found to be more effective than other variables. It is also observed that the conditional probability of firm failure rises gradually for the first 8 years and then falls more rapidly thereafter.
CHI: Introduction and Research Objective
1.1 Introduction to the research problem:
A firm is considered in financial distress when it has significant trouble paying its debts 'as they become due. Reorganization, receivership, acquisition, liquidation, bankruptcy and others are all commonly used terms to describe a financially distressed firm. Financial distress can occur in any firm as part of its natural life cycle, Firms operate in competitive markets, In the face of intense competition, some firms succeed while others fail. Before actually failing, poor performers exhibit signs of fmancial distress. Often a finanCial restructuring in the form of reorganization is required to resolve this condition. If the distress cannot be resolved then tbe firm must be given to the receivership, where the firm will either be liquidated or acquired by someone else (may be under a different name and as a new entity altogether).
Formal bankruptcy is time-consuming and expensive. That is why financially distressed firms usually try to reorganize/restructure outside bankruptcy before filing for formal bankruptcy. Firms may do so either by exchanging new securities for existing securities; by amending the terms of outstanding securities; or, by
repurchasing existing securities for cash. Failure to do so results in the formal filing of bankruptcy by the distressed firms in the court of law. Reorganization allows a distressed, but otherwise economically viable, firm to survive as a going concern. Therefore, under a formal bankruptcy process even, reorganization is sought first where a plan is developed to reorganize the debtors business and restore its financial health. Another available option is 'pre-packaged bankruptcy', where the debtor and
creditors negotiate a plan of reorganization and file it along with the bankruptcy petition.
When the prospects of reorganizing a debtor's business are so poor that it seems unreasonable to invest further time and financial resources in the effort, the only alternative is liquidation. In liquidation, the assets of the firm are sold, usually piecemeal, and the cash proceeds are paid to the firm's creditors according to strict rules of priority. Liquidation is preferable to reorganization when selling the debtors assets would produce more value than what debtor's reorganization may come up with. Here the aggregate liquidation value of all of the debtor's assets, less the costs of the liquidation process, is compared to the reorganization value. Liquidation can take the form of either an assignment (a private method of disposition) or a formal court-supervised liquidation.
Although most common indicator of corporate fmancial distress, corporate bankruptcy is only one form of financial distress faced by corporations. Other types include de-listing of firms from the stock exchange, default on bank loans, auditors' dissatisfaction reflected in their qualification reports, significant decline in profits, and a major set back to the stock price. In this study, word bankruptcy may
occasionally be used to represent corporate financial distress of all types leading to reorganization, receivership, filing offormal bankruptcy, liquidation, cancellation of listing, de-listing, and acquisition. In practice, as well, various forms of corporate fmancial distress ultimately lead to corporate bankruptcy, if distress continues to prevail.
\ Recent experience has taught us an important lesson: Even very large finns
can fail. WorldCom, Enron Corp., Global Crossing Ltd., Pacific Gas and Electric Co.,
Kmart Corp., FINOV A Group, Inc., Reliance Group Holdings, Inc., and F
ederal-Mogul Corp. are among the largest and recent most examples of corporate financial
distress in the United States. Pre-bankruptcy assets of these corporations reflect that
they all owned billions of dollars at the time of filing bankruptcies.
WorldCom filed the largest Chapter II bankruptcy in the history of USA in
May 2002. It had over $43 billion of liabilities at the time of filing. The collapse of
Enron spread over several months during 2001. The Texas-based energy-trading
giant, once America's seventh-biggest company, declared bankruptcy on December
2nd, 2001.The total pre-bankruptcy assets of the corporation were figured nearly $ 63
billion. Its failure was a result of mixed factors and yet under debate by the experts
[New Generation Research Inc. (2002)]. Similarly Kmart Corp. became the 7th largest
bankruptcy ofthe United States by filing a fonnal bankruptcy on 22nd January 2002.
Selling approximately $ 37 billion of goods each year, and employing roughly
250,000 workers, Kmart was the nation's second largest discount retailer and the third
largest general merchandise retailer. The pre-bankruptcy assets of Kmart amount to
nearly $17 billion. However, nothing could stop it from becoming bankrupt
[Bankruptcy Creditors' Service, Inc. (2002)]. Nonetheless, the fates of World Co m,
Enron, and Kmart have made the world cautious about investments even in the big
corporations.
Recent experience has also highlighted the risk in leveraged buyouts. In a
However, under the principle of Risk-Return Trade-Off, leveraged buyouts also had an exceptionally high risk of fmancial distress. This became evident in the 1990s, when many of these firms began to crumble down owing to their crushing debt loads.
The number of business failures is accelerating in the United States. But this experience is not limited to the Unites States alone. Recent data indicate that the number of failures can be as low as 224 in the case of Hong Kong or as high as 50,000 plus in the case of the United States [McHugh C.M. (1995)]. According to Teikoku Databank (2002), the total number of corporate bankruptcy (both public and private) during 2002 in Japan is totaled to 19,458. The Insolvency Service (2001) of UK reports a total of21,549 corporate bankruptcies (both public and private) in the UK during 200 I. UK figure includes all types of liquidations, receiverships, voluntary arrangements, and administrative appointments.
Recent fmancial crises and distress have drawn attention to the importance of efficient mechanisms to resolve such sufferings of corporations. An evident American credit risk from declining capacity utilization, a rash ?f credit downgrades, wider credit spread-outs, rising default rates on corporate bonds and an increased level of bankruptcies are some indicators of financial distress in the United States. Japanese credit risk has risen and is likely to worsen further in the short-term. Dun &
Bradstreet reports corporate bankruptcies in June increased by 0.2% on year-on-year to reach the fourth highest figure since the Second World War. Asian economies, in general, experienced a harsh recession as currency and fmancial crises exerted a greater influence on them than expected.
---~---Financial distress owes its existence to deterioration in a finn's business. There can be many causes for such failures. Poor management, unwise expansion, intense competition, voluminous debt, massive litigation, continuing recession, recent capital market volatility, unsuccessful sales and marketing initiatives, commercial misfortune, personal crookedness, unregulated auditors, conflict of interests in accounting finns, unfavourable contracts and the accounting standards may be named as few possible causes. The question arises as to what has caused the world to face this situation and, in particular, why bankruptcy is being used as a tool to resolve the financial distress?
In one sense fonnal bankruptcy is desirable, for it prevents further losses. But it is nevertheless true that a method of eliminating losses at an early date would be preferable to bankruptcy from both social and private point of views. If corporations were likely to face significant fmancial distress at some stage of their life, the corporate lenders would certainly wish to secure their invested capital or the likely investment plans into those corporations by predicting such distress well before they actually happen. Similarly, every corporation would avoid going bankrupt and like to know if there are any potential dangers of facing critical financial distress in future. What implies is that predicting financial distress in advance, including possibility of default or bankruptcy, is of significant use to both corporate lenders and borrowers.
As stated by Morris (1998), trying to identify failing companies as early as possible is clearly a matter of considerable significance to businessmen and other interested parties. For instance, if an investor or creditor is able to predict a company on the path to bankruptcy before anyone else, he or she will be able to liquidate the
investment or obtain settlement of a debt and so minimise losses. Similarly, it is vitally important for an auditor in preparing his or her report to be able to assess whether or not a company is a going concern.
It, therefore, becomes vital to develop means and ways to identify ftrms having problems that could ultimately lead them to the failure, and it is this theme that is being pursued in this study. Many academicians have developed distress prediction models to that end. Some of these models are under extensive use by the present day ftnancial institutions, ftrms and interested individuals. These models have based their predictions on a variety of analytical techniques. Among others, these techniques include multiple discriminant analysis (MDA), conditional probability
analysi~ (CPA) including logit, probit and survival analysis, time series analysis,
recursively partitioned decision trees, neural networks, genetic algorithms, and rough sets. Other models are based on theories like cash management and option pricing approaches.
In fact, there is a wide spectrum of such prediction models. What follows in the next chapter is a critical review of these models in terms oftheir methodologies and application. This review, though extensive, is not exhaustive in nature. The study divides these models into three broad categories: Statistical Models, Artiftcially Intelligent Expert System Models, and Theoretic Models. This is a very loose classiftcation and is only meant for better understanding of the literature to be reviewed.
1.2 Research ohjectives:
As discussed at length, the significance oftimely identification of firms' state of financial distress is of utmost importance to all those concerned. Largely prevalent throughout the world, the phenomenon is equally important for the UK. According to National Statistics (2005), there were 3,342liquidations in England and Wales in the second quarter of 2005 on a seasonally adjusted basis. This was an increase of 12.5% on the previous quarter and an increase of 6% on the same period a year ago. This was made up of I ,286 compulsory liquidations, an increase of 14.6% on the previous quarter and an increase of 11.6% on the corresponding quarter of last year, and 2,056 creditors voluntary liquidations, an increase of 11.2% on the previous quarter and an increase of2.8% on the corresponding quarter of last year. 0.7% of active companies went into liquidation in the twelve months ended Q2 2005, the same as the previous quarter and a decrease on the corresponding quarter of2004.
This is the case of liquidation only, the most undesirable form of financial distress. The figures on companies in the process of reorganization, receivership, acquisition (as a result of formal bankruptcy filings) and similar other states are in addition to liquidation cases. Hence, corporate financial distress is something alarming indeed, even in case ofUK. As will be seen in later part of the study, there
remains still much of a potential for academic research in this area. In particular, there is an ever demanding need to develop models of distress prec1iction.
Many different models have been used to predict corporate fmancial distress. These methods all have their particular strengths and weaknesses, and choosing between them for empirical application is not straightforward. There have been
several reviews of this literature but these are now either out-of-date or too narrowly focused(Scott, 1981; Zavgren, 1983; Altman, 1984; Jones, 1987; Dimitras et ai.,
1996; Morris, 1998; Zhang et al., 1999; Crouhy et al., 2000). None of these studies
provides a complete comparison of the many different approaches towards prediction of corporate financial distress. The studies have also failed to provide a solution to the problem of model choice in empirical applications. One common feature of
applications of such models to the case of corporations in OK and other countries is that selection of prediction model is rather subjective. There is, therefore, a place for an up-to-date comparative review. One primary objective of this research is, hence, providing such a comprehensive review, clarifying the problem of model choice in empirical prediction of corporate fmancial distress and suggesting some directions for future research.
While undertaking empirical applications of these models to the case of OK corporations, with only a few exceptions, the researchers have worked with a sample size of about 100 or less quoted firms. Nasir et al. (2001), Lennox (1999), and Dunne
& Hughes (1994) are amongst the few exceptions and have worked with sample sizes of 1800, 949, and 2149 firms, respectively. In fact, Dunne & Hughes (1994) also include larger unquoted firms in their sample. In almost all UK studies, cross-sectional information on firms, usually one year prior to firm's death, is obtained to develop the prediction models. Albeit useful, models developed with such data are
likely to perform less efficiently for horizons of fmancial distress longer than one year. Models based on panel data may prove more useful and convincing. Hence, there is a need to assess if prediction models work better with panel data sets and that
if the size of dataset matters. This particular need forms the basis for our study's second major objective, whereby the study benefits from the outcome offrrst research objective. Pursuant to second objective, this study intends to choose the best model identified under the frrst research agenda and collects the largest possible panel dataset for UK quoted firms.
A key issue in the Industrial Organisation literature is identification of the factors that detennine the entry and exit of firms. Most of the empirical literature explores US firms. For example, Caves (1998) provides a detailed account of US and other country studies, including the UK. A major concern of these studies has been the identification of those fmn-Ievel characteristics that enable them to survive over time. These studies have employed an array of analytical techniques, although the preferred approach is survival analysis in order to model the duration of firm survival.
Albeit useful in providing some insight into exit behaviour of UK firms, the studies
for UK arguably suffer from a paucity of substantive quantitative results and so not make sufficient use of survival analysis. [Baden-Fuller, 1989; Dunne and Hughes, 1994; Geroski et aI., 1997; Disney et aI., 2003). For example, a large amount of research is centered on firms' qualitative attributes based on surveys, measures of firm growth, proxies for corporate governance, and other similar characteristics. In
contrast, very little attention has been paid to information on firms' financial status over time. In particular, to date, firms' financial ratios have not been used in survival analysis ofUK corporations. Similarly, basic statistical techniques of descriptive statistics and ordinary regressions have been employed to investigate the problem. Though useful, the research would have been more insightful and rigorous with the
application of parametric and non-parametric techniques of survival analysis.
Comparing results from the non-parametric Cox proportional hazard model and those obtained from parametric models are arguably required to test the robustness of results. Hence, third and final aim of our research is to use the panel data (collected to perform the task explained for second objective) to identify the factors that determine the entry and exit of firms.
1.3 Organization ofthe chapters:
With clearly defined aims and objectives of this study, the research is organised in the following manner. Chapter two presents an extensive review of the relevant literature on different models of corporate financial distress prediction and their empirical applications across the world economies. To gain maximum amount of benefit from the reviewed literature and develop an unbiased understanding of the subject, this chapter also presents a criticism on each type of prediction methodology and model. The overall impression gathered from this extensive review ofliterature has been somewhat confusing in the sense that we could not trace any objective justification in favour of one model over the other.
To solve the problem of appropriate model choice in empirical prediction of corporate fmancial distress, chapter three conducts a Meta - Analysis of the empirical findings of the literature reviewed. Meta - Analysis is the application of statistical procedures to collections of empirical findings from individual studies for the purpose of integrating, synthesizing, and making sense of them. We use this method to be able to choose an appropriate prediction model from amongst many.
In line with the results of Meta - Analysis and relatively easy availability of
information on firms' financial ratios, the study benefits from the largest dataset ever used in case ofUK for similar studies. Our sample consists of3135 quoted UK fmancial and non-financial finns, of which 1347 faced some kind offmancial distress during 1990 - 2004 while remaining 1788 firms entered the sample period as active and remained so until the end of sample period. Details of the dataset are subject matter of chapter four.
As will be seen in chapter three, the objective choice for prediction task has been the Multiple Discriminant Analysis (MDA). Chapter five specifies MDA model in sufficient detail. In the same chapter, empirical application of MDA (to predict corporate fmancial distress for UK listed finns) is exercised using the data set described in chapter four. Best classification and prediction performance of the MDA model is observed, when the data is cross-sectional and composes of non-financial or industry only finns in it. The trend is downwards, if financial firms are added to the cross section or if a panel data is used for either form of firms' composition. This trend is consistent, with slight variations, in case of hold out and cross-validation as well. The latter two methods serve as measures of goodness of fit in case of binary models like MDA. The overall measures of goodness of fit seem to be quite encouraging and hence support the use of MDA.
In order to identifY the factors that determine entry and exit behaviour of the
. firms, this study uses both parametric and non-parametric techniques of survival analysis as well. Cox proportional hazard model represents the former, while accelerated hazard models (Exponential, Weibull, Log-Logistic, and Lognormal) are
used for the latter. These models are specified and their empirical application
observed in chapter six. Overall, the empirical results indicate that stock performance
and profitability variables play a highly significant role in determining the survival
times of UK firms. Little evidence is given to the role of liquidity and asset
utilisation variables and no support for the role of technology (R&D) is found.
Overall, these results are robust across different parametric specifications.
Chapter seven concludes the study with a summary of its research findings
and a discussion on further avenues of research. It is noted in particular that corporate financial distress has assumed considerable place in corporate finance literature. That
whatever form it may take, distress is certainly not desirable and an early detection of
impending distress in a corporation is always useful. Search for best distress
prediction models is still in progress. The study proposes an objective criterion for
this search. It is suggested that future research may benefit more from larger data sets. If the objective is prediction only, then using Multiple Discriminant Analysis with
cross-sectional information might be helpful. It may help and be less objectionable if financial firms are kept separate from non-fmancial firms, especially if the reliance is
made on fmancial ratios only. Finally, for a useful survival analysis and to see which
CH2: A Review of the Literature
Distress prediction has always been a phenomenon of great interest to corporate lenders and borrowers. Academicians have been trying to develop models capable of predicting corporate failure. Although quantitative models started to emerge by early 1930s, there have been attempts of judgments made on qualitative basis in earlier times. For example, Altman (l968) mentions the name of forerunner of well-known Dun & Bradstreet that was organised in Cincinnati, Ohio. It provided independent qualitative credit investigations in those early times.
Early quantitative prediction attempts include Fitzpatrick (1932), Smith and Winakor (1935) and Merwin (1942), which compared fmancial ratios of two groups of firms (failed and non-failed) and traced significant differences across the groups. They based their prediction criterion on these differences in financial ratios and set a stage for later researchers. In general, they identified that the financial ratios of the failed firms, before actually failing, exhibited significant differences from their non-failed counterparts.
Since 1930s, distress prediction has been a subject of greater interest to financial analysts. Indeed, an impressive body of theoretical and empirical research has been evolved since then. There seems to be an undisputed consensus that actual part of this evolution started in 1960s. Availability of computer technology and the practice of employing rather complex statistical techniques, since 1960s, justify this evidence. Little has been done in pre I 960s era due to such limitations. Nevertheless, contributions made by early analysts serve as the foundation stone for all future endeavours in the field of corporate financial distress prediction.
IdentifYing an appropriate time frame (1960s to date), the study focuses on research activities of academicians that have resulted into a wide variety of distress prediction models so far. To present its case, the study has divided these models into three broad categories based on the nature of analytical technique employed by them. This classification differs from previous categorisations: Normative models and Positive models [Morris (1998») or bifurcation of bankruptcy prediction models based on 'financial ratios' or 'cash flow components' [McGurr and DeVaney (1998»). For the purpose of this study, classification is based on the analytical technique / methodology of these models.
While reviewing literature on the subject, a brief description of the
methodology, as employed by the prediction models, is presented first. A review of some selected studies, based on respective methodologies, is stated next.
2.1 Statistical Models of Distress Prediction:
A vast majority of prediction models, like in any other field, have been developed in corporate [mance literature with the help of ever-useful statistical and mathematical techniques. A statistical analysis could be univariate or multivariate in nature. In distress prediction context, researchers have attempted both ways.
Multivariate analysis, however, remains dominant for a variety of reasons to be discussed in a later section. A number of textbooks on statistics explain difference between the two in a general framework with sufficient detail. In the context of corporate financial distress, reasonably good but brief reference could be Altman (1993) and Morris (1998).
2.1.1 Univariate Models:
2.1.1.1 Univariate analysis: in the context of distress prediction
Univariate analysis, in the context of this study, is a traditional method of interpreting financial statements of the companies. In particular, these fmancial statements are the firms' financial ratios. These ratios serve as explanatory variables or the distress predictors, to be more specific. The nature of analysis is, however, univariate in the sense that the variables are observed and examined one after the other. There is no allowance for an analysis capturing an integrated effect of any two or more variables together on financial health of the firm. After a careful analysis, researchers would provide certain inferences.
Univariate models depend on financial ratios ofthe firms that are obtainable from their balance sheets and profit and loss accounts. Analysts tend to be very careful while selecting and interpreting these ratios. Normally, they would keep in mind the following points:
• A group of ratios can explain almost similar characteristics of a firm. One must select the most appropriate ratios only.
• Ratios are interdependent in general. Care must be exercised while a univariate inference is made.
• The numerator and denominator of the ratios are assumed to be strictly proportionate.
• Ratios across industries, particularly in terms of industry averages, do differ from each other.
Traditional ratio analyses, under univariate models, generally focus on a firm's long-term and short-term financial health in terms of profitability and
efficiency. Analysts check long-term financial health of the firm by looking at its cost structure, the pattern of revenue receipts, and the redemption terms and available security. Whereas balance sheet ratios, mixed balance sheet / profit and loss account ratios, flow of funds analysis, and the interval ratios help researchers assess short term financial health of the firm. Finally, observing firm's profitability and efficiency against a pre-set benchmark assesses the performance of a firm. This benchmark could be a forecast standard, a level of past performance, or a rival's performance.
2.1.1.2 Empirical Literature:
It is explained above what can be termed as the traditional ratio analysis under univariate models. However, as mentioned by Morris (1998), analysis of ratios in application of univariate models to distress prediction studies is rather systematic than traditional. It is because in these studies, populations offailed and non-failed
companies are selected and then each of a number of ratios is tested to see which one best classifies the two groups of firms over a number of years prior to failure.
Most of the studies that employed univariate methodology were the attempts before I 960s. As mentioned before, Fitzpatrick (1932) is the first to use univariate analysis to predict business failure. For his sample of 19 matched pairs of companies, the best discriminators were net profit / net worth; and net worth / debt. Later, Smith and Winakor (1935) and Merwin (1942), covering over 900 firms, attempted a similar analysis and found that failing firms exhibit Significantly different ratio measurements than continuing entities [Morris (1998) and Altman (1993)].
It is, however, agreed that Beaver (\966) made the first modern univariate analysis of distress prediction. Beaver performed a univariate analysis of financial ratios to predict corporate bankruptcy in USA. He selected a sample of 79 failed and 79 non-failed firms from 1954 to 1964 using a paired sample method. For each of the five years prior to failure, he computed 30 ratios. Performing a dichotomous
classification test, Beaver selected 6 variables as best. He observed that the average failed firm showed substantial deterioration as the year of failure approached unlike average non-failed firm whose performance was relatively constant. The best discriminators were working capital funds flow / debt (which identified the firms correctly in 90 percent of cases one year prior to failure); and net income / total assets (which had a success rate of 88 per cant at a similar stage). His major finding was that financial ratios or more generally, accounting data, have the ability to predict failure for at least five years before failure [Altman (\993) and Morris (\998)].
Beaver's work is considered to be a pioneering contribution in the field of distress prediction. Yet, due to inherent weaknesses of univariate analysis and popularity of multivariate analysis, not many studies have based their analysis on univariate models after him. One notable exception is the study of Casey and Bartczak (1984). They assessed the discriminatory power of operating cash flow (OCF) and some of its variants in a univariate manner. Comparing 60 failed US companies against a control sample of230 businesses, they could correctly classifY 90% of bankrupt firms one year prior to bankruptcy and 92% two years before. However, the discriminatory power was far worse for non-failing firms, i.e., only 53% and 44% for the same years. In fact, overall accuracy for OCF was only slightly
better than chance (50%) for the first and second years before failure and was worse than chance for the remaining years. They also compared the performance of their univariate model against a multivariate discrminant model based on six accrual-based financial ratios. This was far superior in classifYing failing and non-failing firms. They concluded that cash flow variables were probably not useful in classifying non-failing finns.
2.1.2 Multivariate Models:
A number of introductory books on Statistics include chapters on multivariate techniques, but specialized books on multivariate statistics are available too. Flury and Riedwyl (1988) is a good specialised reference book. For a rigorous
mathematical approach towards multivariate analysis, one may refer to Chatfield and Collins (1980).
Multivariate prediction models, in corporate fmancial distress context, tend to analyse fmancial health of the firm in a more realistic way. Here two or more
independent variables are analysed to assess how together they appear to be able to distinguish between companies that face financial distress and those, which do not.
The set of independent variables, in such models, may not necessarily comprise fmancial ratios only, although many models still rely on fmancial ratios. Independent variables could take the form of financial ratios, non-fmancial characteristics of the finns, and / or other quantitative / qualitative explanatory concerns. Nature of these variables will become clear shortly, when these models are reviewed in further detail.
The usual approach followed in developing multivariate failure prediction models, like in univariate case, remains the same. Usually a pair of matched sample of distressed and healthy firms is selected. Matching criteria could be year, size and industry membership.
Altman (1968) is credited to develop first multivariate failure prediction model, followed by a number of other multivariate models that tend to differ in the underlying statistical argument. Remainder of this section reviews major multivariate distress prediction models and their empirical applications.
2.1.2.1 Models based on discriminant analysis:
A basic statistical method in regression analysis requires a continuous dependent variable. However, many attitudes, behaviours, decisions and events are measured in discrete or non-continuous ways. One such example is classification of firms as distressed or healthy. A number of statistical methods are available to analyse such situations including discriminant, linear probability, logit, and probit analyses. Former is unique in its methodology and hence discussed separately. A discussion on the other three is also presented subsequently.
Methodology:
The discriminant analysis is a type of multivariate technique that allows the researcher to study the differences between two or more groups of objects with respect to several variables simultaneously. We present a brief understanding of discriminant analysis in forthcoming lines that is more in line with Klecka (1981), Altman (1993) and Morris (1998). Klecka (1981) provides an excellent discussion on the subject and might be referred to for a comprehensive understanding of
discriminant analysis. For an in-depth study of discriminant analysis, a recommended text is Huberty (I 994}.
Discriminant analysis is used to classify an observation into one of several a priori groupings dependent upon the observation's individual characteristics. In this
sense, discriminant analysis is concerned with allocating an individual to one of several groups on the basis of a number of measurements on the individual. It is used primarily to classify and / or predict in problems where the dependent variable appears in qualitative form. Examples include male or female, well or sick, and failed or non-failed.
Mathematical model of discriminant analysis is based on certain crucial assumptions. If these assumptions are violated, the statistical results will not be a precise reflection of reality. Most important of these assumptions are: (I) No
discriminatory variable may be a linear combination of other discriminating variables, (2) For many applications, discriminant analysis requires popUlation
variance-covariance matrices to be equal for each group, (3) It is also assumed that each group is drawn from a population, which has a multivariate normal distribution.
Assumptions, mentioned above, constitute the mathematical model of the discriminant function (s) on which the most common approaches to discriminant analysis rest. A canonical discriminant function, under above assumptions, is a linear combination of the discriminatory variables of the following form:
Z
=a+p,X,+p,X,+ ... -P.X.···-[2.1]
where;
Z = transformed value (score) of [2.1], used to classify the object (analogous to dependent variable)
Cl = a constant term (exclusion of this term would not matter, though)
{3,
=
discriminant coefficients, which produce the desiredcharacteristics in the function (computed by the discriminant function)
X, = values of independent discriminatory variables
In passing, note that most research situations involve only one or two discriminant functions, although it is possible in theory to have more than two functions. Fortunately, distress prediction studies involve only one discriminant function assuming the simplest possible form of discriminant analysis.
Researchers often encounter situations in which they have several potential discriminatory variables but they are uncertain whether all of them are valuable and necessary. Unless there are strong theoretical reasons for keeping them, it is advisable to eliminate weak or redundant variables. Their presence only complicates the
analysis and they may even increase the number of misclassifications. One way to eliminate unnecessary variables is by using a stepwise procedure to select the most useful discriminatory variables. Stepwise procedure could work in any of the three ways: forward, backward, and mixed. Stepwise procedure is only one way of variable selection. Other methods include 'scaled vector test', 'separation of means test', 'conditional deletion test', and 'univariate F-statistic.
Apparently, it seems that the estimation of equation 2.1 is an easy and simple task and one would be able to get estimates on discriminant coefficients by applying OLS method of estimation or either of its variants. However, this is not the case here
due to the nature of Z that is actually a resultant score of linear combination of X variables in equation 2.1. These days, many softwares provide the estimates of discriminant coefficients quite easily. These estimates are obtained following a specialized discriminant model estimation procedure.
Next step is classification or prediction. Classification is the process by which a decision is made that a specific case belongs to one particular group. This decision is based on the information carried by the discriminatory variables. There are several ways in which classification can be performed. They typically involve defming some notion of distance between the case and each group centroids with the case being classified into the closest group.
For the single discriminant function case, the dividing point between two groups is one half the sum of the discriminant scores for the two group centroids. Researchers, usually, prepare a table I chart or 'classification matrix' to portray the
results of their prediction. This matrix is often used to test the accuracy of the
classification procedure too. For this reason, it is sometimes called 'accuracy matrix'. The simplest form of a typical distress prediction model, based on discrminant analysis, would construct a matrix of the following pattern:
Predicted Group Original Group
Failed Non-failed
Failed C MI
Where;
C: Correct classification
M I: Type I error like misclassification, i.e., classifying a failed finn as non-failed
M2: Type 11 error like misclassification, i.e., classifying a non-failed finn as failed
The percentage of the known cases, which are correctly classified, is an additional measure of group differences. As a direct measure of predictive accuracy, this percentage is the most intuitive measure of discrimination and can be used to test the power of classification procedure. Another alternative is the proportional
reduction in error statistic 'tau'. The maximum value for 'tau' is 1.0, and it occurs when there are no errors in prediction. A value of zero indicates no improvement. Negative results are also possible, and they indicate no discrimination or a degenerate situation.
As with any inferential technique based on sample data, the percent correct prediction and tau tend to overestimate the power of the classification procedure. This is because the validation is based on the same cases used to derive the classification functions. A remedy is to use a hold out sample. We can validate the classification procedure by randomly splitting the sample into two subsets. One subset is used to derive the function and the other to test the classification. Because each subset will tend to have different sampling errors, the test subset will give a better estimate of the ability to correctly predict the total population. Statisticians tend to disagree on the appropriate sizes for the two subsets. The most important consideration, however, is
that the subset used to derive the function is sufficiently large to insure stability of the coefficients or else the test will be flawed from the start.
Empirical Literature:
A1tman (1968) is the first to develop a multivariate distress prediction model. Essentially, the statistical methodology adopted by him was the 'discriminant analysis'. Therefore, he is also credited for employing discriminant analysis for the first time in corporate failure prediction models. In his groundbreaking work, A1tman (\968) developed an MDA model for his descriptive case of corporate bankruptcy prediction, using the initial paired sample of66 US fmns (33 bankrupt and 33 non-bankrupt) for the period between 1946 and 1965. These fmns came from
manufacturing sector and were all publicly traded. To start with, data on 22 different financial variables were collected. These 22 variables were classified into 5 standard categories: liquidity, profitability, leverage, solvency, and activity ratios. Following a four-step procedure, it was observed that out of22, only 5 variables do the best overall job together in prediction of corporate bankruptcy. Therefore, the fmal discriminant function estimated by A1tman for publicly traded manufacturing firms included only five discriminatory variables. The fmal criterion used to establish the best model was to observe its accuracy in predicting bankruptcy. A1tman conducted a series of six tests to this end. Altman concluded that the bankruptcy prediction model, based on MDA, is an accurate forecaster of failure up to two years priorto
bankruptcy and that the accuracy diminishes substantially as the lead-time increases. Deakin (1972) modified the Altman's (1968) model to include the 14 best ratios identified by Beaver (\966) in his univariate study. His sample of distressed
finns comprised 32 companies, which failed during 1964-1970 in USA. Each finn was matched with a non-failed finn on a random basis of asset size, industry classification, and the year of fmancial data. The final model included all 14
variables, and the equations were calculated on data for each of the five years before failure. Deakin's total misclassification rates on the original sample for the first three prior years were all less than 5%. Deakin also used a version of MDA that assigns a probability of membership to the failed and non-failed groups on the basis of its Z scores in previous years. This lowered error levels to 3%, 4.5%, 21 %, and 17% respectively for the five years prior bankruptcy. However, the model performed less well against a random sample of II bankrupt and 23 non-bankrupt finns,
misclassifying 22% companies at year I, 6% at year 2, 12% at year 3, 23% at year 4, and 15% at year 5. Deakin's 14-variable set produced his most accurate classification results. When he tried to reduce the number of variables, the classification error increased substantially. He concluded that discriminant analysis could be used to predict business failures as far as three years in advance with a fairly high accuracy [Altman (1993) and Morris (1998)].
Blum (1974) aimed to develop a failing company model to aid the antitrust division of the justice department of USA in assessing the probability of business failure. The legal jargon loosely defines failing as a 'grave probability of failure'. Blum's purpose was to quantifY this probability by analyzing the financial and market data of failed finns. For this purpose, he constructed an MDA modeL His sample consisted of 115 finns that failed from 1954 to 1968. The failed finns were paired with 115 non-failed finns on the basis of industry, size, and fiscal year. Unlike others,
Blum based his variable selection upon the concept of a business finn as a reservoir of fmancial resources with the probability of failure expressed in tenns of expected cash flows with three underlying common factors: liquidity, profitability, and
variability. He selected 12 variables to measure these cash flow parameters. In all, he used 12 ratio and 12 non-ratio variables as the basis of his model, with 6 of the fonner measuring variability of ratios. He divided the data into 21 ranges of at least three years and fitted the discriminant function to half the data in each range. The model fitted to middle ranges correctly classified over 90% of the companies in the holdout sample, but the error rates increased rapidly in 2nd, 3ro, 4th, and 5th years. [Altman
(1993) and Morris (1998)].
Altman, et. al. (1974) applied the discriminant analysis to a sample offailed textile firms in France. Using factor analysis to a large number of financial indicators, they proceeded to utilize the most important ones in a linear discriminant model. Their results were at best mediocre on test samples. While the model did provide some insight into that troublesome sector, it was not implemented on a practical basis [Altman and Narayanan (1996)].
Diamond (1976) used a sample of75 failed and 75 non-failed US companies, in his MDA model of the PhD thesis. Following a step-wise selection procedure, he screened ratios employing a number of pattern recognition techniques, including principal components analysis. Additionally, he made adjustments for potential sampling bias and misclassification error costs. The overall predictive accuracy was initially assessed at around 90% for 2-3 years before failure. This accuracy fell to
80% when allowance was made for sampling bias and an offsetting adjustment for misclassification error costs [Morris (1998)).
Deakin (1977) extended his 1972 analysis with an objective to provide an indication of the frequency and nature ofmisclassification of non-failed companies and to compare auditors' opinions with the model's predictive ability. His failed group consisted of 63 US firms: the 32 from his 1972 study and 31 firms (from a study by Altman and McGough) that failed in 1970 and 1971. The non-failed group consisted of80 finns randomly selected from 'Moody's Industrial Manual' and matched only by year of data. Deakin based his classification results on both linear and quadratic structures of discriminant function. His linear and quadratic
classification results using the Lachenbruch holdout technique were 94.4% and 83.9%, respectively. The type I and type II errors were very different in linear and quadratic equations; hence, Deakin adopted the following fail-nonfail decision rule for his validation tests: (1) classify as failing ifboth linear and quadratic functions
classify as failing; and (2) classify as non-failing if both linear and quadratic
functions classify as non-failing; and (3) investigate further if the functions produce conflicting results. Deakin contended that this eclectic rule tends to minimize the overall misclassification rate, if the 'investigate further' group is excluded.
Altman, et.a!. (1977) developed a revised version of Altman's Z-score model and named it ZETA model. Their sample consist~d of 53 bankrupt and 58 non-bankrupt manufacturing and retailing firms from the USA for the years 1964 to 1974. The latter were matched by industry and year of data. They adjusted the basic data to incorporate new accounting practices. Applying the same multivariate technique of
discriminant analysis, they constructed both linear and quadratic discriminant functions. They started with 27 variables in the beginning. Analysing the ranks suggested by 6 different variable selection methods, they finally selected seven variables for their analysis. Their new ZET A model appeared to be quite accurate for up to five years prior to failure with successful classification of well over 90% one-year prior and 70% accuracy up to five one-years.
The best-known applications of MD A techniques in the UK are the models developed by Tamer. His first model was developed in 1974 and used by a firm called London Stockbrokers. Since then, Tamer has revised his work at different times. Tamer and Tisshaw (1977) constructed their solvency model using linear discrrninant analysis that was applied to two groups of financial ratios. The first group was derived from the 46 listed manufacturing firms failed since 1969, and the other from 46 fmancially sound firms matched by size and industry. Eighty different ratios, typical of those any financial analyst might use, were calculated for each of the 92 companies. The fmal formula for Z-score for quoted firms included a constant term and 4 ratios as independent variables. They also made a reference to Z-score formula for unquoted firms that included 5 ratios as independent explanatory variables. The predictive ability of the 'quoted Z-model', one year prior to bankruptcy, was very impressive as it achieved an overall 99% success rate. Overall classification success rate was 97.8% for unquoted version of the model for the same year. However, their predictive power was far less impressive in years 2, 3 and 4 before actual bankruptcy.
Marais (1979), while on a short-term assignment for the Industrial Finance Unit of the Bank of England, also utilized discriminant analysis to quantifY relative