Running head: MAIN AND INTERACTIVE EFFECTS
Main and Interactive Effects of Controllability and Generalisability Attributions upon Self-efficacy
Pete Coffee*
School of Sport and Health Sciences, University of Exeter, St. Luke’s Campus, Heavitree Road, Exeter EX1 2LU, UK
Tim Rees
School of Sport and Health Sciences, University of Exeter, St. Luke’s Campus, Heavitree Road, Exeter EX1 2LU, UK
IN PRESS
PSYCHOLOGY OF SPORT AND EXERCISE
Submitted: 30th May, 2007
Resubmission: 13th November 2007-12-04 Accepted: 4th December 2007
*
Corresponding author. Tel: +44 1392 262892; Fax: +44 1392 264726. E-mail address: [email protected].
Running head: MAIN AND INTERACTIVE EFFECTS
Main and Interactive Effects of Controllability and Generalisability Attributions upon Self-efficacy
Submitted: 30th May, 2007 Resubmission:
Abstract
Objective: This study examined main effects of controllability and interactive effects of controllability and generalisability attributions upon self-efficacy.
Method: Participants (N = 360; mean age 21.64, SD = 6.96 years) completed measures of pre-competition self-efficacy (one hour prior to pre-competition one), attributions (one hour after competition one), and subsequent self-efficacy (at least one week following competition one and one hour prior to competition two). All measures were completed in reference to sport
competitions.
Results: Demographic variables and pre-competition self-efficacy were entered as control variables in moderated hierarchical regression analyses. Results demonstrated that individuals who perceived performance as more successful, had higher subsequent self-efficacy when they generalised (ΔR2 = .38, p < .01) causes of performance across time (stability: b = .45, p < .01), and/or across situations (globality: b = .49, p < .01), and/or perceived causes to be unique to themselves (universality: b = -.46, p < .01). Individuals who perceived performance as less successful, had higher subsequent self-efficacy when they viewed causes of performance as controllable (ΔR2 = .10, b = .25, p < .01); an interaction (ΔR2 = .07, p < .01) for controllability and globality (b = .22, p < .01) demonstrated that if causes were perceived to be global, higher levels of controllability were associated with higher levels of subsequent self-efficacy.
Conclusion: This study provides evidence, following more successful performances, that attributions to generalisability (stability, globality, and universality) affect self-efficacy; following less successful performances, globality (a generalisability dimension) moderates the effect of controllability upon self-efficacy.
Main and Interactive Effects of Controllability and Generalisability Attributions upon Self-efficacy
Attributions are explanations about why particular behaviours occurred, and explanations enhance people’s ability to predict and control events in the future (Anderson & Riger, 1991). A central premise within attribution research is that there is a dimensional structure underlying the explanations people give for events, and by categorising explanations into dimensions, one can better understand those explanations. According to Weiner (1985), whose perspective has been the focus of the majority of sport-related attribution research (Biddle, 1993), there are three principal attribution dimensions: locus of causality refers to whether a cause is inside (internal) or outside (external) the person, stability refers to whether a cause will (unstable) or will not (stable) change over time, and controllability refers to whether a cause is controllable or uncontrollable.
Weiner (1985) hypothesised that all three attribution dimensions should affect a variety of common emotional experiences, but that stability alone should predict expectations for future success. Only a few studies have examined this latter effect for stability. Grove and Pargman (1986) conducted three experiments within competitive situations to examine whether stability was indeed the key dimension predicting expectations. Grove and Pargman found that effort attributions (unstable but controllable) led to the highest expectancy in both failure and success conditions, suggesting that such results were better explained by a focus on controllability rather than stability. A focus on controllability was suggested in subsequent attribution research in sport (e.g., Rudisill, 1989). Rudisill noted that following failure, attributions to controllable factors led to higher expectations for future success. More recently, research in sport has examined
(2001) found that under conditions of perceived success, stability attributions predicted self-efficacy; under conditions of perceived failure, attributions did not predict self-efficacy. With 62 national level sprinters, Gernigon and Delloye (2003) reported main effects for controllability and stability attributions upon self-efficacy.
In Rejeski and Brawley’s (1983) review of the status of sport attribution research they criticised the unquestioning use of Weiner’s model, stating, “it may not necessarily be an appropriate model to test in the sport context” (p. 83). Instead, they suggested that the passive acceptance of Weiner’s model should be switched to a broader conceptual approach in future work. Two decades later, this criticism remains at least as valid as when it was originally written (see, also, Biddle, 1993; Biddle, Hanrahan, & Sellars, 2001).
Rees, Ingledew, and Hardy (2005) recently offered an alternative perspective, proposing that both researchers and applied practitioners might focus primarily upon controllability attributions in relation to an outcome such as expectations (e.g., efficacy expectations or self-efficacy). Alongside the evidence from Grove and Pargman (1986) and Rudisill (1989), Biddle et al. (2001) and Hardy, Jones, and Gould (1996) also made the case that in sport, controllability may be an important predictor of expectations. The need to exert control over future events was foundational to early attribution theorising. Heider (1958) wrote, “it is an important principle of common-sense psychology . . . that man grasps reality, and can predict and control it” (p. 79). Similarly, Kelley (1972) commented, “the purpose of causal analysis—the function it serves for the species and the individual—is effective control” (p. 23). Controllability is also central to the attributional research of Anderson and colleagues (e.g., Anderson & Riger, 1991), and the effect and importance of perceived uncontrollability is demonstrated in Abramson, Seligman, and
Teasdale’s (1978) reformulation of the learned helplessness model: The most direct determinant of helplessness is expectancy of future uncontrollability.
In sport, controllability may also be of greater psychological significance than locus of causality. The positive associations often observed between controllability and locus of causality (e.g., Crocker, Eklund, & Graham, 2002; Ingledew, Hardy, & Cooper, 1996; McAuley, Duncan, & Russell, 1992) suggest that people may feel there is much overlap between where a cause lies and by whom it is controlled. According to relapse prevention (Marlatt & Gordon, 1985), following a lapse in some positive behaviour, stable and uncontrollable attributions, whether they are internal or external, will lead to lowered self-efficacy and a greater probability of total relapse. Compared with locus of causality, controllability may therefore be a more important dimension to focus upon.
At the same time, Anderson and Riger (1991) noted, “the size of controllability effects . . . may vary as a function of other attribution dimensions” (p.154). Although main effects for attribution dimensions upon expectations (or self-efficacy) have been reported (e.g., Gernigon & Delloye, 2003; Grove & Pargman, 1986), only a few studies (e.g., Ingledew et al., 1996) have examined their interactive relationships (see Carver, 1989). Interactions of attribution dimensions may well be important because, for example, attributing less successful performances to
uncontrollable causes may only lead to lower levels of self-efficacy for subsequent performance, when causes are also considered to be stable (unlikely to change over time). That is, lower levels of self-efficacy might be expected when less successful performances are attributed to causes that are perceived to be uncontrollable and generalisable across time (see, e.g., Rees et al., 2005).
Rees et al. (2005) suggested that attribution research in sport should focus upon the main effects of controllability, together with the interactive effects of controllability and stability, globality, and universality upon an outcome such as expectations (e.g., efficacy expectations or self-efficacy). The addition of globality refers to whether the cause affects a wide range of situations with which the person is faced (a global attribution) or a narrow range of situations (a specific attribution); universality refers to whether the cause is common to all people (a universal attribution) or unique to the individual (a personal attribution) (cf. Abramson et al., 1978; Rees et al., 2005). Abramson et al.’s reformulation of the learned helplessness model suggests that the effect of perceived uncontrollability upon subsequent outcomes, such as learned helplessness, will be broad or narrow depending upon globality attributions. That is, the effect of perceived uncontrollability upon learned helplessness will be broad when individuals make attributions to global factors, and narrow when individuals make attributions to specific factors. Abramson et al. also encouraged the distinction between helplessness that is personal (personal helplessness) and helplessness that is universal (universal helplessness) and termed this distinction,
universality. This leads to an expanded conceptualisation of generalisability: in addition to whether causes generalise across time (stability), attribution research should examine whether causes generalise across situations (globality) and/or all people (universality).
The aim of the present study was to examine the main effects of controllability, together with the interactive effects of controllability and the three generalisability dimensions of stability, globality, and universality upon subsequent self-efficacy in sport. There was thus a requirement for a measure of controllability and the three generalisability dimensions. The most widely used state attribution measure is the revised Causal Dimension Scale (CDSII: McAuley et al., 1992). The CDSII assesses the dimensions of locus of causality, stability, and controllability;
the measure does not assess the generalisability dimensions of globality and universality. A number of problems have been levelled at the CDSII. Using confirmatory factor analysis,
Crocker et al. (2002) reported a poor fit for the CDSII with an individual sport sample (2 (48) = 148.06, p < .01; RMSEA = .11; and, CFI = .87); Ingledew et al. (1996) reported a poor fit for the CDSII with hospital workers in a failure condition(2(49) = 96.32, p < .01; RMSEA = .10; and, SRMR = .13). It has also been noted that respondents of the CDSII have considerable problems understanding some items and the interpretation of scale anchors (see Biddle & Hanrahan, 1998; Biddle et al. 2001). Within attribution research, there have been recent calls (e.g., Crocker et al., 2002) for further instrument development. In the present study, we used an alternative measure of attributions that assessed the four dimensions of controllability, stability, globality, and universality.
In general, attribution research has focussed upon attributions following positive and negative events (Weiner, 1985), and in sport, subjective perceptions of success rather than objective performance (winning and losing) have been used to distinguish between positive and negative events (e.g., Biddle, 1993; Bond et al., 2001; McAuley, 1985). The present study examined the effects of attributions following more successful and less successful performances upon subsequent self-efficacy. It was predicted that after controlling for demographic variables and pre-competition self-efficacy, attributions to controllable causes would lead to higher subsequent self-efficacy. This effect might, however, be moderated by generalisability attributions. More specifically, we predicted that controllability would have a significant effect upon subsequent self-efficacy when attributions were made to stable, or global, or personal causes.
Method
Comment [e1]: Need to work on the
hypotheses.
Reviewer 1: Introduction to general comments
Participants
Participants were 360 (mean age 21.64, SD = 6.96 years) male (n = 184) and female (n = 176) athletes, competing in a variety of team (n = 203) and individual (n = 157) sports. All participants were Caucasian British citizens. The standard of performance of participants ranged from club (n = 76) through county (n = 103), regional (n = 85), national (n = 49), and
international (n = 47) level.
Procedure
Ethical approval was granted by a university ethics committee and participants provided informed consent. Sampling was opportunistic, with participants recruited at the site of competitions. Data were collected at three time points. At Time 1 (Day 1), one hour prior to performance (to allow participants time to prepare for competition), participants completed a 6-item measure of self-efficacy relating to an up-coming performance. This was regarded as a measure of participants’ pre-competition self-efficacy. At Time 2 (Day 1), one hour after performance (to give participants a chance to physically recover from competition), participants were asked, “To what extent was this performance successful for you?” with response options ranging from 1 (not at all) to 5 (completely). An open-ended statement required participants to write down the single most important reason for how they performed. In relation to this reason, participants completed a measure of attributions. At Time 3 (Day 7, 8, or 9), one hour prior to performance (to allow participants time to prepare for competition), participants completed a 6-item measure of self-efficacy relating to an up-coming performance (note, performances at Times 1 and 3 were successive). This was regarded as a measure of participants’ subsequent self-efficacy.
Measures
Attributions. A 16-item measure (Coffee & Rees, 2007) assessing the four attribution dimensions of controllability, stability, globality, and universality was used to assess
participants’ attributions for performance. Each subscale is assessed using four items. In relation to their reason for performance, participants are asked “In general, to what extent is your reason something that . . .” with response options ranging from 1 (not at all) to 5 (completely). Higher values represent attributions that are more controllable, stable (except for the item “fluctuates across performances,” which is reverse scored), global, and universal. The controllability items are: “you could control in the future;” “in the future, you could exert control over;” “in the future, you could change at will;” and, “you could regulate in the future.” The stability items are: “remains stable across time,” “you feel remains constant over time,” “fluctuates across
performances” (reverse scored), and, “stays consistent across time.” The globality items are: “affects a wide variety of outcomes for you,” “relates to a number of different situations you encounter,” “influences the outcomes of new situations you face,” and, “influences all situations you encounter.” The universality items are: “is a common cause of performance for other athletes,” “is a cause of performance that other athletes relate to,” “can be used to explain the performances of other athletes,” and, “is a cause of performance for other athletes as well.” Coffee and Rees confirmed the factor structure of the measure with an athletic sample across both most successful (2
(98) = 129.49, p < .05; RMSEA = .04, p = .91; SRMR = .05; CFI = .98; and, NNFI = .97) and least successful (2
(98) =129.88, p < .05; RMSEA = .04, p = .81; SRMR = .04; and, CFI and NNFI = .98) conditions. Across conditions composite reliabilities1 ranged from .80 to .92, and shared variance2 from .50 to .73.
Self-Efficacy. In relation to an up-coming performance, participants completed a 6-item measure of self-efficacy. Self-efficacy is defined as the “beliefs in one’s capabilities to organize and execute the courses of action required to produce given attainments” (Bandura, 1997, p. 3). Based upon this definition, items were developed that reflected components of sport performance reported in the literature (e.g., Gould, Greenleaf, Chung, & Guinan, 2002; Mahoney, Gabriel, & Perkins, 1987; Orlick & Partington, 1988). As self-efficacy is an assessment of perceived capability, items were phrased in terms of can do rather than will do, and references were made to barriers (e.g., stay calm, despite the pressure) to successful performance (see Bandura, 1997) or characteristics (e.g., stay motivated throughout your performance) that generally lead to successful performance (see, e.g., Gould et al., 2002). Items were preceded by the statement, “With reference to today’s performance, to what extent do you feel confident that you can . . .” with response options ranging from 1 (not at all) to 5 (completely). The items were: “stay calm despite the pressure;” “stay focused on the most important parts of your performance;” “mobilise all your resources for this performance;” “perform well, even if things get tough;” “raise the level of your performance if you have to;” and, “stay motivated throughout your performance.” The mean score of the six items was taken to indicate participants’ self-efficacy. In the present study, coefficient alpha reliabilities for the 6-item scale ranged from .88 to .89.
Analyses
The factor structure of the attributions measure was tested using confirmatory factor analysis with maximum likelihood estimation (Jöreskog & Sörbom, 1993). The goodness of fit of the models was tested using the chi-square likelihood ratio statistic (2
: used as a subjective index of fit, Jöreskog & Sörbom, 1989), the Root Mean Square Error of Approximation (RMSEA: Steiger, 1990) and its associated p-value (for RMSEA < .05), the Standardised Root
Mean Square Residual (SRMR), the Comparative Fit Index (CFI: Bentler, 1990), and the Non-Normed Fit Index (NNFI: Tucker & Lewis, 1973). These fit indices included measures from three different classes (absolute fit, absolute fit with penalty function, and
incremental/comparative fit) (Hu & Bentler, 1999; Jöreskog, 1993; Jöreskog & Sörbom, 1993). The recommendations for fit of Hu and Bentler are values for SRMR close to .08, RMSEA close to .06, and CFI and NNFI close to .95.
Moderated hierarchical regression analyses (Jaccard, Turrisi, & Wan, 1990) were used to examine the effects of attributions upon the change in self-efficacy. In the hierarchical regression analyses, the dependent variable was subsequent self-efficacy. The effects of age, gender, type of sport (team or individual), and standard of performance (club, county, regional, national, and international) were controlled by entering them on the first step of the regression analysis. The effect of pre-competition self-efficacy was controlled by entering it on the second step of the regression equation. Following pre-competition self-efficacy, measures of attributions were entered in a three-step process. First, controllability was entered; second, stability, globality, and universality, collectively representing generalisability were entered; third, the interaction terms for controllability and stability, controllability and globality, and controllability and universality were entered. The significance of increments in explained variance (ΔR2) in subsequent self-efficacy over and above the variance accounted for by those variables already entered into the equation, as well as the sign of the regression coefficients (b), was then assessed at each step. Jaccard et al. emphasised that the independent variables should be centred prior to the formation of product terms. In this study’s analyses all continuous independent variables were standardised (with a mean of 0 and standard deviation of 1), thereby centring them, before any product terms
were computed, and the unstandardised solution was then examined. An alpha level of .05 was used for all statistical tests.
Results
Based upon the frequency data for the question “To what extent was this performance successful for you?” (Mdn = 3), participant responses of 4 and 5 (n = 142, M = 4.45) were considered high (hereafter termed more successful), and participant responses of 1 and 2 (n = 142, M = 1.54) were considered low (hereafter termed less successful). Participants with a score of 3 (n = 76) were omitted from the study. The more successful group comprised male (n = 71) and female (n = 71) athletes, competing in a variety of team (n = 84) and individual (n = 58) sports, across standards of performance ranging from club (n = 33) through county (n = 39), regional (n = 35), national (n = 15), and international (n = 20) level. The less successful group comprised male (n = 75) and female (n = 67) athletes, competing in a variety of team (n = 81) and individual (n = 61) sports, across standards of performance ranging from club (n = 32) through county (n = 41), regional (n = 35), national (n = 18), and international (n = 16) level.
The factor structure of the attributions measure was tested across more successful and less successful performances. For the more successful group, although the chi-square statistic was significant (2
(98) = 128.38, p < .05), the RMSEA was low (.04), with a non-significant test for close fit, the SRMR was low (.06), and the CFI (.97) and NNFI (.96) were high. These values are indicative of good fit (Hu & Bentler, 1999). Composite reliabilities ranged from .80 to .83, and shared variance from .51 to .55 (Table 1). For the less successful group, although the chi-square statistic was significant (2
(98) = 141.14, p < .05), the RMSEA was low (.05), with a non-significant test for close fit, the SRMR was low (.07), and the CFI (.96) and NNFI (.95) were
high. These values are indicative of good fit (Hu & Bentler, 1999). Composite reliabilities ranged from .80 to .89, and shared variance from .51 to .68 (Table 1).
A MANOVA indicated a significant difference in the scores of participants on the attribution dimensions between the more successful and less successful groups (Wilks’ Λ = .95,
F(4, 279) = 3.54, p < .01, ηp2 = .05, observed power = .87). Follow-up discriminant function
analysis suggested that the salient variables [standardised structure coefficients ≥ .30 in absolute value, which Pedhazur (1997) regards as meaningful] were stability (standardised structure coefficient = .52), globality (.84), and universality (.70), not controllability (.02). Compared with less successful performances, more successful performances were seen as more stable, global, and universal. (The descriptive statistics are shown in Table 1.)
The results of the moderated hierarchical regression analyses are presented in Table 2. For the more successful group, the combined effect of age, gender, type of sport, and standard of performance (demographic variables) was non-significant (R2 = .05, p > .05). Pre-competition self-efficacy was a significant predictor of subsequent self-efficacy (ΔR2 = .07, p < .01). Over and above the variance accounted for by the demographic variables and pre-competition self-efficacy, there was no significant main effect for controllability upon subsequent self-efficacy. Over and above the variance accounted for by the demographic variables, pre-competition self-efficacy, and controllability (R2 = .13), there were significant effects for the generalisability dimensions upon subsequent self-efficacy (ΔR2 = .34, p < .01), attributable to stability (b = .44, p
< .01), globality (b = .47, p < .01), and universality (b = -.45, p < .01). There were no significant effects for the interactive terms upon subsequent self-efficacy. These results suggest that following more successful performances, participants had higher subsequent self-efficacy when they viewed causes of performance as stable, and/or global, and/or personal.
For the less successful group the combined effect of the demographic variables was non-significant (R2 = .05, p > .05). Pre-competition self-efficacy was not a significant predictor of subsequent self-efficacy. Over and above the variance accounted for by the demographic variables and pre-competition self-efficacy (R2 = .06), there was a significant main effect for controllability upon subsequent self-efficacy (ΔR2 = .08, b = .23, p < .01). There were no significant effects for the generalisability dimensions upon subsequent self-efficacy. Over and above the variance accounted for by the demographic variables, pre-competition self-efficacy, controllability, stability, globality, and universality, there were significant effects for the interactive terms upon subsequent self-efficacy (ΔR2 = .06, p < .05), primarily attributable to the interaction between controllability and globality (b = .20, p < .01). Following such a result, Aiken and West (1991) recommended forming a new regression equation by removing non-significant higher order terms and then testing remaining scale invariant terms separately for significance. In addition to significant higher order terms, only related lower-order terms and significant scale invariant terms should remain to form the final regression equation. In the present study, therefore, the final regression equation included demographic variables (R2 = .05,
p > .05), pre-competition self-efficacy (ΔR2 = .01, b = .12, p > .05), controllability (ΔR2 = .08, b
= .29, p < .01), globality (ΔR2 < .01, b = .03, p > .05), and the interaction between controllability and globality (ΔR2 = .06, b = .17, p < .01).
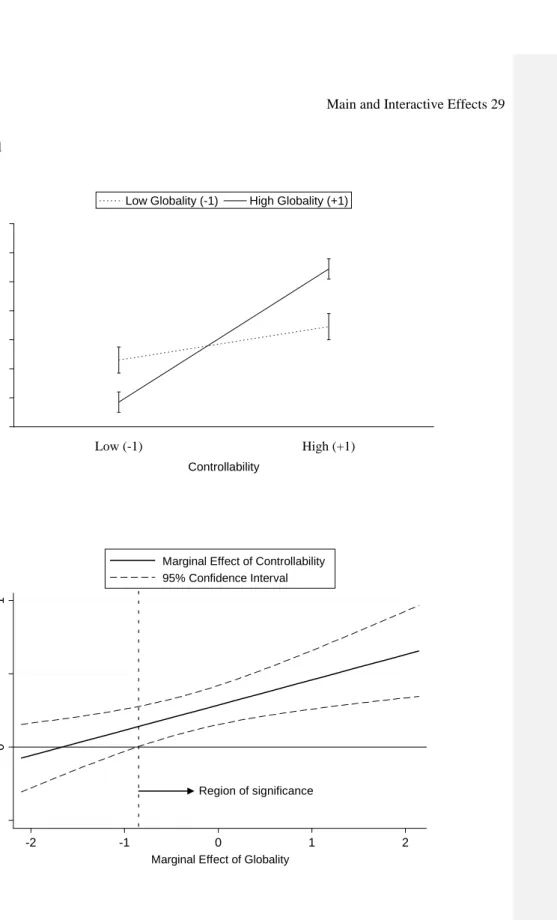
The interaction for controllability and globality upon subsequent self-efficacy is demonstrated in Figure 1. The interaction is plotted with pre-competition self-efficacy at a value of 0 (i.e., at its mean; observed score = 3.33). The interaction could have been plotted at a number of substituted values (e.g., +1 and -1 SD) for pre-competition self-efficacy. Only values on the y-axis would change, however, and not the magnitude or nature of the interaction for
controllability and globality upon subsequent self-efficacy. Figure 1(a) demonstrates that following less successful performances, if causes are perceived to be global (globality +1 SD
above its mean), higher levels of controllability are associated with higher levels of subsequent self-efficacy [t = 4.51, p < .01; the slope for stability -1 SD was non-significant (t = 1.57, p > .05)]. Figure 1(b) demonstrates that the effect of controllability upon subsequent self-efficacy is significant at moderate to high levels of globality (≥ -.86 SD in the level of globality).3
Discussion
The present study examined the effects of attributions following more successful and less successful performances upon subsequent self-efficacy. We hypothesised that attributions to controllable causes would lead to higher subsequent self-efficacy. We also hypothesised that this effect might be moderated by generalisability attributions. Before testing the study hypotheses, the construct validity of the measure of attributions used in the present study was examined. Following more successful and less successful performances, good fits were observed for the data to the proposed 16-item, four-factor model. The results of the moderated hierarchical regression analyses provide partial evidence to support the study hypotheses. For the less successful group, attributions to controllability were associated with a main effect upon subsequent self-efficacy, and with an interactive effect with globality.
Following more successful performances, attributions to controllability were not associated with significant effects upon subsequent self-efficacy. It would appear that whether causes of more successful performances are controllable or uncontrollable has little impact upon subsequent self-efficacy beliefs. Rather, participants had higher subsequent self-efficacy when they viewed causes of performances as stable (likely to recur), and/or global (likely to affect a wide range of situations), and/or personal (unique to the individual). In other words, regardless
of the controllability of the cause, participants had higher subsequent self-efficacy when they
generalised causes of more successful performances across time, and/or situations, and/or when they perceived causes to be unique to themselves. Bond et al. (2001) similarly found that under conditions of perceived success, participants had higher self-efficacy when they generalised causes of success across time. The results of the present study suggest that in addition to causes that are perceived to be stable, causes that are perceived to be global and/or personal are also associated with higher self-efficacy.
Following less successful performances, participants had higher subsequent self-efficacy when they viewed causes of performances as controllable. Although the three generalisability dimensions of stability, globality, and universality explained no significant additional variance in subsequent self-efficacy, an interaction for controllability and globality demonstrated that if causes were perceived as likely to affect a wide range of situations, higher levels of controllability were associated with higher levels of subsequent self-efficacy. That is,
controllability had a significant effect upon subsequent self-efficacy at moderate to high levels of globality (≥ -.86 SD in the level of globality). In other words, when a cause of a less successful performance is perceived as likely to affect many situations, it is important to perceive that the cause is controllable. These results offer some support for the propositions from sport
psychology (Biddle et al., 2001; Gernigon & Delloye, 2003; Grove & Pargman, 1986; Hardy et al., 1996; Rudisill, 1989) that controllability affects future expectations (or self-efficacy), both as a main effect and in its interaction with generalisability dimensions (Rees et al., 2005).
In the present study, participants were split into two groups based upon their subjective appraisal of performance. It is important to note that the categorisation into more and less successful groups does not reflect objective winning and losing (or success and failure).
McAuley (1985) found that perceived success was a better predictor of attributions than actual performance scores, and Biddle (1993) urged research that focused upon attributions for perceived success, rather than objective outcomes alone. To more accurately conceptualise more and less successful performances, the present study removed, before analyses, participants with a neutral/median score for perceived performance (i.e., score of 3 meaning somewhat successful, n
= 76). Compared to less successful performances, more successful performances were considered more stable, global, and universal. There was no significant difference in the scores of controllability attributions between more successful and less successful performances. To some extent, these results reflect personal changeability (Schoenemann & Curry, 1990), wherein individuals take responsibility for both more and less successful performances, but in a way that makes less successful performances reversible (unstable).
The results in the present study can be viewed with reasonable confidence. The construct validity and internal reliability of the measure of attributions used in the present study was confirmed using confirmatory factor analyses, and the internal reliability of the measure of self-efficacy was demonstrated by high coefficient alpha reliabilities. Some limitations, however, should be noted. The standard of performance of the opposition (competitors) was not controlled. That is, although participants completed measures of self-efficacy on two consecutive occasions, on each occasion, participants competed against different opposition. This might explain why only 7% and 1% of the explained variance in post-competition self-efficacy was accounted for by pre-competition self-efficacy in the more successful and less successful groups, respectively. Future research might consider taking into account the standard of performance of the
opposition. In the present study we have focused upon the consequences of attributions. There are, however, antecedent conditions that lead to different causal explanations. For example, it has
been shown in the achievement goals literature that the criteria (task- or ego-involving criteria) individuals use to judge competence can have an impact on attributions for success and failure (e.g., Newton & Duda, 1993; Vlachopoulos & Biddle, 1997). It would be interesting for future research to further examine antecedents of attributions.
Based upon the results of this study, following more successful performances, practitioners should encourage athletes to believe that the causes of performance are likely to recur, and/or are likely to positively affect a wide range of situations, and/or are unique to the athlete. Following less successful performances, when athletes perceive that the causes of performance are likely to affect a wide range of situations, practitioners should encourage athletes to believe that the causes are controllable. This study provides further evidence of construct validity for the four-factor measure of attributions used in the present study, together with evidence, following less successful performances, for the importance of focussing upon controllability attributions and the interactive effects of controllability and generalisability attributions.
References
Abramson, L. Y., Seligman, M. E. P., & Teasdale, J. D. (1978). Learned helplessness in humans: Critique and reformulation. Journal of Abnormal Psychology, 87, 49-74.
Aiken, L. S., & West, S. G. (1991). Multiple regression: Testing and interpreting interactions.
London: Sage.
Anderson, C. A., & Riger, A. L. (1991). A controllability attributional model of problems in living. Dimensional and situational interactions in the prediction of depression and loneliness. Social Cognition, 9, 149-181.
Bandura, A. (1997). Self-efficacy: The exercise of control. New York: Freeman.
Bentler, P. M. (1990). Comparative fit indexes in structural models. Psychological Bulletin, 103,
411-423.
Biddle, S. J. H. (1993). Attribution research and sport psychology. In R. N. Singer, M. Murphey, & L. K. Tennant (Eds.), Handbook of research on sport psychology (pp. 437-464). New York: Macmillan.
Biddle, S. J. H., & Hanrahan, S. J. (1998). Attributions and attributional style. In J. L. Duda (Ed.), Advances in sport and exercise psychology measurement (pp. 3-19). Morgantown, WV: Fitness Information Technology.
Biddle, S. J. H., Hanrahan, S. J., & Sellars, C. N. (2001). Attributions: Past, present, and future. In R. N. Singer, H. A. Hausenblas, & C. M. Janelle (Eds.), Handbook of sport psychology
(2nd ed., pp. 444-471). New York: Wiley.
Bond, K. A., Biddle, S. J. H., & Ntoumanis, N. (2001). Self-efficacy and causal attribution in female golfers. International Journal of Sport Psychology, 31, 243-256.
Brambor, T., Clark, W. R., & Golder, M. (2005). Understanding interaction models: Improving empirical analyses. Political Analysis, 14, 63-82.
Carver, C. S. (1989). How should multifaceted personality constructs be tested? Issues illustrated by self-monitoring, attributional style, and hardiness. Journal of Personality and Social Psychology, 56, 577-585.
Coffee, P., & Rees, T. (2007). The CSGU: A measure of controllability, stability, globality, and universality attributions. Manuscript submitted for publication.
Crocker, P. R. E., Eklund, R. C., & Graham, T. R. (2002). Evaluating the factorial structure of the revised causal dimension scale in adolescents. Research Quarterly for Exercise and Sport, 73, 211-218.
Fornell, C., & Larcker, D. G. (1981). Evaluating structural equation models with unobservable variables and measurement error. Journal of Marketing Research, 18, 39-50.
Gernigon, C., & Delloye, J. (2003). Self-efficacy, causal attribution, and track athletic performance following unexpected success or failure among elite sprinters. The Sport Psychologist, 17, 55-76.
Gould, D., Greenleaf, C., Chung, Y., & Guinan, D. (2002). A survey of U.S. Atlanta and Nagano Olympians: Variables perceived to influence performance. Research Quarterly for Exercise and Sport, 73, 175-186.
Grove, J. R., & Pargman, D. (1986). Relationships among success/failure, attributions, and performance expectancies in competitive situations. In L. V. Velden & J. H. Humphrey (Eds.), Psychology and sociology of sport: Current selected research I (pp. 85-95). New York: AMS Press.
Hardy, L., Jones, J. G., & Gould, D. (1996). Understanding psychological preparation for sport: Theory and practice of elite performers. Chichester: Wiley.
Heider, F. (1958). The psychology of interpersonal relations. New York: Wiley.
Hu, L., & Bentler, P. M. (1999). Cutoff criteria for fit indexes in covariance structure analysis: Conventional criteria versus new alternatives. Structural Equation Modeling, 6, 1-55. Ingledew, D. K., Hardy, L., & Cooper, C. L. (1996). An attributional model applied to health
behavior change. European Journal of Personality, 10, 111-132.
Jaccard, J., Turrisi, R., & Wan, C. K. (1990). Interaction effects in multiple regression. Newbury Park, CA: Sage.
Jöreskog, K. G. (1993). Testing structural equation models. In K. A. Bollen & J. S. Long (Eds.),
Testing structural equation models (pp. 294-316). Newbury Park, CA: Sage.
Jöreskog, K. G., & Sörbom, D. (1989). LISREL 7 user’s reference guide. Chicago, IL: Scientific Software International.
Jöreskog, K. G., & Sörbom, D. (1993). LISREL 8 user’s reference guide. Chicago, IL: Scientific Software International.
Kelley, H. H. (1972). Attribution in social interaction. In E. E. Jones, D. E. Kanouse, H. H. Kelley, R. E. Nisbett, S. Valins, & B. Weiner (Eds.), Attribution: Perceiving the causes of behavior (pp. 1-26). Morristown, NJ: General Learning Press.
Mahoney, M. J., Gabriel, T. J., & Perkins, T. S. (1987). Psychological skills and exceptional athletic performance. The Sport Psychologist, 1, 181-199.
Marlatt, G. A., & Gordon, J. R. (1985). Relapse prevention: Maintenance strategies in the treatment of addictive behaviors. New York: Guildford Press.
McAuley, E. (1985). Success and causality in sport: The influence of perception. Journal of Sport Psychology, 7, 13-22.
McAuley, E., Duncan, T. E., & Russell, D. (1992). Measuring causal attributions: The revised causal dimension scale (CDSII). Personality and Social Psychology Bulletin, 18, 566-573.
Miller, M. B. (1995). Coefficient alpha: A basic introduction from the perspectives of classical test theory and structural equation modeling. Structural Equation Modeling, 2, 255-273. Newton, M., & Duda, J. L. (1993). Elite adolescent athletes’ achievement goals and beliefs
concerning success in tennis. Journal of Sport & Exercise Psychology, 5, 278-287. Orlick, T., & Partington, J. (1988). Mental links to excellence. The Sport Psychologist, 2,
105-130.
Pedhazur, E. J. (1997). Multiple regression in behavioral research. Explanation and prediction.
London: Thomson Learning.
Preacher, K. J., Curran, P. J., & Bauer, D. J. (2006). Computational tools for probing interaction effects in multiple linear regression, multilevel modeling, and latent curve analysis.
Journal of Educational and Behavioral Statistics, 31, 437-448.
Rees, T., Ingledew, D. K., & Hardy, L. (2005). Attribution in sport psychology: Seeking congruence between theory, research and practice. Psychology of Sport and Exercise, 6,
189-204.
Rejeski, W. J., & Brawley, L. R. (1983). Attribution theory in sport: Current status and new perspectives. Journal of Sport Psychology, 5, 77-99.
Rudisill, M. E. (1989). Influence of perceived competence and causal dimension orientation on expectations, persistence, and performance during perceived failure. Research Quarterly for Exercise and Sport, 60, 166-175.
Schoeneman, T. J., & Curry, S. (1990). Attributions for successful and unsuccessful health behavior change. Basic and Applied Social Psychology, 11, 421-431.
Shook, C. L., Ketchen, D. J., Hult, G. T. M., & Kacmar, K. M. (2004). An assessment of the use of structural equation modeling in strategic management research. Strategic Management Journal, 25, 397-404.
Steiger, J. H. (1990). Structural model evaluation: An interval estimation approach. Multivariate Behavioral Research, 25, 173-180.
Tucker, L. R., & Lewis, C. (1973). A reliability coefficient for maximum likelihood factor analysis. Psychometrika, 38, 1-10.
Vlachopoulos, S., & Biddle, S. J. H. (1997). Modeling the relation of goal orientations to achievement-related affect in physical education: Does perceived ability matter? Journal of Sport & Exercise Psychology, 19, 169-187.
Weiner, B. (1985). An attributional theory of achievement motivation and emotion.
Footnotes 1
Coefficient alpha assumes parallel measures and represents a lower bound estimate of internal reliability (Miller, 1995). Following confirmatory factor analysis, Shook, Ketchen, Hult, and Kacmar (2004) recommended composite reliability, which draws on the standardised loadings and measurement error for each item. A value below .70 indicates poor composite reliability (Shook et al., 2004). Composite reliability ρc is defined as (adapted from Fornell &
Larcker, 1981):
i i i c E Var L L 2 2 where Li is the standardised factor loadings for that factor, and Var(Ei) is the error variance associated with the individual indicator variables (items).
2
Shared variance measures the amount of variance captured by the factor in relation to the amount of variance due to measurement error. A value below .50 indicates that the variance due to measurement error is larger than the variance captured by the factor (Fornell & Larcker, 1981), and the content validity of the items, as well as the factor is questionable. Shared variance
ρvc is defined as (adapted from Fornell & Larcker, 1981):
i i i vc E Var L L 2 2 where Li is the standardised factor loadings for that factor, and Var(Ei) is the error variance associated with the individual indicator variables (items).
3
The value of ≥ -.86 reflects the precise value of the modifying variable (i.e., globality) when the marginal effect of the focal independent variable (i.e., controllability) becomes significant. From a basic model: Yb0b1Xb2Zb3XZ
the marginal effect of X is: b bZ dx
dy
3 1
and the standard error is:
3
1 3
2 1 Z Varb 2ZCovbb b Var SE where, Y is the dependent variable, X is the focal independent variable, Z is the modifying variable, b0 is the constant, b1 is the regression coefficient for X, b2 is the regression coefficient for Z, b3 is the regression coefficient for XZ,
dx dy
is the marginal effect of X (gradient of the
regression line), SE is the standard error, Var is the variance, and Cov is the covariance. Note, the standard error is used to calculate the confidence intervals. For more information the reader is referred to Brambor, Clark, and Golder (2005), and, Preacher, Curran, and Bauer (2006).
Table 1
Means, Standard Deviations, Composite Reliabilities, Shared Variance, Coefficient Alpha Reliabilities, and Correlations of
Attribution Dimensions and Self-Efficacy
.
M
±
SD
ρc ρvcα
S
G
U
PS
SS
More Successful Group
Controllability
3.42 ± .75
.83
.54
-.32**
-.25**
-.18*
-.06
-.07
Stability (S)
2.80 ± .85
.81
.55
-.12
-.27** -.09
-.39**
Globality (G)
3.49 ± .74
.80
.51
-.55** -.15
-.28**
Universality (U)
3.74 ± .60
.81
.52
-.04
-.03
Pre-competition Self-efficacy (PS) 3.42 ± .69
.88
-.27**
Subsequent Self-efficacy (SS)
3.57 ± .87
.88
Less Successful Group
Controllability
3.42 ± .93
.85
.60
-.12
-.15
-.14
-.12
-.31**
Stability
2.60 ± .84
.80
.52
-.29**
-.05
-.03
-.05
Globality
3.20 ± .80
.81
.51
-.39**
-.01
-.12
Universality
3.50 ± .86
.89
.68
-.03
-.18*
Pre-competition Self-efficacy
3.33 ± .77
.89
-.06
Subsequent Self-efficacy
3.31 ± .87
.89
Note
.
N
= 284 (More successful group,
n
= 142; Less successful group,
n
= 142).
ρc
= Composite reliability.
ρvc= Shared variance. α = Coefficient alpha.
Table 2
Main and Interactive Effects of Attributions upon Self-Efficacy. Dependent Variable: Subsequent Self-Efficacy.
Step ΔR2b bc (standard error)
More Successful Group
1 Demographic Variablesa .05* 2 Pre-competition Self-efficacy -.07** -.26** (.08) 3 Controllability -.01** -.10** (.08) 4 Generalisability -.34** Stability -.44** (.06) Globality -.47** (.07) Universality -.45** (.09) 5 Interactive terms -.02** Controllability*Stability -.00** (.06) Controllability*Globality -.05** (.09) Controllability*Universality -.09** (.10)
Less Successful Group
1 Demographic Variablesa .05* 2 Pre-competition Self-efficacy -.01** -.06** (.07) 3 Controllability -.08** -.23** (.07) 4 Generalisability -.02** Stability -.00** (.08) Globality -.00** (.08) Universality -.11** (.07) 5 Interactive terms -.06** Controllability*Stability -.01** (.06) Controllability*Globality -.20** (.07) Controllability*Universality -.04** (.06)
Note. N = 284 (More successful group, n = 142; Less successful group, n = 142).
All variables standardised except for interactive terms. Interactive terms formed from preceding (standardised) variables.
a
Age, gender, type of sport (team or individual), and standard of performance (club, county, regional, national, and international). bStepwise change in R2. cUnstandardised regression coefficient in respective step.
Figure Caption
Figure 1. The interactive effect for controllability and globality upon subsequent self-efficacy (controlling for demographic variables and pre-competition self-efficacy).
Figure 1 (a) 2. 6 2. 8 3 3. 2 3. 4 3. 6 3. 8 4 Low (-1) High (+1) Controllability Su bse qu en t Se lf-effica cy
Low Globality (-1) High Globality (+1)
(b) -. 5 0 .5 1 S u b se q u e n t S e lf-e ff ic a cy -2 -1 0 1 2
Marginal Effect of Globality Marginal Effect of Controllability 95% Confidence Interval