Effect of Total Quality Management on the Performance of the
Organization Considering the Effect of Staff Performance and
Innovation
Fatemeh Ghosi Rasht AbadiDepartment of Management, Rasht Branch, Islamic Azad University, Rasht, Iran
Abstract
TQM (Total Quality Management) is a management approach that helps organizations improves organizational performance based on the quality achieved by strengthening problem-solving. The aim of this study was to investigate the effect of total quality management on the performance of the organization considering the effect of staff performance and innovation. Thus, by utilizing structural equation model measured the effects of the components of total quality management. The populations of the research staff in Gilan province’s tax affairs with using convenient sampling method 161 samples are chosen. The results of tests show that the total quality management functions on innovative performance by a factor of 0.27, with a coefficient of 0.73 on the performance of employees by a factor of 0.27 and had a significant positive impact on organizational performance. The performance by a factor of 0.65 to 0.51 with a coefficient of performance of an innovative has a positive and significant impact on organizational performance, while the innovative performance has no significant effect on organizational performance.
Keywords: total quality management, organizational performance, staff performance, innovative performance.
Introduction and Review of the Literature
Since the 1950s, quality has interested customer and service producers, with an increasing speed. Scientific and technological advances, created the era of expectations, and today as in the past they are not willing to accept each kind of goods or services. Therefore, organizations that fail to respond to new needs and demands of customers based on expectations are out (Mojibi et al., 2012).
Total Quality Management approach is based on the management of the organization with the participation of all employees, customers and suppliers to continuously improve customer satisfaction (Agus and Hassan, 2011).
Total quality management, is a management approach that helps organization to improved organizational performance based on the quality achieved by strengthening problem-solving. TQM is a system based on human resources, which seeks to increase customer satisfaction and reduce operating costs to help the survival of the organization. One of the fundamental principles of total quality management and continuous improvement in all processes is to improve service quality, customer focus, production of waste, focusing on process improvement rather than criticism of the decision based on data (Martinez-Lorente, 2010).
Analysis of factors that have direct effect on innovation, such as leadership and organizational learning is positively related to improved performance. However, many research studies have shown that innovation has a direct impact on performance and innovation as the mediator plays an important role in organizational performance (Ahmadi et al., 2012).
But the main issue is whether the employee's performance and innovation research has been able to effect a comprehensive quality management on the performance of the organization? In fact, performance and innovation, can be used as an effective mediator in establishing a comprehensive quality management system or hinder the effectiveness of the performance of the organization.
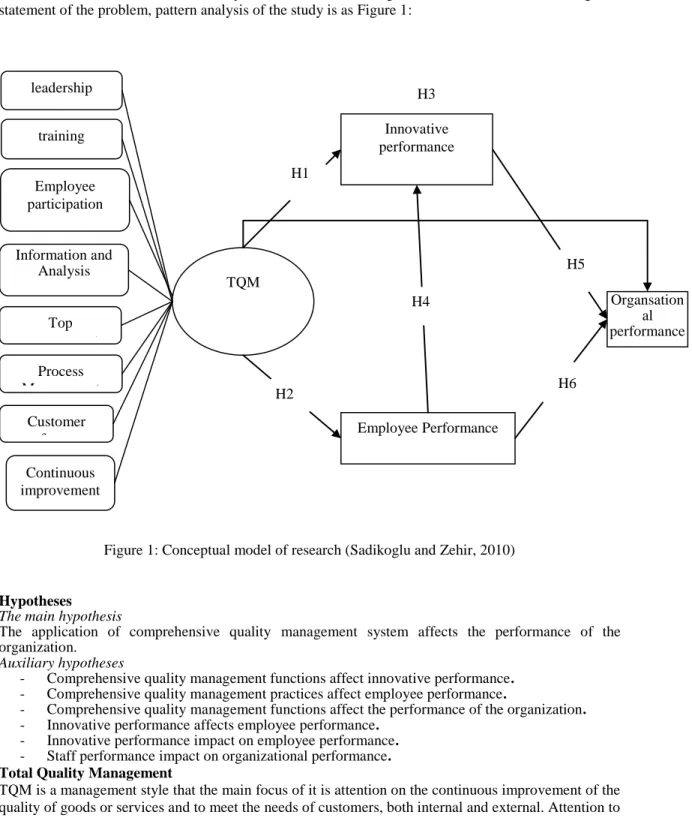
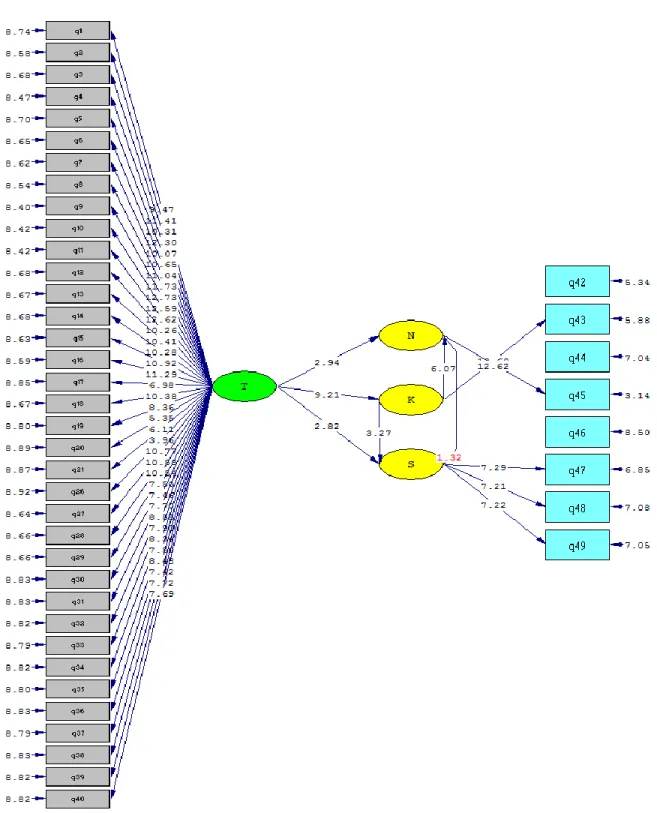
The theoretical framework indicates the independent and dependent variables based on the literature. The theoretical framework of this study is derived from Sadikoglu and Zehir in 2010. According to a statement of the problem, pattern analysis of the study is as Figure 1:
Figure 1: Conceptual model of research (Sadikoglu and Zehir, 2010)
Hypotheses The main hypothesis
The application of comprehensive quality management system affects the performance of the organization.
Auxiliary hypotheses
- Comprehensive quality management functions affect innovative performance. - Comprehensive quality management practices affect employee performance.
- Comprehensive quality management functions affect the performance of the organization. - Innovative performance affects employee performance.
- Innovative performance impact on employee performance. - Staff performance impact on organizational performance. Total Quality Management
TQM is a management style that the main focus of it is attention on the continuous improvement of the quality of goods or services and to meet the needs of customers, both internal and external. Attention to
leadership training Information and Analysis Top management Process Management Customer focus Continuous improvement TQM Innovative performance Employee Performance Organsation al performance H4 H2 H1 H5 H6 H3 Employee participation
quality and continuous improvement has a critical role in development. In this regard, to achieve a superior level of quality and excellence in the organization, to an integrated system based on the concepts of quality management that all factors are required (Mojibi et al., 2012).
Leadership
In total quality management thinking all staff should be involved in quality improvement. Without public participation, there is no possibility of recovery. Everyone should understand the benefits and the need to improve quality. But before other employees, senior management must be committed to change and improve the quality, since the top management provides all the efforts of the organization and with the support of a comprehensive quality management, , top management commitment is essential (Farajpour, 2013).
Education
Quality is based on the staff skills and understanding of what is required. Training requires the information to move in the direction of their organization's strategy. As gives required skills to improve the quality and resolution of the issues (Mojibi et al., 2012).
Employee Participation
According to "Padhi" (2008) Group Working is one of total quality management. Teamwork leads to better and more appropriate solutions to the problems founding. In fact, contribute to the growth and promotion of intellectual workers and suppliers.
Information
Knowledge of different parts of an organization under the collaboration between departments (units) brings a better understanding of job responsibilities, and mutual problem solving (Mittal et al., 2011). Process Management
The process is a series of interrelated activities that are undertaken to achieve a specific goal. The process can be chains of value in which each stage (seed chains) adds value to the previous step. Thus, business processes are the essential activities of functional boundaries that are not limited to human resources, management skills and technology to create value for stakeholders, especially the organization's focus on strategy related to their customers. Management must be based on objective, rather than management, process capability and learn ways to improve it (Jafari, 2006).
Customer Focus
The manufacturing and service organizations, customer satisfaction is considered as an important measure to evaluate the quality of their work, and this trend is increasing (Jafari, 2006).
To provide customers satisfaction the steps such as familiarity with customers, feedback from customers, changing norms and standards, continuing survey are necessary (Rajabbeigi and Salimi, 1995).
Continuous Improvement
"Continuous improvement" is one of the important characteristics of total quality management, so that sometimes synonymous with total quality management and continuous improvement processes of an organization called permanent. TQM is called a journey, not a destination. Management should be aware of this, guidance and support to undertake comprehensive quality management programs and has never done it as something that is not seen (Zomorodian, 1994).
Top Management
TQM management has the role to coordinate all activities related to the company's quality (Esmaeelpur, 1994).
Operation
The performance is the tasks, activities and results referred to them. It Can measure the results of decisions and actions of the organization that reflects the success (Alam Tabriz et al., 2009).
Statistical Research
The populations of the research are all staff of tax organization of Gillan that covers approximately 700 persons
169 copies of questionnaire have been distributed and 161 questionnaires were returned. In this study, researchers selected a method that is due to the recognition of non-random sampling of the population is available.
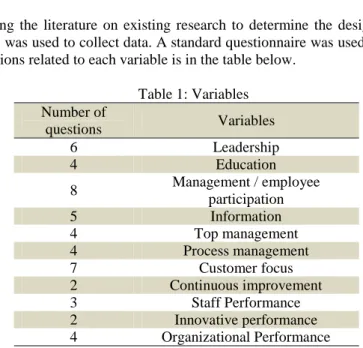
In this study, studying the literature on existing research to determine the design of the study and a questionnaire survey was used to collect data. A standard questionnaire was used to measure variables. The number of questions related to each variable is in the table below.
Table 1: Variables Variables Number of questions Leadership 6 Education 4 Management / employee participation 8 Information 5 Top management 4 Process management 4 Customer focus 7 Continuous improvement 2 Staff Performance 3 Innovative performance 2 Organizational Performance 4
In the questionnaire, since the question of relative scales, attempt to use the Likert scale. In order to eliminate totally agree, agree, neither agree nor disagree, disagree and strongly disagree; coefficient of 5, 4, 3, 2 and 1 were considered, and the qualitative data with quantitative and numerical interpretation and calculation of criteria action was considered.
Validity and Reliability
In order to assess the validity of the questionnaire it was measured by a questionnaire. Cronbach's alpha coefficient was used to test reliability.
Initially, 30 questionnaires were distributed and Cronbach's alpha for each of the variables were measured and finally, Cronbach's alpha coefficient of the questionnaire was calculated. The results of the calculations in the table below:
Table 2: The validity
Variables Cronbach's alpha coefficient
Leadership 0.868 Education 0.856 Management / employee participation 0.902 Information 0.795 Top management 0.903 Process management 0.896 Customer focus 0.843 Continuous improvement 0.817
Staff Performance 0.783 Innovative performance 0.876 Organizational Performance 0.893
Given that each of the variables Cronbach's alpha was above 0.7. As a result, the reliability of the questionnaire was confirmed.
General Characteristics of Respondents
To describe the general characteristics of respondents, descriptive statistics were used. Many respondents based on gender, marital status, years of service and age were analyzed and plotted graphs. More than 74 percent of respondents were male and 25% of the respondents were female. 82% of respondents were married. 6.8% of respondents between 18 and 25 years old. 24.2% of respondents between 26 and 35 years, 33.5% of respondents 36 to 45 years and33.5% between 46 and 55 years and 1.2% over 56 years old. The greatest numbers of respondents’ ages are on 36 to 55. 10 numbers of respondents with secondary school degree, 26 diploma degrees, and 77 of the respondents have a Bachelor's degree and Master's degree is 47. The most frequent and lowest frequencies of a degree are a bachelor's degree. According to the results 11 of the respondents experience less than 1 year and 22 patients with a history of 1 to 5 years, 29 between 5 and 10 years, 50 between 10 and 20 years and 36 over 20 years in their work. The highest percentage of respondents (33.8) has a history of 10 years to 20.
Normality Data Test
To investigate claims against it as normal variables, the null hypothesis is sponsored activity: H0: The data are normally distributed
H1: The data are not normally distributed
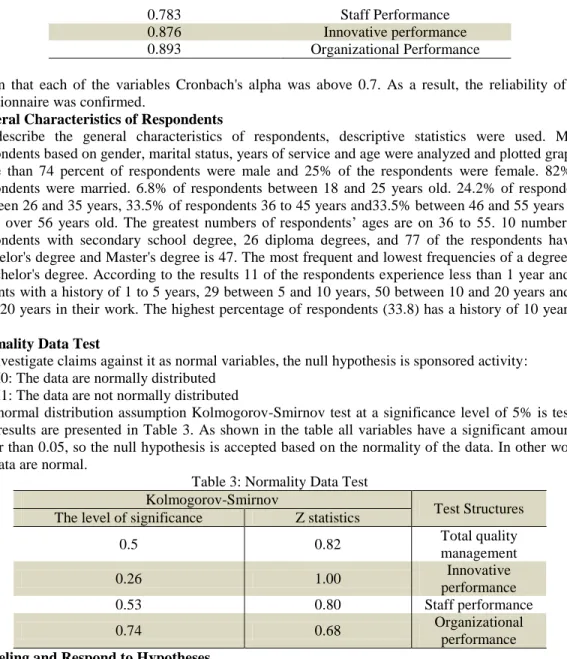
The normal distribution assumption Kolmogorov-Smirnov test at a significance level of 5% is tested. The results are presented in Table 3. As shown in the table all variables have a significant amount is larger than 0.05, so the null hypothesis is accepted based on the normality of the data. In other words, the data are normal.
Table 3: Normality Data Test
Test Structures Kolmogorov-Smirnov
Z statistics The level of significance
Total quality management 0.82 0.5 Innovative performance 1.00 0.26 Staff performance 0.80 0.53 Organizational performance 0.68 0.74
Modeling and Respond to Hypotheses
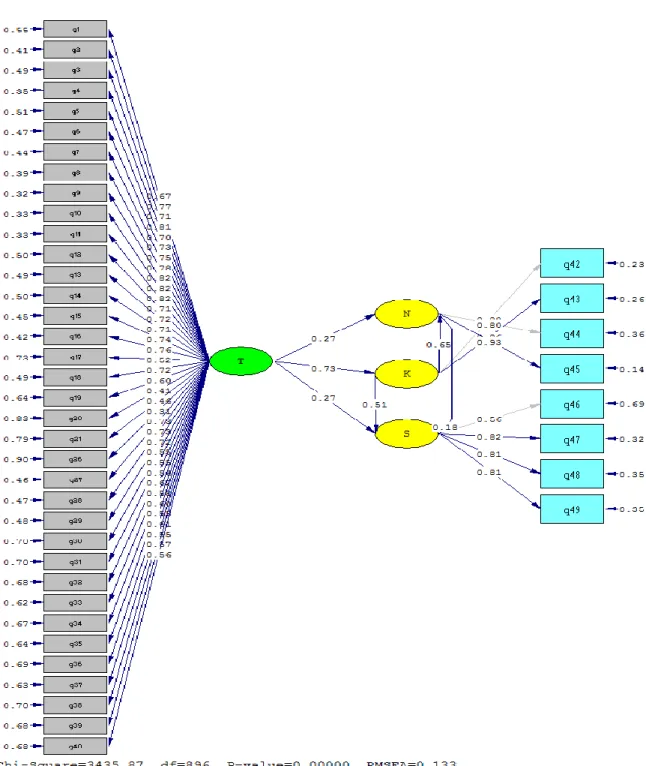
In general, structural equation modeling techniques and software LISREL research hypotheses were tested. To achieve this aim, the data normality test was performed. The confirmatory factor analysis was performed for each of the questionnaire. Finally, the assumptions of the model run.
Confirmatory Path Analysis Model
To test the conceptual model and model assumptions of the structural equation model was used to analyze the data. Structural equation modeling is a statistical approach to test hypotheses about the relationship between the variables of latent variables is observed. Through this approach acceptable body can use theoretical models to specific community solidarity data, the non-experimental and experimental tests. Therefore, to estimate the maximum likelihood method is used in software LISREL 8.80. To evaluate the model, which includes an independent variable (total quality management) and three dependent variables (innovative performance, staff performance and organizational
performance)? Before approving structural relations must ensure the appropriateness of the model and good fitness. The model chi-square value of the degrees of freedom that the desired value is 3.83. The comparative fit index (CFI), the incremental fit index (IFI), the normed fit Index (NFI) and Non-normed fit index (NNFI) are all greater than 0.9, then the model is pretty well demonstrated and confirmed.
Table 4: Fitness Index
fitness index RMSEA CFI NFI NNFI IFI Acceptable values ≤0.08 9.0> 9.0> 9.0> 1-0
The calculated values 0.13
0.94 0.91
0.93 0.94
Following figures show and estimates are significant numbers of standardized structural equation model for conceptual model based on the relationship between independent variables and the dependent variables.
Standardized coefficients can be determined from the model the impression that the latent variables and their corresponding indexes, there is a significant positive correlation. Standardized coefficients suggest the path coefficients or standardized factor loadings between agents and their markers. For construct validity between the next and the next and indexes, there was a significant positive correlation. The standard model of the covariance matrix estimation model fit the data model is achieved and actual estimate model parameters show. In this model the relationships between structure and dimension, dimension and indicator is shown. If the relationship is higher than 0.3, it can be argued that questions of good explanatory power.
As noted above, the standard estimate is thus provided with a double correlation coefficients, the comparison between the index and provides the scale, but significant of these factors can be big or small, according to the coefficient used, but should T index used to determine the significance of the path. Model numbers are significant because it is presented to know if the relationship between the structure and the relationship between the index are significant or not. Model numbers significantly, the T-Value, the significance of each of the parameters indicated and if the amount is greater than the absolute number of 1.96, the parameters are significant. Due to the fact that some significant number of model parameters of the absolute number is greater than 1.96, thus corresponding to the variable assumptions and other assumptions confirmed that a significant number of less than 1.96 is rejected.
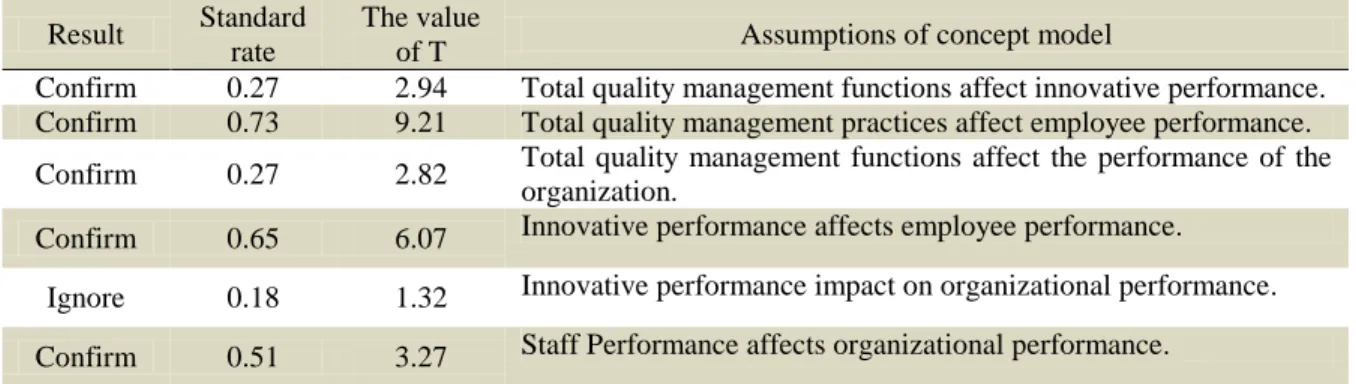
Table 5: The Results of The measurements at the 0.05 level Assumptions of concept model The value
of T Standard
rate Result
Total quality management functions affect innovative performance. 2.94
0.27 Confirm
Total quality management practices affect employee performance. 9.21
0.73 Confirm
Total quality management functions affect the performance of the organization.
2.82 0.27
Confirm
Innovative performance affects employee performance. 6.07
0.65 Confirm
Innovative performance impact on organizational performance. 1.32
0.18 Ignore
Staff Performance affects organizational performance. 3.27
0.51 Confirm
Since the analysis confirms the relationship between latent traits which is important; in fact, we seek to determine the relationship between latent traits derived based on the theory, according to data collected from the sample are accredited or not ? As the table above is well known and forms, the analysis confirms the 5 hypothesis, according to the standardized coefficients and significant numbers have been verified and demonstrates that relations are derived on the basis of theories and the data gathered example studied at the 0.05 level are as follows:
First hypothesis: Based on the above table, the effect of comprehensive quality management functions on the innovative performance of 0.27 is estimated that the t-value of 1.96 (i.e., 2.94), so the hypothesis is confirmed. Thus, the most comprehensive quality management functions, performance will be more innovative
The second hypothesis: Based on the above table, the effect on the Staff Performance of the functions of a comprehensive quality management estimates that the t-value of 1.96 is 0.73 (9.21). Therefore, this hypothesis is confirmed. Thus, the functions of TQM organization is, the Staff Performance will be. The third hypothesis: Based on the above table, the effect of comprehensive quality management practices on organizational performance, equivalent to 0.27 is estimated that the value of t over 1.96 (2.82). Therefore, this hypothesis is confirmed. Therefore, a better comprehensive quality management functions is better for the Organizational Performance.
The fourth hypothesis: Based on the above table, the effect on innovative performance of employees is estimated that the t-value of 1.96 is 6.07 (0.65). Therefore, this hypothesis is confirmed. Hence, the
performances of employees in the organization have a higher level of performance will be more innovative.
Fifth hypothesis: Based on the above table, the effect on the performance of the innovative performance of 0.18 is estimated that the t-value is below 1.96 (1.32). Therefore, this hypothesis is not confirmed.
Sixth hypothesis: Based on the above table, the effect of the performance of staff on organizational performance, equivalent to an estimated 0.51 with a t-value is below 1.96 (3.27). Therefore, this hypothesis is confirmed. Hence, the performance of employees at the higher level, the Organizational Performance will be better.
The Results
Hypothesis 1: comprehensive quality management functions affect innovative performance.
Comprehensive management functions by a factor of 0.27 and a significant positive impact on innovative performance. According to the estimated value of the t-statistic (2.94) is more than the value of table, so the first hypothesis cannot be rejected.
Hypothesis 2: Comprehensive quality management practices affect Staff Performance.
Comprehensive management functions by a factor of 0.73 and a significant positive impact on the performance of employees. According to the estimated the value of the t-statistic (9.21) is more than the value of table, so the second hypothesis cannot be rejected.
Hypothesis 3: total quality management functions affect the performance of the organization.
Comprehensive management functions by a factor of 0.27 and a significant positive impact on the performance of the organization. According to the estimated the value of the t-statistic (2.82) is more than the value of table, so the third hypothesis cannot be rejected.
Hypothesis 4: innovative performance affects employee performance.
Staff Performance by a factor of 0.65 and a significant positive impact on innovative performance. According to the estimated the value of the t-statistic (6.07) that is higher than table, so fourth hypothesis could not be denied.
Hypothesis 5: innovative performance has impact on organizational performance.
According to the estimated the value of the t-statistic (1.32) is less than the value of table, so the fifth hypothesis cannot be accepted.
Hypothesis 6: the relationship affects the performance of the organization.
Staff Performance by a factor of 0.51 and a significant positive impact on the performance of the organization. According to the estimated value of the t-statistic (3.27) is more than the value of table, so the sixth hypothesis cannot be rejected
Suggestions
Due to the impact of total quality management functions on the Taxation Organization, the followings are recommended:
Management, encourages employees to innovation, and considers reward. Personally projects also improve the quality of the entry.
Comprehensive quality-based education for staff and also some specific skills, to be considered for a continuous period.
Frequently used form of employee ideas and try to comments made and used in meetings.
In addition to defining the tasks of staff, as well determine how to serve them.
Senior managers treat in a way to highlight the importance of customer satisfaction for employees.
A variety of innovative and effective ways to get feedback from customers design for all organizational functions.
Measures design as a comprehensive quality management system and periodically report References:
[1] Esmaeelpur Ashka, Reza (1994) barresie naghshe modiriate ali dar systeme modiriate keifiate jame ; faslname daneshe modiriat, No 25,pp 55-63
[2] Ahmadi,Erahim, Karahi Moghadam,syrus, Rahimi,Farajolah, (2012) tasire esterategyhaye modiriate danesh bar noavari va amalkarde sazmane jahade keshavarzie ostane chaharmahal va bakhtiari , payannameye karshenasie arshad, daneshgahe oloom va tahghighate vahede [3] Jafari, mostafa; Akhavan; Peyman, Modiriat bar mabnaye farayand, Majaleye tadbir No 140 [4] Rajabbeigi , M , Salimi, M (1995) Modiriate keifiate jame , entesharate jahade sazandegi [5] Mohebi Mikaeili, T; Mehdizadeh Ashrafi, A; Emamifar, M (1391), Assess the readiness of the
implementation of comprehensive quality systems cooperatives active in the manufacturing sector in Mazandaran province, Journal of Management, Vol. 26, P. 69-85.
[6] Farajpour, P (1392), Total quality management and market-orientation effects on the performance of hotels, Master thesis, Islamic Azad University of Vahad-Rasht.
[7] Zomorodian, A (1373), Total quality Management, Institute of Educational Planning, Industrial Development and Renovation Organization of Iran.
[8] Alam Tabriz, A; Hajibaba, A (1388), Intellectual Capital, Publishing Training Centre and Industrial Research of Iran, Vol. 1.
[9] Agus, Arawati, Hassan, Za’faran, 2011, Performance Through Total Quality Management (TQM):Strategies For Competitive Advantage, The 7th International Strategic Management Conference, Procedia Social and Behavioral Sciences 24, pp:1650–1662.
[10]Martinez-Lorente, Angel. R., Dewhurst, Frank, Gallego-Rodriguez, Alejandrino, 2010,
RELATING TQM, MARKETING AND BUSINESS PERFORMANCE: AN
EXPLORATORY STUDY
[11]Mittal Deepak, single vineet, & goyal amit.(feb 2011). Comparison Of Tqm Success Factors In Northern India In Manufacturing And Service Industries: A Surevey. International Journal of Engineering Science and Technology (IJEST), Vol.3, No.2
[12]Sadikoglu, Esin, Zehir, Cema, 2010, Investigating the effects of innovation and employee performance on the relationship between total quality management practices and firm performance: An empirical study of Turkish firms, Int. J. Production Economics, No.127, pp:13-26.