Multimedia courseware:
never mind the quality how much will it cost to develop?
I. M. Marshall, W. B. Samson and P. I. Dugard
Software Quality Group, Department of Mathematical & Computer Sciences, University of Abertay, Dundee
This paper evaluates multimedia courseware costing techniques such as the US Airforce Interactive Courseware Method (Golas, 1993), CBT Analyst (Kearsley, 1985), CEAC (Schooley, 1988) and MEEM (Marshall, Samson, Dugard, & Scott, 1994) against the data from ten multimedia courseware developments. The Relative Error and Mean Absolute Relative
Error (MARE) are calculated to allow comparison of the different methods.
Introduction
Baker (1994) humorously described the failure of teachers, companies, organizations and governments over the last twenty-five years to deliver the volume of courseware which would spark the active-learning revolution. Hardware now exists to deliver multimedia, but the cost of developing quality courseware remains high. What chance does multimedia-based active learning have of widespread adoption if developers cannot reliably estimate the development effort of multimedia courseware? This paper presents expert estimation of development effort to learner time ratios found in the literature, before investigating four alternative methods for estimating multimedia development effort. The results of the estimates are then compared against the actual project data.
Estimation of development effort
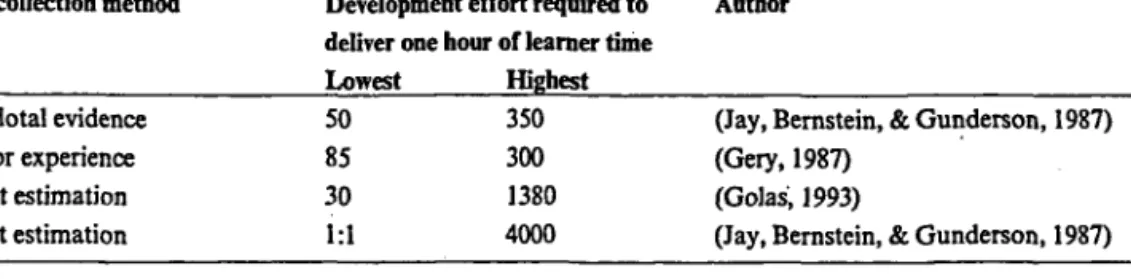
The range of development efforts reported in the literature to produce one learner-hour of multimedia courseware is presented in Table 1.
Analysis of the projects included in Table 1 indicates that the values cover a wide range of different types of courseware from simple drill and practice exercises (Jay et al, 1987) through to high-fidelity multimedia simulations (Golas, 1993). This range is reflected in the range of estimates Senbetta (1991) found when experts were asked to estimate
Table I: Estimates of courseware development effort
Data collection method
Anecdotal evidence
Author experience
Expert estimation Expert estimation
Development effort required to deliver one hour of learner time Lowest 50 85 30 1:1 Highest 350 300 1380 4000 Author
(Jay, Bernstein, & Gunderson, 1987) (Gery, 1987)
(Golas, 1993)
(Jay, Bernstein, & Gunderson, 1987)
different courseware-development effort from detailed specifications. The development effort estimates varied by up to 500% from the minimum to the maximum estimate for the same specification.
US Airforce Interactive Courseware Method (USAF ICW)
Golas (1993) developed an Interactive Courseware Estimation Method for the US Air Force based on expert opinion of the factors which affect development effort. The starting point is a best-case estimate which is made for the level of course and type of behaviour to be delivered using the criteria listed in Table 2.
These values are best-case estimates which are then increased by the appropriate number of developer-hours for each factor described in Table 3.
Table 2: Best cose estimate for interactive courseware
Type of training
Level of presentation Knowledge Skill Attitude I Basic 30 75 200 II Medium 75 125 250 III High 200 400 600
The model has been reviewed and revised using expert opinion but unfortunately no information exists about external validation using real courseware data.
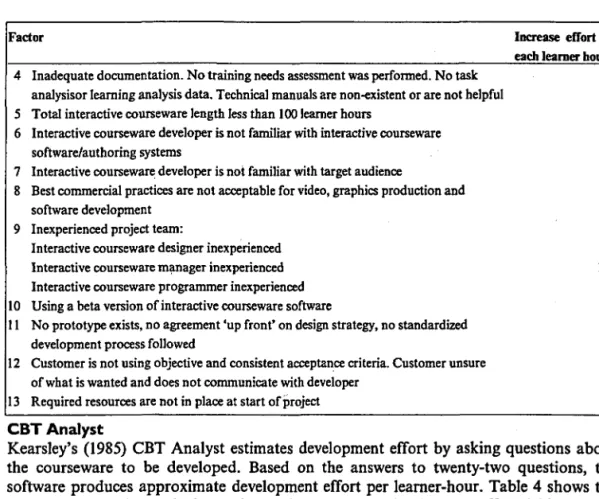
Table 3: Factors affecting best case estimates
Factor
1 N o 'in-house' subject matter experts; must rely solely on the use of customer subject matter expertise
2 Subject matter is highly complex
3 Instructional content is unstable. Systems for which interactive courseware is being developed are emerging. Tasks for interactive courseware are constantly changing
Increase effort for each learner hour
35 100 •
Factor Increase effort for each learner hour 4 Inadequate documentation. No training needs assessment was performed. No task
analysisor learning analysis data. Technical manuals are non-existent or are not helpful 20 5 Total interactive courseware length less than 100 learner hours 20 6 Interactive courseware developer is not familiar with interactive courseware
software/authoring systems 15 7 Interactive courseware developer is not familiar with target audience 10 8 Best commercial practices are not acceptable for video, graphics production and
software development 50 9 Inexperienced project team:
Interactive courseware designer inexperienced 80 Interactive courseware manager inexperienced 100 Interactive courseware programmer inexperienced 60 10 Using a beta version of interactive courseware software 80 11 No prototype exists, no agreement 'up front' on design strategy, no standardized
development process followed 50 12 Customer is not using objective and consistent acceptance criteria. Customer unsure
of what is wanted and does not communicate with developer 50 13 Required resources are not in place at start of project 20
CBT Analyst
Kearsley's (1985) CBT Analyst estimates development effort by asking questions about the courseware to be developed. Based on the answers to twenty-two questions, the software produces approximate development effort per learner-hour. Table 4 shows the twenty-two questions asked to estimate the courseware development effort. This result is then modified by the three composite rules described in Table 5.
Table 4: CBT Analyst's base constraints questions
Question 1 2 3 4 5 6 7 8
What type of CBT do you plan to develop? (tutorial, simulation, testing or embedded)
How complex is the learning task the CBT course is to be developed for?
Will colour graphics be used?
Will interactive video or audio be used? How will the courseware be developed?
Does a library of CBT routines and graphics exist or does all programming have to be done from scratch? How much CBT experience does the designer or design team have?
How much experience does the developer/programmer have with the authoring language or system being used?
Lowest value 0 0 0 0 0 -5 +1 -5 Highest value +5 +2 +5 +5 +3 0 +5 0
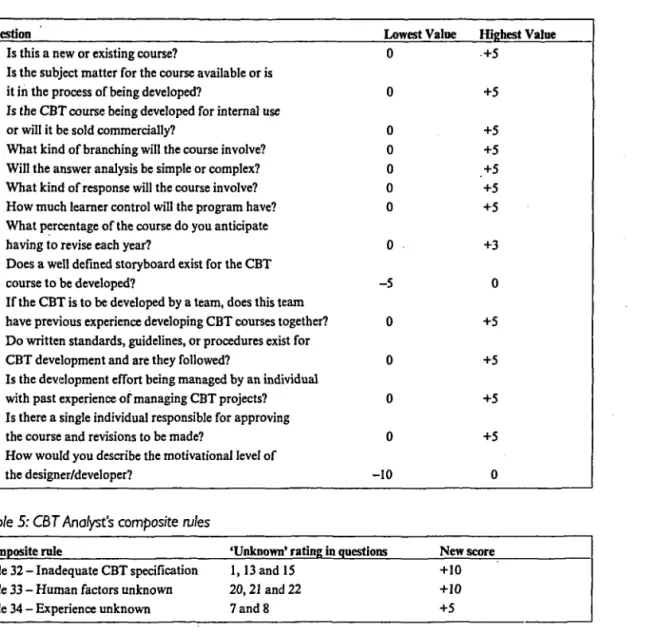
Question
9 Is this a new or existing course?
10. Is the subject matter for the course available or is it in the process of being developed?
11. Is the CBT course being developed for internal use or will it be sold commercially?
12. What kind of branching will the course involve? 13. Will the answer analysis be simple or complex? 14. What kind of response will the course involve? 15. How much learner control will the program have? 16. What percentage of the course do you anticipate
having to revise each year?
17. Does a well defined storyboard exist for the CBT course to be developed?
18. If the CBT is to be developed by a team, does this team have previous experience developing CBT courses together? 19. Do written standards, guidelines, or procedures exist for
CBT development and are they followed?
20. Is the development effort being managed by an individual with past experience of managing CBT projects? 21. Is there a single individual responsible for approving
the course and revisions to be made?
22. How would you describe the motivational level of the designer/developer? Lowest Value 0 0 0 0 0 0 0 0 -5 0 0 0 0 -10 Highest Value +5 +5 +5 +5 +5 +5 +5 +3 0 +5 +5 +5 +5 0
Table 5: CßT Analyst's composite rules
Composite rule 'Unknown' rating in questions New score Rule 32 - Inadequate CBT specification 1,13 and 15
Rule 33 - Human factors unknown 20,21 and 22 Rule 34 - Experience unknown 7 and 8
+10 +10 +5
CBT Analyst then uses this result to select an estimated development effort using the values in Table 6.
Table 6: CBT analyst's threshold values and development effort
Threshold values -9999 to 0 1 to 20 21 to 50 51 to 9999
Development effort per hour of learner time Under 100
100-200 200-400 500+
The upper limit of 500+ developer hours limits the usefulness of the estimate produced, but it does provide a consistent method which is simple to use.
Cost Estimating Algorithm for Courseware (CEAC)
CEAC (Schooley, 1988) estimates both courseware development effort and cost. Estimates are based on project and organization specific inputs as well as an internal database of courseware development data. The software uses the following equation to calculate the development effort by summing the contribution of tutorial, drill and practice, simulation and certification test elements to the project.
Certification Test
Development time = X (CFx CAxLT)x(TMxEFxSFxDVx(l -LSF))
Tutorial Where: CF = CA = LT = TM = Courseware fraction CBT advantageLecture equivalent time Teaming multiplier EF = SF = DV -LSF = Experience factor Sophistication factor Database values Library saving fraction
Schooley found that estimates were within 20% of the actual figure on six of the twelve projects evaluated. CEAC's main strength is the range of factors which contribute to the estimate of development effort. However, the internal database is constructed from linear projections of a limited number of data points.
Multimedia Effort Estimation Model (MEEM)
The authors of this paper are currently involved in a project to develop a multimedia cost-estimation model. Using courseware-development data from fourteen projects has allowed 85% of the variation in development effort to be explained by the use of four grouped cost drivers (Marshall et al, 1994). The model involves rating individual cost drivers under the following groups:
• Course Difficulty (CD) • Interactivity (IN)
• Development Environment (DE) • Subject Expertise (SE)
The individual cost driver is based on expert opinion of key factors which contribute to development effort. At present there are too few projects to generalize these results, but it does indicate that statistical analysis of development data can form the basis of a cost-estimation model.
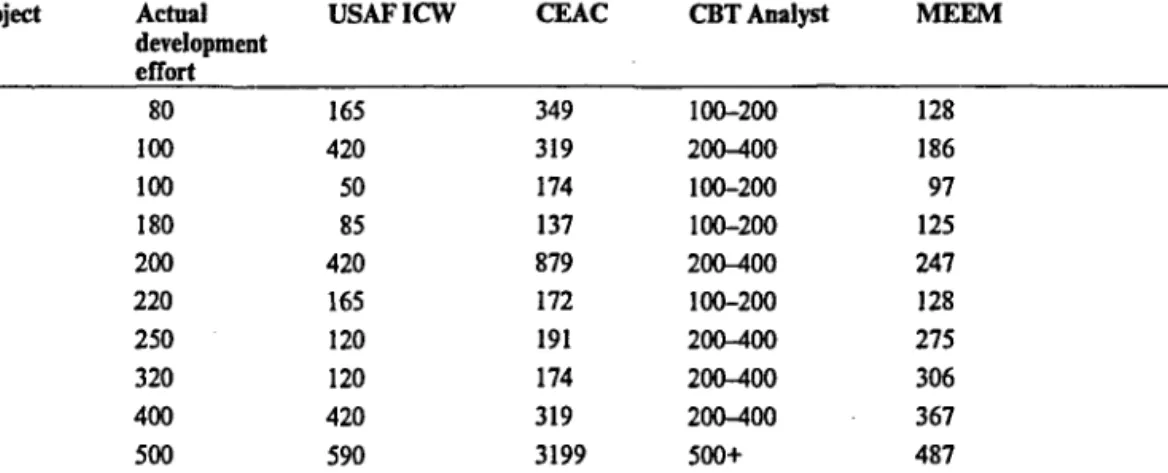
Comparison of Estimates
The data from ten of the MEEM projects were used with the three courseware-estimation methods previously described. Table 7 presents the estimates produced by each model, along with the actual development effort and the results from MEEM. The ten projects selected each had an estimated learner-time of one hour.
Table 7: Comparison of estimates and actual development effort
Project A B C D E F G H I J Actual development effort 80 100 100 180 200 220 250 320 400 500 USAFICW 165 420 50 85 420 165 120 120 420 590 CEAC 349 319 174 137 879 172 191 174 319 3199 CBT Analyst 100-200 200-400 100-200 100-200 2OÍW0O 100-200 200-400 200-400 20ÍM00 500+ MEEM 128 186 97 125 247 128 275 306 367 487
Schooley (1988) used a measure called relative error to determine the accuracy of the CEAC estimation method. The following equation shows the relative error for development effort.
Relativee = Actual Effort - Estimated Effort
Actual Effort
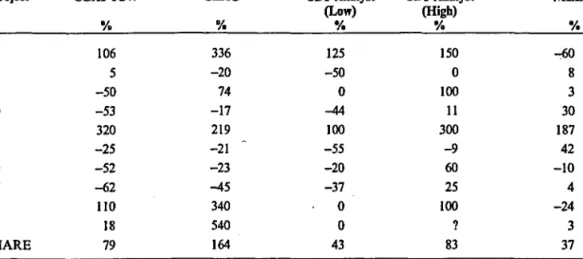
The relative errors for the four estimation methods for the ten projects are shown in Table 8. CBT Analyst's results are divided into low and high values to indicate the range of values produced by this tool.
Because the relative error can be greater or less than zero, Mean Relative Error (MRE) would no be a useful summary. Taking the absolute value provides a more useful summary measure. Table 8 shows the Mean Relative Error (MRE) in addition to the relative error for each projects. MEEM produces a MARE of 37%, but this is not surprising because the same data was used in the statistical analysis. CBT Analyst (Low) produces a MARE of 43% with the ten projects used. Despite its relative age, it produces on average more accurate results than the other newer estimation models with this data set.
Table 8: Relative error of estimated development effort Project A B C D E F G H I J MARE USAFICW % 106 5 -50 -53 320 -25 -52 -62 110 18 79 CEAC % 336 -20 74 -17 219 -21 -23 -45 340 540 164 CBT Analyst (Low) 125 -50 0 ^44 100 -55 -20 -37 0 0 43 CBT Analyst (High) 150 0 100 11 300 -9 60 25 100 ? 83 MEEM v. -60 8 3 30 187 42 -10 4 -24 3 37
Conclusion
The four models used to estimate the development cost of multimedia courseware produced MARE results which range from 37 to 164%. These results support Kitchenham's (1992) concerns about general software cost-estimation models, and indicate the need for specialist models related to the development environment. Further research is underway to collect data to assist in the development of multimedia cost-estimation models, and the rigorous validation of existing models. It is only with the development of a reliable method of estimating development effort that multimedia courseware can hope to sustain the active learning revolution.
References
Baker, J. (1994), 'One man and his dog', Interact, 1, 3, 16-17.
Gery, G. (1987). Making CBT Happen: Prescriptions for Successful Implementation of
Computer-based Training in your Organisation, Boston, MA, Weingarten.
Golas, K. C. (1993), 'Estimating time to develop interactive courseware in the 1990s', paper presented at the Interservices Industry Training and Education Conference, Orlando FL.
Jay, J., Bernstein, K., & Gunderson, S. (1987), Estimating Computer-based Training
Development Times (ARI Technical Report No. 765), Research Institute for Behavioural
and Social Sciences.
Kearsley, G. (1985), 'The CBT advisor: an expert system program for making decisions about CBT', Performance and Instruction, 24, 9, 15-17.
Kitchenham, B. A. (1992), 'Empirical studies of assumptions that underlie software cost-estimation models', Information and Software Technology, 34, 4, 211-18.
Marshall, I. M., Samson, W. B., Dugard, P. I., & Scott, W. A. (1994), 'Predicting the development effort of multimedia courseware' Information and Software Technology, 36, 5, 251-8.
Schooley, R. E. (1988), 'Computer-based training (CBT) cost estimating algorithm for courseware (CEAC)', Proceedings of the Interservices Industry Training Systems
Conference, 319-28.
Senbetta, G. (1991) An Inquiry of Time and Cost Estimating for Computer-based Training
Courseware Design and Development as Determined by Modified Delphi Method, PhD