Mid-sagittal cut to area function transformations: Direct
measurements of mid-sagittal distance and area with MRI
A. Soquet
a,*, V. Lecuit
b, T. Metens
c, D. Demolin
aaLaboratoire de Phonologie, UniversiteeLibre de Bruxelles, 50 Av. F.D. Roosevelt, CP 175, 1050 Brussels, Belgium bLaboratoire de Phoneetique Expeerimentale, Institut des Langues Vivantes et de Phoneetique, UniversiteeLibre de Bruxelles,
Brussels, Belgium c
Uniteede Reesonance Magneetique, Hoo^pital Erasme, UniversiteeLibre de Bruxelles, Brussels, Belgium
Received 25 June 1999; received in revised form 3 June 2000; accepted 15 September 2000
Abstract
This paper presents a comparative study of transformations used to compute the area of cross-sections of the vocal tract from the mid-sagittal measurements of the vocal tract. MRI techniques have been used to obtain both mid-sagittal distances and sections of the vocal tract for French oral vowels uttered by two subjects. The measured cross-sectional areas can thus be compared to the cross-cross-sectional areas computed by the different transformations. The evaluation is performed with a jackknife method where the parameters of the transformation are estimated from all but one measurement of a speaker’s vocal tract region and evaluated on the remaining measurement. This procedure allows the study of both the performance of the different forms of transformation as a function of the vocal tract region and the stability of the transformation parameters for a given vocal tract region. Three different forms of transformation are compared: linear, polynomial and power function. The estimation performances are also compared with four existing transformations. 2002 Elsevier Science B.V. All rights reserved.
Reesumee
Cet article preesente uneeetude compareee de diffeerentes transformations utiliseees pour calculer la section du conduit vocalaa partir de la distance sagittale. Les distances sagittales et les sections du conduit vocal onteetee mesureees sur des coupes obtenues par Reesonance Magneetique pour les voyelles orales du Francßais prononceees par deux locuteurs. La section mesureee peut ainsi^eetre compareee aux sections calculeees au moyen des diffeerentes transformations. L’eevaluation est reealiseee au moyen d’une technique de ‘‘jackknife’’: les parameetres de la transformation sont estimees pour une reegion du conduit vocalaa partir de l’ensemble des donneees sauf une, qui permet ensuite d’eevaluer la transformation. Cette proceedure permet d’eetudieraa la fois les performances des transformations et la stabilitee des parameetres des transfor-mations pour chaque reegion du conduit vocal. Trois formes diffeerentes de transformation onteetee compareees: lineeaire, polynomiale et exponentielle. Les performances de quatre transformations existantes sont eegalement preesenteees.
2002 Elsevier Science B.V. All rights reserved.
Keywords:Mid-sagittal profile; Area function; Articulatory data
www.elsevier.com/locate/specom
*
Corresponding author. Tel.: +32-2-650-20-18; fax: +32-2-650-20-07.
E-mail address:asoquet@ulb.ac.be (A. Soquet).
0167-6393/02/$ - see front matter 2002 Elsevier Science B.V. All rights reserved. PII: S 0 1 6 7 - 6 3 9 3 ( 0 0 ) 0 0 0 8 4 - 4
1. Introduction
Until recently, most articulatory data consisted of sagittal information either in the form of sagittal X-ray projection images (Chiba and Kajiyama, 1941; Fant, 1960), or movement of structures in the oral cavity obtained by point tracking methods such as the X-ray microbeam (Fujimura et al., 1973) or magnetometers (Schonle et al., 1987). The availability of this sagittal information had two major consequences for speech research: (i) the development of so-called articulatory models de-scribing the possible geometry of the sagittal cuts of the vocal tract and often based on sagittal X-ray projections (Mermelstein, 1973; Maeda, 1978); (ii) the search for a transformation relating the sagit-tal distance to the cross-sectional area, derived, for example, from plaster casts of the oral cavity (Ladefoged et al., 1971; Sundberg et al., 1987), from measurements on cadavers (Heinz and Ste-vens, 1965) or from X-ray computed tomography (CT) (Johanson et al., 1983; Sundberg et al., 1987). The generation of area functions from mea-surements of the sagittal section is an important step in the study of the relationship between vocal tract geometry and speech acoustics. Many authors have proposed transformations aimed at performing this particular task. The use of imaging techniques seems to be the solution of choice for studying these transformations: if the imaging plane is adequately placed, it allows one to mea-sure both the mid-sagittal distance and the cross-sectional area of live speaking subjects. Sundberg et al. (1987), for example, used axial CT to study the pharynges of two subjects.
For this study, we used an MRI sequence that permits 14 scans of 4 mm thickness to be taken simultaneously. Important characteristics of this sequence are that (i) scans can be placed all along the vocal tract, and (ii) the study of static vocal tract configurations can be made during only one sustained phonation and does not require reiterate phonation as reported in numerous studies (see, for example, Baer et al., 1991; Lakshminarayanan et al., 1991; Greenwood et al., 1992). On these scans, both the mid-sagittal distance and the cross-sectional area can be measured. Hence, it is pos-sible to study the transformations between the
mid-sagittal distance and the actual cross-sectional area.
In this paper, we investigated different forms of transformation, and compared their performances with those of four published transformations.
Using published transformations is by no means guided by the hope that these might be adequate to all subjects. These transformations are known to be speaker-specific. The objective here is to evaluate the performances of unadapted versus speaker-specific transformations.
Most transformations going from the mid-sag-ittal distance to the cross-sectional area are based on the original transformation defined by Heinz and Stevens (1965), which is
AðxÞ ¼adðxÞb; ð1Þ
where d is the mid-sagittal distance, Athe
cross-sectional area,xthe position along the vocal tract
mid-line, and a and b are the two parameters of
the transformation.
For the pharynx, Johanson et al. (1983) pro-posed a linear relationship between the square of the mid-sagittal distance and the cross-sectional area,
AðxÞ ¼p0þp2dðxÞ 2
: ð2Þ
In general, the authors adapt the value of the transformation parameters to the speaker and the position along the vocal tract mid-line. Some ex-tend this dependence to the mid-sagittal distance itself (Fant, 1992; Perrier et al., 1992; Beautemps et al., 1995).
Thus, the transformations rely upon an accu-rate distinction of the different regions of the vocal tract. Hence, we divided the vocal tract into height regions: larynx, low-pharynx, mid-pharynx, oro-pharynx, velum, hard palate, alveolar region, and labial region. The limit between the mid- and oro-pharynx is defined as half the distance from the top of the epiglottis to the velum (Perrier et al., 1992). The other boundaries are placed according to the corresponding articulators.
Fig. 1 represent these different regions on a mid-sagittal contour of the vocal tract. This division
into nine regions allows accurate implementation of most of the published transformations.
2. Material 2.1. MRI data
The magnetic resonance images were acquired
at the Magnetic Resonance Unit of the Hoopital^
Erasme, Universitee Libre de Bruxelles on a 1.5 T
MRI system with a quadrature Head–Neck coil (Philips Gyroscan NT ACS, Best, The Nether-lands). We used a sequence allowing simultaneous multi-stack acquisition of up to 14 slices of 4 mm thickness in less than 14 s. Slices can be grouped into different stacks, and each stack can have a different orientation.
MR images have been acquired for one female speaker (subject 1) and one male speaker (subject 2), both native French speakers living in Brussels. The task of the subjects was to sustain a vowel during the acquisition sequence. The reference was a word, which contained the vowel to be pro-nounced. This reference word was given orally a few seconds before the recording session by one of the experimenters. For both the speakers, data were collected for the 10 French oral vowels [i, e,e, a, o, c , u, y,ø, œ].
For each vowel, the 14 MRI scans were dis-tributed along the vocal tract in three stacks. The
first stack was in the transverse plane, contained 6 slices and covered the larynx to the mid-pharynx. The second stack was in a coronal–oblique plane, contained 3 slices and covered the oro-pharynx and the velum. The third stack was in the coronal plane, contained 5 slices and covered the hard palate to the labial region.
For each vowel, the three stacks were placed orthogonal to the mid-line of the vocal tract esti-mated on a mid-sagittal scan of the vowel pro-nounced by the subject.
Figs. 2 and 3 show the position of the 14 scans on the mid-sagittal profile and the resulting 14 scans, respectively, for the vowel [u] uttered by the female subject and for the vowel [i] uttered by the male subject. On these scans, it is possible to measure both the mid-sagittal distance and the cross-sectional area.
2.2. Measurement of mid-sagittal distance and cross-sectional area
Until now, there has been no automatic and reliable method to determine mid-sagittal distance and cross-sectional area of a section of the vocal tract on an MRI scan. Measurements were carried out following a procedure first devised for the treatment of mid-sagittal profiles of the vocal tract (Soquet et al., 1996). Outlines of the sections are traced by hand on a transparent sheet. By means of a digitization tablet, the outlines are introduced in the computer and each area is computed by a polygon surface computation algorithm. The dig-itization process may be biased by human factors. A test on the reproducibility of the measurement of the outlined area was made. Areas were com-puted for series of 10 repetitions of the same measure on three different outlines correspond-ing to three different reference sections of known areas: large, medium and small. The results are displayed in Table 1. The mean and standard de-viation are given for each section. Results show that the standard deviation is similar in the three
cases and is lower than 0.005 cm2. This
measure-ment reproducibility can be considered to be sat-isfactory for our purposes. Similarly, the sagittal distance was measured on the outlines of the sections.
Fig. 1. Representation of the different regions of the vocal tract on a mid-sagittal profile for the vowel [u] uttered by the female subject.
Fig. 2. Position of the 14 scans on the mid-sagittal profile for the vowel [u] uttered by the female subject along with the corresponding scans.
Fig. 3. Position of the 14 scans on the mid-sagittal profile for the vowel [i] uttered by the male subject along with the corresponding scans.
An example of a measurement superimposed on the corresponding MRI slice is given in Fig. 4. In the lower pharynx region, the area and the corresponding sagittal distance were limited by the epiglottis. The contour of the teeth has been ap-proximated when necessary during the outline of the section, using data on tooth size and loca-tion obtained from plaster casts and visual esti-mates.
3. Method
3.1. Selection of sagittal to area transformations Among the many transformations proposed in the literature, we chose four: the transformations designed by Maeda (1978, 1990), Sundberg (1969), Sundberg et al. (1987), Fant (1992) and Perrier et al. (1992). This choice was motivated by the variety of techniques used by the authors to define their transformation. Maeda’s model is based on the study of 1000 sagittal profiles corresponding to 10 sentences uttered by one French female speaker. Sundberg’s model is based on the study of X-ray tomographic data from one male and one female Swedish speakers and plaster casts from three male and three female Swedish speakers; we used the data from the subject Male 2 (see Sundberg et al., 1987). Fant’s model is based on the study of X-ray lateral views supported by limited X-ray tomographic data from a Swedish male subject. Perrier’s model is based on the study of a vocal tract cast for large sagittal dimensions and on CT scans of the vocal tract constriction regions of one male speaker for the three cardinal vowels [i, a, u] of French.
For the labial region, among the four studied transformations, only Maeda (1978, 1990) and Fant (1992) provide the transformation to convert the lip height to the lip area.
3.2. Speaker-specific transformation
We have investigated three possible forms of the transformation. The first was a linear relation-ship,
AðxÞ ¼l0þl1dðxÞ; ð3Þ
wherel0andl1 are the parameters.
The second was a polynomial transformation,
AðxÞ ¼p0þp1dðxÞ þp2dðxÞ 2
; ð4Þ
wherep0; p1andp2are the parameters. The order
of the polynomial was limited to two in order to
Fig. 4. Measurement of the sagittal distance and the cross-sectional area on an MRI scan.
Table 1
Reproducibility of the digitization process Areas (cm2)
Repetition Section 1 Section 2 Section 3
1 2.177 0.507 0.064 2 2.178 0.502 0.070 3 2.176 0.508 0.073 4 2.175 0.508 0.072 5 2.177 0.511 0.070 6 2.174 0.503 0.066 7 2.183 0.507 0.073 8 2.188 0.507 0.067 9 2.176 0.503 0.068 10 2.181 0.509 0.069 Mean 2.179 0.506 0.069 Standard deviation 0.0044 0.0030 0.0030
have enough data to estimate the transformation parameters reliably.
The third transformation was the classical power function, as in Eq. (1), where the parame-ters areaandb.
For each transformation, the parameter values depend on the speaker and on the region in the vocal tract.
3.3. Evaluation
As the purpose of the transformation is the es-timation of the unknown cross-sectional area from a measured mid-sagittal distance, the evaluation has to be made on measurements not used for determining the parameters defining the transfor-mation. Therefore, we performed the evaluation of each measurement using a jackknife method. The parameters of the transformation were estimated from all but one measurement of a vocal tract region of a speaker. The resulting transformation was tested on the remaining measurement. This procedure was repeated for each measurement of a particular vocal tract region, for each vocal tract region, each form of transformation and both speakers.
This procedure has two main characteristics. First, the transformation will be evaluated relative to their intended purpose, the estimation of the unknown cross-sectional area from a measured mid-sagittal distance, and not the best possible fit to a set of measurements. Second, the stability of the parameters of each form of transformation for the different vocal tract regions can be studied to give an insight on the generality or the over-spec-ificity of the transformation.
4. Results
4.1. Comparison of the different transformations In order to compare the performance of the different transformations described above, we com-puted for both speakers and for each region of the vocal tract the mean and the standard devia-tion of the relative errors. The relative error is positive if the area is overestimated by the
trans-formation and negative in the opposite case. The results are presented in Tables 2 and 3 for the fe-male and the fe-male speaker, respectively.
The main observations are as follows:
• As expected, the speaker-specific
transforma-tions have, in general, a smaller mean relative error and standard deviation. It is however in-teresting to notice that for the alveolar region of the female subject, Sundberg and Fant trans-formations give a lower mean and all give a lower standard deviation.
• In general, the power transformation gives
lower mean relative error than the linear and the polynomial transformations. This tendency is only contradicted in the oro-pharynx region for the female subject, where the linear transfor-mation is better and in the lip region for the male subject, where the polynomial transforma-tion is better.
• The standard deviations are comparable for the
polynomial and the power transformations, and somewhat larger for the linear one.
• The speaker-specific transformations give
low-relative estimation error in the regions between the mid-pharynx and the hard palate. The other regions are not modeled correctly.
• The four selected transformations overestimate
the area for the regions between the mid-phar-ynx and the hard palate (especially for the male subject). Only Maeda’s transformation provides a good estimate of the areas in these regions for the female subject.
4.2. Speaker-specific transformations parameters Tables 4 and 5 display the mean coefficients derived from the MRI data for the female and the male subjects, respectively. The standard devia-tions are also given.
It can be seen that the classical power trans-formation provides stable parameters in every vocal tract region for both the speakers. The sec-ond order polynomial transformation turns out to be the most sensitive to details in the training set, especially in the larynx, the alveolar and the labial regions. This sensitivity is not a good property, since it indicates that the transformation does not
Table 2
Mean and standard deviation in percentage of the relative estimation errors for the different transformations for each region of the vocal tract of the female speaker
Speaker-specific transformations Transformations of different studies
Region Linear Polynomial Power Maeda Sundberg Fant Perrier
Larynx 17.8 [57.3] 18.8 [69.7] 8.0 [40.1] 106.6 [83.1] 44.4 [51.5] 81.1 [52.6] 169.3 [129.3] Low-pharynx 4.8 [29.2] 4.0 [29.1] 2.9 [28.8] )1.5 [23.8] )16.0 [24.7] 14.7 [25.3] 11.1 [53.8] Mid-pharynx )3.2 [20.2] 2.0 [12.7] )0.0 [13.4] 3.4 [11.0] 7.9 [16.1] 23.7 [22.3] 23.5 [54.6] Oro-pharynx 2.2 [38.6] 6.4 [27.4] 2.9 [38.5] 11.7 [37.4] 30.3 [39.1] 30.8 [51.2] 21.5 [66.9] Velum 6.7 [34.9] 6.9 [33.9] 4.2 [33.7] 6.3 [34.4] 44.7 [45.5] 50.0 [48.6] 30.5 [73.8] Hard palate )17.5 [77.1] 3.7 [32.5] 3.2 [29.4] )4.2 [26.2] 34.9 [36.6] 36.6 [36.5] )0.3 [31.4] Alveolar 24.8 [89.1] 8.4 [98.4] 16.3 [82.8] )23.5 [36.0] )3.5 [48.8] )2.2 [48.1] )47.8 [24.3] Lips 9.8 [50.3] 8.5 [60.6] 6.4 [44.5] 19.5 [37.7] )40.0 [30.4] )40.0 [30.4] )40.0 [30.4] Table 3
Mean and standard deviation in percentage of the relative estimation errors for the different transformations for each region of the vocal tract of the male speaker
Speaker-specific transformations Transformations of different studies
Region Linear Polynomial Power Maeda Sundberg Fant Perrier
Larynx 9.2 [42.6] 3.7 [54.8] 5.7 [37.3] 3.3 [43.9] )37.6 [28.4] )63.7 [23.7] 72.1 [65.1] Low-pharynx 3.8 [26.7] 5.6 [26.9] 2.7 [25.3] )2.0 [23.5] )18.3 [23.0] 18.3 [25.6] 21.7 [43.0] Mid-pharynx )5.0 [42.1] 2.5 [20.5] 1.5 [21.6] 33.2 [34.3] 45.1 [46.6] 50.2 [30.5] 42.9 [32.2] Oro-pharynx )1.1 [17.2] 0.3 [13.3] 0.1 [13.6] 65.0 [27.7] 71.1 [39.2] 99.1 [48.2] 91.2 [54.0] Velum 1.5 [14.5] 1.7 [15.1] 0.8 [13.9] 48.5 [24.1] 98.0 [30.3] 109.7 [34.1] 107.4 [63.9] Hard palate )4.8 [26.5] 6.4 [31.2] 2.3 [21.2] 28.4 [22.4] 65.1 [35.3] 73.2 [33.8] 84.3 [51.1] Alveolar 6.9 [38.8] 14.9 [51.3] 8.4 [40.6] 9.0 [37.6] 31.4 [43.2] 35.4 [45.0] )21.4 [34.0] Lips 6.1 [42.2] 2.1 [50.4] 5.5 [29.6] 5.5 [43.3] )60.9 [9.6] )60.9 [9.6] )60.9 [9.6] 176 A. Soquet et al. / Speech Communication 36 (2002) 169–180
Mean and standard deviation in percentage of the parameter values for the three transformation forms for each region of the vocal tract of the female speaker
Linear Polynomial Power
Region l0 l1 p0 p1 p2 a b Larynx )0.06 [0.18] 1.01 [0.33] 0.83 [1.25] )1.46 [3.87] 1.92 [2.36] 0.78 [0.08] 0.70 [0.20] Low-pharynx )0.24 [0.03] 2.19 [0.02] )0.49 [0.08] 2.61 [0.11] )0.15 [0.04] 1.86 [0.02] 1.22 [0.03] Mid-harynx )0.74 [0.10] 2.47 [0.07] 0.58 [0.14] 0.26 [0.26] 0.78 [0.11] 1.74 [0.03] 1.23 [0.03] Oro-pharynx )0.02 [0.20] 1.89 [0.11] 1.52 [0.20] )0.49 [0.31] 0.73 [0.11] 1.99 [0.11] 0.81 [0.08] Velum )0.10 [0.07] 1.95 [0.05] 0.16 [0.11] 1.50 [0.20] 0.16 [0.07] 1.84 [0.03] 0.93 [0.03] Hard palate )1.00 [0.04] 3.09 [0.05] )0.18 [0.07] 1.39 [0.19] 0.64 [0.09] 1.82 [0.02] 1.43 [0.01] Alveolar )0.29 [0.30] 3.08 [0.31] )3.34 [1.65] 10.11 [3.23] )3.71 [1.53] 2.67 [0.11] 1.48 [0.22] Lips )0.88 [0.17] 3.41 [0.32] )1.21 [1.00] 4.48 [3.44] )0.77 [2.59] 2.42 [0.18] 1.67 [0.10] Table 5
Mean and standard deviation in percentage of the parameter values for the three transformation forms for each region of the vocal tract of the male speaker
Linear Polynomial Power
Region l0 l1 p0 p1 p2 a b Larynx )3.48 [0.24] 4.44 [0.14] )4.42 [1.77] 5.64 [2.34] )0.37 [0.68] 1.11 [0.05] 2.35 [0.07] Low-pharynx )1.02 [0.12] 2.87 [0.07] 0.27 [0.33] 0.86 [0.48] 0.70 [0.16] 1.79 [0.05] 1.38 [0.05] Mid-pharynx )1.30 [0.05] 2.75 [0.05] 0.20 [0.10] 0.01 [0.20] 1.06 [0.08] 1.34 [0.01] 1.62 [0.02] Oro-pharynx )2.87 [0.25] 2.74 [0.10] 1.35 [0.72] )1.00 [0.60] 0.79 [0.12] 0.73 [0.05] 1.81 [0.07] Velum )0.22 [0.07] 1.60 [0.05] )0.04 [0.16] 1.36 [0.25] 0.07 [0.09] 1.39 [0.01] 1.08 [0.02] Hard palate )1.40 [0.11] 2.71 [0.07] 0.36 [0.15] 0.33 [0.23] 0.68 [0.08] 1.34 [0.03] 1.51 [0.03] Alveolar )0.46 [0.14] 2.47 [0.13] 0.58 [0.16] 1.05 [0.24] 0.36 [0.09] 1.92 [0.04] 1.20 [0.15] Lips )1.63 [0.09] 5.35 [0.19] )1.89 [0.58] 6.27 [2.06] )0.75 [1.55] 4.72 [0.28] 2.48 [0.07] A. Soquet et al. / Speech Communication 36 (2002) 169–180 177
capture a general tendency but fits details peculiar to the training set.
The stability of the parameters of the linear transformation is better than those of the poly-nomial transformation and comparable to the power transformation.
It can be observed that, for the power trans-formation, the low- and the mid-pharyngeal re-gions turn out to have similar parameters and could be merged. The same holds for the oro-pharyngeal and the velar regions. On the contrary, the polynomial transformation does not allow such grouping. Again, this shows the higher sen-sitivity of the polynomial transformation to details present in the data.
5. Discussion 5.1. MRI data
The sequence we used to obtain the MRI scans yielded 14 different images during a single pro-duction of each vowel. However some problems remain. Firstly, there is a limitation on the number of images for a given acquisition time. This does not allow the number of images to be increased so as to obtain a continuous area function during a single vowel phonation.
Secondly, it was not possible to adjust the po-sition of each individual cut to be perfectly or-thogonal to the midline of the vocal tract. This drawback has to be considered in relation to the fact that both the area and the corresponding sagittal distance are measured in a plane that is perhaps misaligned. The imaging plane was how-ever orthogonal to the sagittal plane. Thus, both the sagittal distance and the area should vary proportionally to the cosine of the misalignment angle. Concerning the transformations, the am-plitude of the error caused by the misalignment will depend on the non-linearity of the relation-ship.
Thirdly, the experimenter should be aware that information is degraded or lost at the intersection between two different cuts. It follows that in-tersections in the regions of interest in the vocal tract are to be avoided. This phenomenon is
il-lustrated in Fig. 5, where darkened lines represent the intersections between the coronal cuts and the coronal oblique cut in the anterior part of the face.
5.2. Transformation evaluation
The problem of the estimation of the area function from the sagittal cut plays an important role in many studies and models of speech pro-duction mechanisms. Indeed, most vocal tract models appear to model the geometry of the sag-ittal cut (Mermelstein, 1973, Maeda, 1978). Mod-eling of the sagittal cut is convenient because it allows the overall position of the different ar-ticulators involved in speech production to be captured in one single two-dimensional represen-tation.
Up to the late eighties, the scarce data available was composed of sagittal images obtained by X-rays (see for example, Chiba and Kajiyama, 1941; Fant, 1960; Bothorel et al., 1986). Therefore, most representations of the vocal tract were made in the
Fig. 5. Intersections of coronal cuts (scans 10–14) with coronal oblique cut (scan 9) showed by the darkened lines (vowel [i] pronounced by the male subject).
sagittal plane. Sagittal images obtained with X-rays are obtained by projecting the vocal tract in a sagittal plane. The contour that can then be traced on the resulting image does not strictly correspond to the sagittal cut of the speaker. For example, Stone (1990) and Demolin et al. (1996) have shown the importance of the depression in the tongue profile (see Fig. 5). This depression has to be taken into account if one estimates the area function from a sagittal cut measured on an X-ray image.
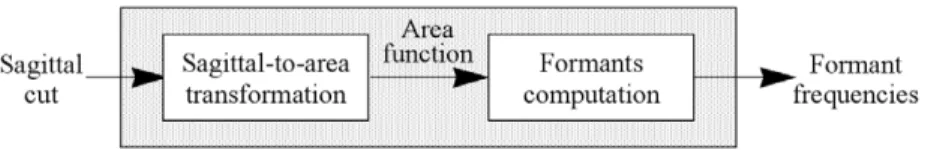
It is well known that when one deals with sag-ittal cuts – either measured or obtained with a vocal tract model – and wishes to infer the acoustical properties of the vocal tract thereby described, the normal procedure is to rely on a sagittal cut to area transformation to obtain the area function, and then to compute the acoustic result from this area function (see Fig. 6).
Therefore, depending on the transformation, the acoustic result can be noticeably different.
When one deals with acoustic-to-articulatory inversion, the influence of the transformation is even more obvious (Beautemps et al., 1995). In-deed, if the inversion is based on an acoustical criterion, to obtain the measured acoustic cues, the parameters of the vocal tract model will have to be adjusted so as to obtain an area function that produces similar acoustic cues. The sagittal cut will then differ, depending on the transformation. The interpretation of parameters thus-obtained has to be done with care.
Advances in imaging techniques have allowed improvements in the way that vocal tract geometry is studied. It is well known that the human vocal tract is a highly flexible structure (Fant, 1960), but it has only recently been confirmed that cross-sections can (i) vary considerably along its length (Stone, 1991; Demolin et al., 1996; Soquet et al., 1996) and (ii) show a high degree of asymmetry
(Stone, 1991). Thus two-dimensional data are not sufficient to fully understand the production of speech sounds. Moreover, the stabilization of the tongue against other articulators, such as the teeth and hard palate, facilitates the production of cer-tain tongue shapes which could otherwise seem difficult to produce accurately, as, for example, narrow constrictions leading to turbulent airflow in fricatives and laterals (Stone, 1991; Narayanan et al., 1995). It is thus obvious that the vocal tract has to be considered as a three-dimensional struc-ture in order to study both speech production and the link between articulatory and acoustic space.
6. Conclusion
The data provided by MRI proved to be of considerable interest in this study. The availability of information about the shape of the tract al-lowed us to compare the transformations on the basis of a reliable reference. These transformations were based on the study of a few subjects, with imaging techniques less elaborate than the MRI techniques used today. The study confirms that the use of these transformations on subjects other than the original ones is inappropriate and may lead to errors (Sundberg et al., 1987; Fant, 1992; Perrier et al., 1992).
Three forms of sagittal to area transformation have been studied: linear, polynomial (of order 2) and the classical power function. The evaluation showed that the power transformation seems more adapted to the problem, providing parameters that are stable with regard to the measurements used for their estimation, with relatively small mean errors. However, these transformations only cap-ture general properties of the relationship.
Acknowledgements
This work has been partially supported by the ‘‘Fonds National de la Recheche Scientifique’’
(Didier Demolin – Creedits Chercheurs No.
8.4519.95 and No. 1.5.194.97; Alain Soquet – Collaborateur Scientifique) and by the ‘‘Commu-nautee Francßaise de Belgique’’ in the framework of the ARC 98-02 No. 226.
References
Baer, T., Gore, J.C., Gracco, L.C., Nye, P.W., 1991. Analy-sis of vocal tract shape and dimensions using magnetic resonance imaging: vowels. J. Acoust. Soc. Am. 90 (2), 799–828.
Beautemps, D., Badin, P., Laboissieere, R., 1995. Deriving vocal-tract area functions from midsagittal profiles and formant frequencies: A new model for vowels and fricative consonants based on experimental data. Speech Communi-cation 16, 27–47.
Bothorel, A., Simon, P., Wioland, F., Zerling, J.P., 1986. Cineeradiographie des voyelles et consonnes du francßais. Travaux de l’Institut de Phoneetique de Strasbourg. Chiba, T., Kajiyama, M., 1941. The Vowel, its Nature and
Structure. Tokyo-Kaiseikan, Tokyo.
Demolin, D., Metens, T., Soquet, A., 1996. Threedimensional measurements of the vocal tract by MRI. In: Proceedings of the International Conference on Spoken Language Processing, Philadelphia, PA, pp. 272–275.
Fant, G., 1960. Acoustic Theory of Speech Production. Mouton, The Hague.
Fant, G., 1992. Vocal tract area functions of Swedish vowels and a new three-parameter model. In: Proceedings of the International Conference on Spoken Language Processing, Banff, pp. 807–810.
Fujimura, O., Kiritani, S., Ishida, H., 1973. Computer controller radiography for observation of movements of articulatory and other human organs. Comput. Biol. Med. 3, 371–384. Greenwood, A.R., Goodyear, C.C., Martin, P.A., 1992.
Mea-surements of vocal tract shapes using magnetic resonance imaging. IEE Proc. – I 139 (6), 553–560.
Heinz, J.M., Stevens, K.N., 1965. On the relations between lateral cineradiographs area functions, and acoustic spectra of speech. In: Proc. Fifth Int. Congr. Acoust. Lieege, Paper A44.
Johanson, C., Sundberg, J., Wilbrand, H., Ytterbergh, C., 1983. From sagittal distance to area: a study of transverse, cross-sectional area in the pharynx by means of computer tomography. STL-QPSR 4, 39–49.
Ladefoged, P., Anthony, J.F.K., Riley, C., 1971. Direct measurement of the vocal tract. UCLA Working Papers in Phonetics, pp. 4–13.
Lakshminarayanan, A.V., Lee, S., McCutcheon, M.J., 1991. MR imaging of the vocal tract during vowel production. J. Mag. Res. Imag. 1 (1), 71–76.
Maeda, S., 1978. Une analyse statistique sur les positions de la langue: eetude preeliminaire sur les voyelles francßaises. In: Actes des IXeemes Journeees d’Etude sur la Parole, pp. 191–199.
Maeda, S., 1990. Compensatory articulation during speech: evidence from the analysis and synthesis of vocal-tract shapes using an articulatory model. In: Hardcastle, W.J., Marchal, A. (Eds.), Speech Production and Speech Mod-eling. Kluwer Academic Publishers, pp. 131–149.
Mermelstein, P., 1973. Articulatory model for the study of speech production. J. Acoust. Soc. Am. 53, 1070–1082. Narayanan, S.S., Alwan, A.A., Haker, K., 1995. An
articula-tory study of fricative consonants using magnetic reso-nance imaging. J. Acoust. Soc. Am. 98, 1325–1347. Perrier, P., Bo€ee, L.J., Sock, R., 1992. Vocal tract area function
estimation from midsagittal dimensions with CT scans and a vocal tract cast: modeling the transition with two sets of coefficients. J. Speech Hear. Res. 35, 53–67.
Schonle, P., Grabe, K., Wenig, P., Hohne, J., Schrader, J., Conrad, B., 1987. Electromagnetic articulography: use of alternating magnetic fields for tracking movements of multiple points inside and outside the vocal tract. Brain Lang. 31, 26–35.
Soquet, A., Lecuit, V., Metens T., Demolin, D., 1996. From sagittal cut to area function: an MRI investiga-tion. In: Proceedings of the International Conference on Spoken Language Processing, Philadelphia, PA, pp. 1205– 1208.
Stone, M., 1990. A three-dimensional model of tongue move-ment based on ultrasound and X-ray microbeam data. J. Acoust. Soc. Am. 87 (5), 2207–2217.
Stone, M., 1991. Toward a model of three-dimensional tongue movement. J. Phonetics 19, 309–320.
Sundberg, J., 1969. On the problem of obtaining area functions from lateral X-ray pictures of the vocal tract. STL QPSR. Stockholm, pp. 43–45.
Sundberg, J., Johansson, C., Wilbrand, H., Ytterbergh, C., 1987. From sagittal distance to area. A study of transverse, vocal tract cross-sectional area. Phonetica 44, 76–90.
![Fig. 1. Representation of the different regions of the vocal tract on a mid-sagittal profile for the vowel [u] uttered by the female subject.](https://thumb-us.123doks.com/thumbv2/123dok_us/1786165.2754894/3.816.72.382.137.335/representation-different-regions-sagittal-profile-uttered-female-subject.webp)
![Fig. 2. Position of the 14 scans on the mid-sagittal profile for the vowel [u] uttered by the female subject along with the corresponding scans.](https://thumb-us.123doks.com/thumbv2/123dok_us/1786165.2754894/4.816.238.577.136.505/position-scans-sagittal-profile-uttered-female-subject-corresponding.webp)
![Fig. 3. Position of the 14 scans on the mid-sagittal profile for the vowel [i] uttered by the male subject along with the corresponding scans.](https://thumb-us.123doks.com/thumbv2/123dok_us/1786165.2754894/5.816.82.740.145.954/position-scans-sagittal-profile-vowel-uttered-subject-corresponding.webp)

![Fig. 5. Intersections of coronal cuts (scans 10–14) with coronal oblique cut (scan 9) showed by the darkened lines (vowel [i]](https://thumb-us.123doks.com/thumbv2/123dok_us/1786165.2754894/10.816.428.740.134.456/intersections-coronal-scans-coronal-oblique-showed-darkened-lines.webp)