YU WANG
Information Content
of Mutual Fund
Portfolio Disclosure
YU W ANG- Information Content of Mutual Fund Portfolio Disclosur
e
ERIM PhD Series
Research in Management
Erasmus Resear
ch Institute of Management
-242 ERIM
Design & layout: B&T
Ontwerp en advies (www
.b-en-t.nl) Print: Haveka (www
.haveka.nl)
INFORMATION CONTENT OF MUTUAL FUND PORTFOLIO DISCLOSURE
Academic financial economists have been keenly interested in the value of active portfolio management since the seminal paper of Jensen (1968). This book examines the information advantages that active mutual fund managers attain in financial markets through an analysis of disclosed fund holdings. Performance evaluation at the security level allows us to paint a more comprehensive picture of fund managers’ security-selection talents. The three chapters in this book constitute an empirical investigation of the information content of mutual fund portfolio disclosure. Chapter 2 examines the value of active funds’ portfolio disclosure from an outside investor’s perspective. Hypothetical copycat funds that duplicate the disclosed asset holdings of actively managed funds can generate performance that is comparable their primitive targets. More interestingly, their relative success increases after the U.S. SEC mandates more frequent portfolio disclosure. Chapter 3 studies the information content of the active portion of fund investments by creating a stock-level measure that seeks to aggregate various pieces of information scattered among active funds, as revealed through their over- and underweighting decisions. Active funds’ portfolio deviations from benchmarks can strongly and positively predict future stock returns. The findings establish a robust link between active fund investments and asset prices. Chapter 4 further explores the role that active mutual funds play in bringing about price efficiency. Active funds are able benefit from fundamental analysis and their information advantages are mainly attributed to their expertise in forecasting and processing fundamental information.
The Erasmus Research Institute of Management (ERIM) is the Research School (Onder -zoek school) in the field of management of the Erasmus University Rotterdam. The founding participants of ERIM are the Rotterdam School of Management (RSM), and the Erasmus School of Econo mics (ESE). ERIM was founded in 1999 and is officially accre dited by the Royal Netherlands Academy of Arts and Sciences (KNAW). The research under taken by ERIM is focused on the management of the firm in its environment, its intra- and interfirm relations, and its busi ness processes in their interdependent connections.
The objective of ERIM is to carry out first rate research in manage ment, and to offer an ad vanced doctoral pro gramme in Research in Management. Within ERIM, over three hundred senior researchers and PhD candidates are active in the different research pro -grammes. From a variety of acade mic backgrounds and expertises, the ERIM commu nity is united in striving for excellence and working at the fore front of creating new business knowledge.
Erasmus Research Institute of Management - Rotterdam School of Management (RSM) Erasmus School of Economics (ESE) Erasmus University Rotterdam (EUR) P.O. Box 1738, 3000 DR Rotterdam, The Netherlands
Tel. +31 10 408 11 82 Fax +31 10 408 96 40 E-mail info@erim.eur.nl Internet www.erim.eur.nl
De informatieve waarde van openbare informatie over de portefeuilles van belegginsgondsen
PROEFSCHRIFT
to obtain the degree of Doctor from the Erasmus University Rotterdam
by command of the rector magnificus Prof.dr. H.G. Schmidt
and in accordance with the decision of the Doctorate Board
The public defence shall be held on 9 September 2011 at 09.30 hrs
by
YUWANG
Promotor: Prof.dr. M.J.C.M. Verbeek
Copromotor: Dr. H. Jiang
Other members: Prof.dr. W.F.C. Verschoor
Dr. R. Wermers Dr. M.A. van Dijk
Erasmus Research Institute of Management (ERIM)
The joint research institute of the Rotterdam School of Management (RSM) and the Erasmus School of Economics (ESE) at the Erasmus University Rotterdam Internet: http://www.erim.eur.nl
ERIM Electronic Series Portal: http://hdl.handle.net/1765/1
ERIM Ph.D. Series Research in Management, 242
ERIM reference number: EPS-2011-242-F&A ISBN: 978-90-5892-285-4
c
2011, Yu Wang
Design: B&T Ontwerp en advies www.b-en-t.nl
This publication (cover and interior) is printed by haveka.nl on recycled paper, ReviveR. The ink used is produced from renewable resources and alcohol free fountain solution.
Certifications for the paper and the printing production process: Recycle, EU Flower, FSC, ISO14001. More info: http://www.haveka.nl/greening
All rights reserved. No part of this publication may be reproduced or transmitted in any form or by any means electronic or mechanical, including photocopying, recording, or by any information storage and retrieval system, without permission in writing from the author.
Preface
Back in 2008 when I became part of this research project, the majority of the academic studies on mutual funds used return-based performance measurement. The general consensus of this line of research was a puzzle that the fast-growing actively managed mutual funds on average generate disappointing net performance, underperforming passive benchmark indices. Do mutual fund managers who aggressively add stocks to (or liquidate stocks from) their portfolios add value? This is a question over which there has been a longstanding dispute in both academia and financial industry. Fortunately, we have seen more and more papers attempting to gain deeper understanding of this issue by examining performance at the security level based on portfolio holdings. This PhD thesis is among one of them. I thank Marno Verbeek, my supervisor, for initiating this fascinating and challenging research project. I hope my research efforts in the past three years can shed some light on the topic of active asset management.
The very first paper of our project, the basis for Chapter 2 of this book, is a very important step in my PhD life. This paper looks at the impact of reporting frequency on the profitability of a free-riding strategy, i.e. the simplest way in which holdings information can be used by outsiders. What I learned along the path of achieving this paper, not only the research skills but also how to face intellectual challenges will be an estate for my life. I am so grateful to Marno, who guided me through the entire project, for his patient guidance, generous understanding, and most importantly, endless encouragement. Thanks to Marno, I came to understand what an excellent researcher means: creative, conscientious, independent, and never give up! Marno is a great econometrician, a committed supervisor and a trustworthy coauthor. This book would not have been completed without his trust and support, whenever I needed. Another very important person who has a tremendous influence on my academic research is Hao Jiang, one of my coauthors. We cooperated on my second paper (Chapter 3 of the book) that examines the informational role of active mutual funds in financial markets by relating active fund investments to asset prices. My interactions with Hao steered the focus of my research into the information content of fund portfolio decisions, the main message this whole book aspires to deliver. I owe him many many
thanks for his inspiring ideas, openness to discussions, and selfless help throughout the whole process. Hao is a very clever researcher, but he is also a very supportive friend in life. I am also indebted to my coauthor Rui Shen, a key contributor to my third research paper in which we further explore the nature of the information possessed by fund managers. I thank him for introducing me to the accounting literature on security fundamental analysis and for the many valuable research insights he gave me. Brainstorming with Rui was always a pleasant experience, even on a basketball court.
My special thanks go to other members of my doctoral committee, Mathijs van Dijk, Willem
Verschoor, Lars Norden, Gerard Mertens, fromErasmus University, Alessandro Beber, from
University of Amsterdam, Jenke ter Horst fromUniversity of Tilburg, and Russ Wermers from University of Maryland. I would like to express my gratitude again to Russ for his kind sugges-tions on programming tools when I started my PhD. Many of his research works use holdings data and he has broken new ground for fund performance evaluation. This book owes an enor-mous intellectual debt to all of the many people who have taken the time to give me comments at seminars and conferences. I thank all my colleagues at RSM for creating an enjoyable and pro-ductive working environment. I appreciate several generations of finance PhD students at RSM who brought a lot of fun to my work and life, especially Jingnan, Tao, Eric, Olga, Oliver, Henry, Xiaohong, Melissa, Ruben, Pooyan, Dimitrios, Manuel, Dominique, Teng, and Teodor. I am
also grateful to ERIM and theDepartment of Financeof RSM for providing generous financial
support, which made international conference presentations possible.
My parents deserves a special place in this preface. Their unconditional support and endless love have been the most precious treasure in my life. I always hope that one day I could achieve something that they can be proud of. My deepest gratitude goes to my mother who left me for-ever when I just started my PhD. I miss her so much. This book is dedicated to my dearest mother.
Yu Wang
Rotterdam, The Netherlands April, 2011
Contents
Preface i
1 Introduction 1
1.1 Motivation . . . 2
1.2 Outline of the Thesis . . . 3
2 Better than the Original? The Relative Success of Copycat Funds 7 2.1 Introduction . . . 7
2.2 Institutional Background and Data . . . 10
2.3 Constructing Copycat Funds . . . 12
2.3.1 Measuring Copycat Portfolio Gross Returns . . . 14
2.3.2 Estimating Trading Costs and Expenses of Copycat Funds . . . 15
2.3.3 Representativeness of Fund Portfolio Disclosure . . . 16
2.4 Disclosure Frequency and Copycat Fund Performance . . . 17
2.4.1 Performance Comparisons . . . 18
2.4.2 Disclosure Frequency and Tracking Performance . . . 21
2.4.3 The Impact of Disclosure Policy Change on the Tracking Performance . . 23
2.5 The Cross-Section of Copycat Fund Performance . . . 29
2.5.1 Panel Regressions Explaining the Performance Differential . . . 29
2.5.2 Portfolio Sorts on Representativeness of Holdings . . . 31
2.5.3 Portfolio Sorts on Past Performance . . . 37
2.6 Conclusion . . . 43
2.A Database Construction and Sample Selection . . . 44
3 Information Content when Mutual Funds Deviate from Benchmarks 47 3.1 Introduction . . . 47
3.3 Sample and Summary Statistics . . . 54
3.3.1 Data and Sample Selection . . . 54
3.3.2 Benchmark Index Holdings . . . 54
3.3.3 Summary Statistics for the Mutual Fund Sample . . . 55
3.3.4 Characteristics of Stocks with ExtremeDF B . . . 55
3.4 Information Content ofDF B. . . 57
3.4.1 Return Forecasting Power ofDF B . . . 59
3.4.2 Informed Fund Managers or Mutual Fund Herding? . . . 64
3.4.3 Stock Characteristics . . . 67
3.4.4 Fund Characteristics . . . 69
3.4.5 DF Band Corporate Earnings News . . . 70
3.4.6 DF Band Mutual Fund Performance . . . 73
3.5 Robustness Checks . . . 77
3.5.1 Alternative Measures ofDF B . . . 77
3.5.2 Changes inDF B . . . 78
3.5.3 Subperiod Analysis . . . 81
3.5.4 Conditional Performance Evaluation . . . 81
3.5.5 Preferential allocations of IPOs . . . 85
3.6 Conclusion . . . 85
3.A An Illustrative Interpretation ofDF B . . . 87
3.B Sample Selection . . . 88
3.C Benchmark Holdings . . . 89
3.D Comparison with Chen, Jegadeesh, and Wermers (2000) . . . 91
4 Do Mutual Fund Managers Trade on Stock Intrinsic Values? 93 4.1 Introduction . . . 93
4.2 The Residual Income Valuation Model . . . 96
4.3 Sample Description and Summary Statistics . . . 98
4.3.1 Stock Data . . . 98
4.3.2 Mutual Fund Sample Selection . . . 99
4.3.3 Summary Statistics . . . 99
4.4 Do Mutual Funds Trade on Intrinsic Value? . . . 100
4.4.1 Confirming theV /P Effect . . . .100
4.5 Do Mutual Funds Profit from Discovering Intrinsic Value? . . . 110
4.5.1 Mutual FundV /P Timing Measure . . . .111
4.5.2 Characteristics of Funds with ExtremeV P T . . . 111
4.5.3 Do High-V P TFunds Profit fromV /PEffect? . . . .113
4.6 Mutual Fund Trading andV /P Effect . . . .118
4.7 Conclusion . . . 120
4.A Sample Selection . . . 121
5 Concluding Remarks 123
Bibliography 127
Nederlandse samenvatting (Summary in Dutch) 135
Chapter 1
Introduction
The enviable pace of growth of the U.S. mutual fund industry for much of the past decades has witnessed the increasing investors’ reliance on professional investment advice. The U.S. mutual fund industry–with $11.1 trillion in assets under management at year-end 2009–has become one of the largest groups of investors in U.S. companies, holding 24 percent of the outstanding shares of U.S.-issued stocks by the end of year 2009 (2010 Investment Company Institute). Investor de-mand for mutual funds is influenced by a variety of factors, one of which is the return-generating ability of fund managers who presumably, as a group, are supposed to possess superior private information regarding security mispricing.
Academic financial economists have been keenly interested in the value of active portfolio management since the seminal paper of Jensen (1968). The general consensus that mutual funds on average fail to outperform market and their passive benchmarks does not preclude finding
subgroups of skilled managers.1 From the perspective of equilibrium accounting, the aggregate
portfolio of actively managed U.S. equity mutual funds is close to the market portfolio (Fama and French, 2010). This means the active investment must be a zero sum game—-active funds with positive true alpha are balanced by other funds with negative alpha. A skilled active fund manager will exhibit portfolio tilts consistent with the private information he receives concern-ing future stock returns. The present thesis examines such information through an analysis of disclosed fund holdings. Performance evaluation at the security level allows us to gain a more comprehensive understanding of the value of active money management and decompose vari-ous security-selection talents. The thesis further provides insight into the informational role that active fund managers play in financial markets.
1Studies of mutual fund returns generally report disappointing fund performance (e.g., Jensen, 1968, Malkiel, 1995, Carhart, 1997, Fama and French, 2010). For evidence supporting the value of active investing, see Avramov and Wermers (2006) and Wermers, Yao, and Zhao (2007).
1.1
Motivation
The U.S. Securities and Exchange Commission requires each mutual fund to periodically dis-close a complete portfolio holdings schedule to investors. If the reported holdings unveil valu-able investment opportunities and more importantly such opportunities are not transitory, outside investors who trade on such information would be able to share the benefits of fund research without incurring the actual cost of owning the fund shares. In 2004, the SEC adopted enhanced regulations that increased the frequency of portfolio disclosure from semi-annually to quarterly. On the one hand, more frequent portfolio disclosure by mutual funds would allow investors to better monitor the extent of their portfolio diversification and hence make more informed asset allocation decisions. On the other hand, under a more frequent disclosure mandate, predatory trading practices would increase and adversely affect fund performance by preventing a fund from fully realizing the potential benefits of its research efforts. The first part of this thesis ad-dresses the question to what extent fund portfolio disclosure reveals valuable information for outsiders and whether the enhanced SEC regulations have increased the potential for outsiders to benefit. These questions are important to increase our understanding of the simplest way in which disclosed holdings information can be exploited by individual investors.
Despite the increasing importance of mutual fund industry, the informational role that mu-tual funds play in determining security prices remains ambiguous. Given the large amount of resources active funds spend on security analysis and research, we might expect them to be good candidates for informed investors, whose costly information acquisition helps impound infor-mation into asset prices (Grossman and Stiglitz, 1980). Prior literature on fund performance, however, has painted a disheartening picture of active funds’ performance at the aggregate level. Can we reconcile this in a fully rational framework? Berk and Green (2004) outline a model in which managers collect fees as a fixed percentage of assets under management and thus attempt to maximize fund assets. In their model, managers mix their alpha-generating ideas with a bench-mark portfolio. Their information-based investments in an individual stock will push the price of that stock toward fair value. Hence, the amount of profit that a manager can extract from a given investment idea is limited. In equilibrium each manager will raise assets until the fees are equal to the alpha that can be extracted from his private information. This leaves individual investors with a return close to the benchmark. With portfolio holdings data at hand, we are interested in evaluating the performance of the information-driven portion of active funds’ investments and understanding how effectively active fund managers can exploit market inefficiencies based on their superior information concerning future stock returns. To better assess whether active fund
managers attain informational advantages in discovering valuable investment opportunities, the second part of the thesis examines the active portion of fund investments, that is, the portfolio
de-viations from the benchmark.2This is because a mutual fund manager can attempt to outperform
its benchmark only by deviating from it.
If active fund managers are able to make advantageous portfolio bets based on their infor-mational advantages, what is the nature of such information? In stock markets, the cornerstone of investing is fundamental analysis, a technique that attempts to determine a securitys intrinsic value by focusing on underlying factors that affect a company’s actual business and its future prospects. When information and trading costs are not trivial in reality, stock prices may diverge from their intrinsic values (e.g., Shiller (1984), Summers (1986), DeBondt and Thayler (1987), Lakonishok, Shleifer, and Vishny (1994), and Shleifer and Vishny (1997)). If investors have su-perior information on a firm’s fundamental prospects or more comprehensive ways of processing such information, they will trade on such information and thus help mitigate the mispricing rel-ative to stock intrinsic values. Do active mutual funds rely on fundamental analysis? If so, can they profit from it? Furthermore, what are the implications of funds’ exploitation of fundamental information on asset prices? The third part of the thesis will investigate these issues in more detail.
1.2
Outline of the Thesis
The three essays presented in this book constitute an empirical investigation of the information content of mutual fund portfolio disclosure. Chapter 2 studies the value of active funds’ portfolio disclosure from an outside investor’s perspective. Chapter 3 and Chapter 4 attempt to relate active fund investments to asset prices and further explore the role of active mutual funds in bringing about price efficiency in financial markets.
Chapter 2 constructs hypothetical copycat funds to investigate the performance of free-riding strategies that duplicate the disclosed asset holdings of actively managed mutual funds. We measure the relative success of free-riding by comparing the performance between a copycat fund with its target active fund. Analyzing disclosed holdings of 3,046 active U.S. equity funds over the 1985-2008 period, we find that copycat funds on average can generate performance that is comparable to their actively managed counterparts, after trading costs and expenses. More interestingly, their relative success increased significantly after 2004 when the SEC imposed 2Cremers and Petajisto (2009) document a rapid increase in closet indexers whose portfolios largely resemble those of their benchmarks while still claiming to be active.
quarterly disclosure regulations on all mutual funds. The stabilizing pattern is especially salient for the subsample of mutual funds that have experienced and survived past the policy change. The improvement in net relative returns for those copycat funds amounts to 0.05% per month. The improved tracking performance after the policy change in 2004 is associated with a steady increase in the representativeness of fund portfolio disclosure, i.e. the extent to which a fund’s disclosed holdings are representative of its true investment style in the recent past. We measure the representativeness by the tracking error of a mutual fund relative to a characteristic-based benchmark. These findings confirm our expectations that requiring more frequent portfolio dis-closure expands the opportunities for potential free-riders to successfully track or even beat their actively managed counterparts. In this chapter, we also document a substantial cross-sectional dispersion in the relative success of copycat funds. A copycat strategy targeted at past winning funds provides investors with a cheap momentum strategy. Further, the representativeness of holdings also appears to be a powerful predictor of the relative success of copycat funds. Copy-cat strategies exploiting ‘more representative’ holdings tend to outperform not only their actively managed counterparts but also the vast majority of active funds. The superior performance of such selective copycat strategies helps to identify those active target funds that provide the most attractive free-riding opportunities. Distinct from prior studies, our work evaluates the effective-ness of the disclosure policy change in 2004 and the impact of mandating more frequent disclo-sure on the tracking performance. This chapter provides insights into how investors could use disclosed fund holdings and to what extent free-riders gain at the expense of fund shareholders.
Chapter 3 establishes a robust relation between the active funds’ deviations from bench-marks and future stock returns. We study the information content of the active portion of fund investments by creating a stock-level measure that seeks to aggregate various pieces of informa-tion scattered among active funds, as revealed through their over- and underweighting decisions. Specifically, we compare the portfolio holdings of an active fund with its benchmark index and compute the excess weight for each stock on top of the benchmark portfolio. Then we use the simple average of these excess weights on one stock across all active funds to characterize the consensus active bet of fund managers on that stock, which we label funds’ Deviations From
Benchmarks,DF B. We find thatDF B strongly and positively predicts future stock returns.
The return premium on stocks heavily overweighted by mutual funds, relative to their under-weighted counterparts, reaches more than 7% per year even after adjustments for their loadings on the market, size, value, momentum, and liquidity factors. These results are also robust to the various specifications of Fama and MacBeth’s (1973) cross-sectional regressions with common stock return predictors, to the Daniel, Grinblatt, Titman, and Wermers (1997)
characteristic-adjustment procedure, for different weighting schemes, to the exclusion of IPO allocations, and across various subperiods. A significant portion of this premium occurs around corporate earn-ings announcements, which suggests that part of the active funds’ superior information relates to firms’ fundamental prospects. However, there is evidence that mutual funds tend to herd (Werm-ers, 1999; Sias, 2004). To differentiate an alternative interpretation based on price pressure from
our story of informed fund managers, we examine the dynamics of changes inDF B, the return
persistence of high-DF Bstocks, and the possible influence of future demand shocks. The results
uniformly support our information-based story. In addition, we find that the return forecasting
power ofDF Bis stronger among mid-cap firms that have higher idiosyncratic volatilities and
those that attract fewer mutual fund investors. Our results are more pronounced for past-winning funds and growth-oriented funds. Finally, we find that in aggregate, mutual funds invest less than
10% of their assets in high-DF Bstocks but approximately 34% in lowDF Bstocks. Therefore,
a large four-factor alpha of 6–7% per year on highDF Bstocks translates into a small mutual
fund alpha of less than 1% per year. These results are consistent with the prediction of Berk and Green (2004) on the equilibrium behavior of mutual fund managers. Different from previous studies, our measure of deviations from benchmarks is less subject to the influence of fund flows. Moreover, we connect mutual fund investing to asset prices without assuming any a priori links between firms and funds.
Chapter 4 explores the relation between active mutual funds’ trading behavior and stock price divergence from intrinsic value. Over the 1981 to 2008 period, we find that mutual funds in
ag-gregate tend to buy (sell) underpriced (overpriced) stocks as measured by aV /P ratio, whereV
denotes the intrinsic value estimated by a residual income valuation model. We attribute the mu-tual funds’ exploitation of a stock’s intrinsic value to their superior expertise in forecasting and processing fundamental information (Cheng, Liu and Qian, 2006). To characterize the portfolio
choices of mutual funds based onV /P and assess how successfully they exploit such
informa-tion, we construct a fund-levelV /P-timing measure,V P T, in the spirit of Grinblatt, Titman, and
Wermers (1995). V P T is the weighted averageV /P decile rank of all stocks held by a mutual
fund. A high value ofV P Tindicates that the fund manager actively trades on fundamentals and
tilts her portfolio toward underpriced stocks (with highV /Pratios). In univariate portfolio sorts,
D10 funds with the highestV P T have an average return of 1.19% per month over a six-month
horizon and significantly outperform the lowest-V P T funds in D1 by 0.55% per month. The
results are robust to various forms of factor risk adjustments. Hence, mutual funds that actively exploit the fundamental mispricing are able to benefit from such information and generate both statistically and economically significant profits. This confirms the findings that mutual funds
benefit from fundamental-relevant information in Campbell, Ramadorai, and Schwartz (2009)
and Baker, Litov, Wachter, and Wurgler (2010). Finally, we find that theV /P effect is more
pronounced among stocks with less intense past mutual funds’ exploitation. We find that
high-V /Pstocks with the lowest mutual funds’ ownership upon the release of accounting information
continue to generate a significant 4-factor alpha of 0.42% per month in the subsequent one year.
Furthermore, we also show that high-V /P stocks that have been heavily sold by mutual funds
in the recent past can generate even higher future performance. Our evidence supports the view
that the tendency of mutual funds to trade in the direction ofV /P mitigates mispricing and
fa-cilitates impounding fundamental information into stock prices. This study is among the first to empirically test the trading behavior of delegated informed traders using a stock mispricing mea-sure based on a comprehensive valuation model. Our findings that mutual funds tend to exploit mispricing opportunities are consistent with the theoretical prediction of Grossman and Miller (1988), De Long, Shleifer, Summers, Waldman (1990) and Campbell and Kyle (1993).
Chapter 2
Better than the Original? The Relative
Success of Copycat Funds
∗
2.1
Introduction
Mutual funds are required to periodically disclose their portfolio holdings. In 2004, the SEC adopted enhanced regulations that increased the frequency of portfolio disclosure from semi-annually to quarterly. The amendment was designed to provide investors more frequent access to portfolio information to monitor whether a fund is complying with its stated investment objective, and, if so, how. As discussed by Wermers (2001), Frank et al. (2004) and Parida and Teo (2010), more frequent disclosure potentially imposes new costs on mutual funds. For example, it can become easier for other investors to exploit information on fund flows to front-run the fund’s trades (Coval and Stafford, 2007). Moreover, disclosure can allow outside investors to share the benefits of fund research without incurring the actual cost of owning the fund shares. Investors can simply “free-ride” on mutual fund investment strategies through the direct mimicking of disclosed portfolio holdings, even though this information is typically two months old at the
time of publication.1 The reported holdings can thus unveil valuable investment opportunities.
For example, Daniel et al. (1997) examine fund holdings and show that certain groups of mutual
∗This chapter is based on the article by Verbeek and Wang (2011). I am grateful to John Adams, Stefano
Bubellini, Susan Christofferson, Richard Fu, Hao Jiang, Tarun Ramadorai, Jan Wrampelmeyer, Russ Wermers and the participants of the Midwest Finance Association Meeting (Las Vegas, 2010), Eastern Finance Association Meeting (Miami, 2010), EFMA Conference (Aarhus, 2010), FMA European Conference (Hamburg, 2010), the 4th Professional Asset Management Conference (Rotterdam, 2010) and the FMA Annual Meeting (New York, 2010) for helpful comments and suggestions. This paper received the Outstanding Research Award in Investments at the Eastern Finance Association Meetings in Miami, Florida, April 2010. I also wish to thank Kenneth French and Russ Wermers for making their data available through their websites.
1Chen, Jegadeesh and Wermers (2000) and Wermers (2001) find that profits from fund research tend to accrue over periods ranging from 12 to 18 months after the date a newly acquired stock is first added to a fund’s portfolio.
funds exhibit selectivity ability. If such opportunities are not transitory, investors who trade on such information, even with a time lag, would be able to make a substantial profit. In this paper we address the question to what extent portfolio disclosures reveal valuable information for outsiders and whether the enhanced SEC regulations have increased the potential for such free-riding strategies. These questions are important to increase our understanding of the simplest way in which disclosed holdings information can be exploited and to establish the potential costs of disclosure to mutual funds.
To address these issues, we construct hypothetical copycat funds by strictly duplicating the active funds’ disclosed portfolios and rebalancing whenever new holdings are reported. We measure the relative success of free-riding by comparing the performance between a copycat fund and the target active fund. Analyzing disclosed holdings of 3,046 active U.S. equity funds over the 1985-2008 period, we find that copycat funds on average can generate returns that are close to their actively managed counterparts, after trading costs and expenses. More interestingly, the average relative performance of copycat funds stabilizes and increases significantly after the SEC requires more frequent portfolio disclosure in 2004. The pattern is especially salient for a subsample of mutual funds that have experienced and survived past the policy change. The improvement in net relative returns for those copycat funds amounts to 0.05% per month, which is statistically significant. The improved tracking performance after the policy change in 2004 is associated with a steady increase in the representativeness of fund portfolio disclosure, i.e. the extent to which a fund’s disclosed holdings are representative of its true investment style in the recent past. We measure the representativeness by the tracking error of a mutual fund relative to a characteristic-based benchmark. These findings confirm our expectations that requiring more frequent portfolio disclosure expands the opportunities for potential free-riders to successfully track or even beat their actively managed counterparts.
A potentially interesting free-riding strategy focuses on the holdings reported by certain types of mutual funds, for example, funds with a proven track record of success. Outside investors might apply various techniques to returns and holdings data to infer the stock-picking talents of active funds. In this paper we document a substantial cross-sectional dispersion in the relative success of copycat funds. A copycat strategy targeted at past winning funds provides investors with a cheap momentum strategy that significantly outperforms the majority of the mutual fund universe after trading costs and expenses. Further, the representativeness of holdings also appears to be a powerful predictor of the relative success of copycat funds. Copycat strategies exploiting ‘more representative’ holdings tend to outperform not only their actively managed counterparts but also the vast majority of active funds. The superior performance of such selective copycat
strategies helps to identify those active target funds that provide the most attractive free-riding opportunities.
An extensive literature has examined mutual fund performance and new money growth based
on holdings data or trades derived from holdings.2 Few studies have focused on the tracking
performance of a free-riding strategy and the association of portfolio disclosure with fund
per-formance and investor reactions.3 Our study evaluates the effectiveness of the disclosure policy
change in 2004 and the impact of mandating more frequent disclosure on the tracking perfor-mance. To enhance the practical relevance of our study we take into account the possible trans-action costs for copycat funds. Further, we investigate the cross-sectional variation in the perfor-mance of copycat funds. Brown and Schwarz (2010) examine the use of hedge funds’ 13(f) fil-ings by market participants and find that mandatory disclosure of hedge fund portfolio positions provides little long-term benefit to investors who seek to free-ride on the information released in these disclosures. Kacperczyk, Sialm and Zheng (2008) investigate the impact of unobserved actions of U.S. equity funds on future fund performance by defining the ‘return gap’ between the reported fund return and the return on a portfolio that invests in the previously disclosed fund holdings. Our work differs from theirs in that we shift the object of study from active funds to potential free-riders who expect to track the active fund’s performance. More importantly, we aim at measuring the extent to which outdated holdings are valuable. Our study provides insights into how investors could use disclosed fund holdings and to what extent free-riders gain at the expense of fund shareholders.
The remainder of the chapter proceeds as follows. Section2.2briefly reviews the dynamics
of U.S. disclosure regulations for mutual funds and describes the data used in this study. Section
2.3presents the main methodology to construct copycat portfolios and defines a measure for
the representativeness of disclosed holdings. In Section2.4, we examine the effect of mandating
more frequent portfolio disclosure in 2004 on the tracking performance of copycat funds. Section
2.5focuses on the determinants of the relative success of copycat funds and analyzes the
cross-sectional variation in the performance of copycat funds. Section2.6concludes.
2The literature includes, among others, Grinblatt and Titman (1989), Grinblatt, Titman and Wermers (1995), Daniel, Grinblatt, Titman and Wermers (1997), Wermers (1997, 1999, 2000, 2001, 2003), Chen, Jegadeesh, Werm-ers (2000), Kacperczyk, Sialm and Zheng (2005, 2008), Cohen, Coval and Pastor (2005), Kosowski, Timmermann, Wermers and White (2006), Baks, Busse and Green (2006), Ge and Zheng (2006), Cremers and Petajisto (2009).
3An exception is Frank et al. (2004), which analyzes the average tracking performance of copycat funds based on the semi-annually reported holdings of 20 high-expense mutual funds in the 1990s.
2.2
Institutional Background and Data
The Investment Company Act historically required all registered U.S. investment management companies to transmit reports to their shareholders and to file these shareholder reports with the SEC within 10 days after transmission to shareholders. These fund reports have long served as the primary vehicle to communicate information regarding both fund performance and portfolio composition to investors. Since 1985 the SEC required under Rule 30b1-1 that all registered investment companies file their portfolio holdings within 60 days after the end of each fiscal six-month period. Aiming at improving the effectiveness of such information disclosure, many
petitioners had suggested ways to improve the disclosure regime by the end of 2003.4 They
believed that investors could benefit from the enhanced transparency by both increasing the fre-quency with which mutual funds are required to disclose their portfolio holdings and streamlining the portfolio schedules delivered to shareholders. In their petitions they also argued that more frequent portfolio disclosure by mutual funds would allow investors to better monitor the extent of their portfolio diversification and consequently enable them to make more informed asset al-location decisions. In addition, the transparency supporters believed that investors would have better information to check how a fund was complying with its stated investment objective, so as to identify style-drifting funds. In their opinions, more frequent disclosure would also shed light on the problems of portfolio manipulation such as ‘window dressing’ and ‘portfolio
pump-ing’5. In response to the demand for more effective portfolio disclosure regulation, the SEC
issued a release proposing rule amendments under SA of 1933, SEA of 1934 and ICA of 1940 on December 18, 2002. By February 14, 2003, the SEC had received 65 comment letters from industry members, investor advocacy groups, consultants and academics. Some of these letters supported the SEC’s proposal to improve the transparency of the periodic portfolio disclosures provided to investors. By contrast, other petitioners, including members of the investment man-agement groups, raised concerns that frequent portfolio disclosure with a short reporting delay
might encourage predatory trading practices in the market.6
4The SEC received six rule-making petitions by May 10, 2004. See “Shareholder Reports and Quarterly Portfolio Disclosure of Registered Management Investment Companies; Final Rule”, 17 CFR Parts 210, 239, 249, 270, and 274, available fromhttp://www.sec.gov/rules/final/33-8393.htm.
5“Window Dressing” is defined as buying or selling portfolio securities shortly before the date as of which a fund’s holdings are publicly disclosed, to convey an impression that the manager has been investing in companies that have had exceptional performance during the reporting period. “Portfolio Pumping” is defined as buying shares of stock the fund already owns on the last day of the reporting period, to drive up the price of the stocks and inflate the fund’s performance results. See Lakonishok, Shleifer, Thaler and Vishny (1991), Sias and Starks (1997), Musto (1999), O’Neal (2001) and Meier and Schaumburg (2006), Duong and Meschke (2009).
6The commenters from ICI and Fidelity argued that free-riding could be achieved and facilitated by more fre-quent disclosures of fund holdings. See letter from Craig S. Tyle, General Counsel, ICI, to the SEC (February 14,
More frequent portfolio disclosure would facilitate the ability of professional traders and other opportunists to expropriate the results of mutual funds’ proprietary research and invest-ment acumen. Such exploitation of reported holdings could lead to additional costs that will be passed on to fund shareholders in the form of sacrificed fund performance and the consequent erosion of market share. Wermers (2001) examines the potentially harmful consequences of re-quiring more frequent portfolio disclosure and concludes that under a more frequent disclosure mandate abusive activities such as free-riding would increase and adversely affect fund perfor-mance by preventing a fund from fully realizing the potential benefits of its research efforts. In an attempt to strike a balance between the benefits and costs associated with disclosing fund hold-ings, the Commission decided to adopt a quarterly disclosure requirement with a 60-day filing delay in the final amendments that took effect in May of 2004. Accordingly, our analysis is also motivated by the desire to understand the impact of increased mandatory reporting frequency on fund performance. Examining the information content of the disclosure per se allows us to gain a deeper insight into the value of outdated portfolio data for free-riding activities and the possible responses by mutual funds to such predatory trading practices.
Our empirical analysis employs data on stock prices, mutual funds and their holdings ex-tracted from three major sources: the CRSP Survivor-Bias-Free U.S. Mutual Fund Database (MFDB), the Thomson Financial CDA/Spectrum S12 equity holdings data, and the CRSP stock files. Our sample spans the 24-year period from January 1985 to December 2008. The CRSP mutual fund database provides monthly fund net returns, TNAs, and annual data on portfolio turnover ratios, 12b1 fees, expense ratios and other fund characteristics (investment styles, asset allocations, etc.) for all open-end mutual funds. The second mutual fund database contains a history of quarterly/semi-annual portfolio holdings for all U.S. equity mutual funds, and lists the number of shares of each stock held by a fund and the self-declared investment objective at the beginning of each calendar quarter. The SEC filings, together with the voluntary quarterly fund reports to shareholders and informal reports to CDA constitute the main source of this database. The third database contains stock prices and returns from the CRSP NYSE/AMEX/Nasdaq stock files. We merge the CRSP MFDB with the TFN CDA/Spectrum holdings data using the MFLINKS database provided by WRDS to obtain a complete record of stock holdings of a given
mutual fund along with the fund’s net returns and other characteristics.7To concentrate our
anal-ysis on open-end U.S. domestic active equity mutual funds, for which the holdings data are most complete and reliable, we eliminate bond, money market, international and sector funds, as well 2003) ‘Re: Shareholder Reports and Quarterly Portfolio Disclosure of Registered Management Investment Compa-nies’.
as funds not primarily invested in equity. We also exclude index funds that target to (more or less passively) replicate an equity index. For funds with multiple share classes, we eliminate the duplicate funds sharing one underlying portfolio. Appendix A provides details on the sample selection (based on investment objectives and portfolio equity concentration) and the merging process of the aforementioned three databases.
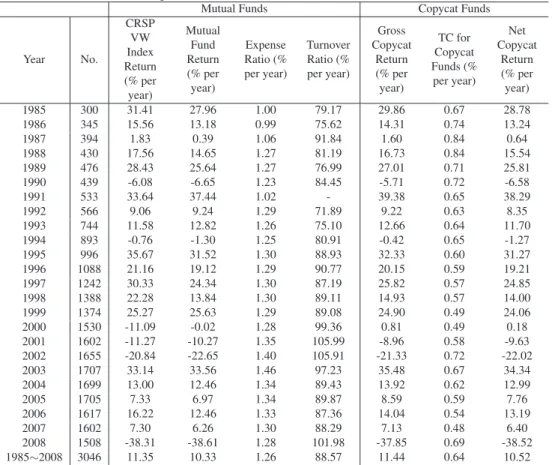
Panel A of Table2.1reports the summary statistics for our mutual fund database. Our sample
includes 3,046 distinct U.S. equity mutual funds over the period from 1985 to 2008. The mutual funds in our sample on average invest 95.06% of their assets in common stocks and less than 5% in other asset classes. Therefore, our sample well represents the universe of U.S. domestic
funds with an investment focus on equity. Besides the investment composition, Table2.1also
summarizes other fund attributes that are used in the analyses below. An average mutual fund in our database has a TNA of $876 million, expense ratio of 1.30% per year and turnover of 91.6% per year. The relatively high expense ratios of active funds facilitate the potential free-riders’ relative success by taking the most of their cost advantage. In our sample, the average fund age is 12.63 years which is higher than the median fund age of 7.75 years due to the existence of several old funds, such as Massachusetts Investors Trust introduced in 1924.
In Panel B of Table2.1we report the summary statistics for all common stocks held by mutual
funds in our sample. Size refers to the market capitalization of the stock. On average, 0.74% of the stock market capitalization is traded every month. The book-to-market ratio is determined for each stock at the end of each calendar year using the book value of the fiscal year end and the market value at the end of the calendar year. Momentum is defined as the cumulative stock return over the past one year (month t-11 to t-1). Size and momentum scores, ranging from 1 to 5, are calculated by assigning all stocks into quintile portfolios at the end of each month using NYSE breakpoints, with a score of 1 for the lowest quintile. BM ratio scores are calculated in a similar way except that the quintile portfolios are rebalanced at the end of each year. On average, mutual fund portfolios have a slight tilt toward small, growth and momentum stocks
2.3
Constructing Copycat Funds
This section describes the construction of copycat funds, taking into account trading costs and expenses. It also introduces a measure of representativeness for disclosed portfolio holdings, which appears an important characteristic to describe the relative success of copycat strategies.
Table 2.1:Summary Statistics for Merged Mutual Fund Database
Panel A of this table presents the summary statistics for the sample of U.S. equity mutual funds over the period 1985 to 2008. Merging the Thomson Financial/CDA database, CRSP MFDB and CRSP stock files results in a sample of 3,046 distinct funds. 12(b)1 fees are the actual 12(b)1 fees in the CRSP Mutual Fund Database and the maximum 12(b)1 fees in case the actual 12(b)1 fees are missing. Proportion of investments in each asset class is from the CRSP mutual fund summary database. We average the expense ratios, turnover ratios, 12(b)1 fees and other proportion of investments characteristics at the end of each year. TNAs and fund ages are averaged using monthly data. Panel B reports the summary statistics for the U.S. common stocks held by our sample of U.S. equity mutual funds. Stock size is the product of the stock price and the number of outstanding shares. Book-to-Market ratio is determined for each stock at the end of last calendar year using the book value of last fiscal year end and the market value of the stock at the end of last calendar year. Momentum is defined as the cumulative stock return over the past one year (t−11tot−1). Size and momentum scores are calculated by assigning all stocks into quintile portfolios at the end of the each month using NYSE breakpoints with score of 1 for the quintile of the lowest characteristic values and vice versa. BM ratio scores are calculated in a similar way except rebalancing the quintile portfolios at the end of each year.
Panel A: Mutual Funds Mean 25%
percentile Median
75% percentile
Standard Deviation Total Net Assets (millions) 875.70 25.10 107.50 448.95 3827.41 Expense Ratio (% per year) 1.30 0.95 1.20 1.50 1.12 Fund Turnover Ratio (% per year) 91.58 35.70 67.00 114.00 120.22
12(b)1 fees (% per year) 0.29 0.00 0.25 0.30 0.31 Common Stock Investments (%) 95.06 93.25 97.23 99.75 6.99 Fund Age (years) 12.63 3.92 7.75 15.09 13.91 Panel B: Stocks Held by Mutual Funds Mean 25%
Percentile Median
75% Percentile
Standard Deviation Volume/Size (% per month) 0.74 0.13 0.32 0.79 2.06
Size (Millions) 2070.83 88.59 271.78 966.45 10690.09 Size Score (1∼5) 2.23 1.00 2.00 3.00 1.35 Book-to-Market Ratio 0.69 0.31 0.55 0.90 0.61 Book-to-Market Ratio Score (1∼5) 2.71 1.00 3.00 4.00 1.46 Momentum (%) 21.97 -10.42 11.44 37.69 80.62 Momentum Score (1∼5) 3.11 2.00 3.00 4.00 1.46
2.3.1
Measuring Copycat Portfolio Gross Returns
We compute the gross return for a copycat fund as the total return of a hypothetical buy-and-hold portfolio that invests in the most recently disclosed fund asset positions and is rebalanced at the next disclosure date. The gross monthly holding period return for a copycat fund targeting
mutual fundjis defined as
GRjt= N i=1 wji,t−1Ri,t, (2.1)
whereRi,tdenotes the return on asseti, and the value weights are given by
wji,t−1= Ni,tj−τPi,t−1 N i=1 Ni,tj−τPi,t−1 , (2.2)
whereNi,tj−τ denotes the number of shares of stockiheld by mutual fundjat the most recent
disclosure date at timet−τ, andPi,t−1 is the stock price at the end of the previous month.
Different from Kacperczyk, Sialm and Zheng (2008), we do not use the snapshot dates (RDATE in the TFN/CDA database) to rebalance our portfolio because we are constructing a practically implementable copycat strategy. Typically, the disclosure dates are less than 60 days after the end of each fiscal quarter. Considering the amount of work and degree of difficulty for individual investors to access the SEC’s EDGAR filings, we assume that a disclosure date is 60 days after each snapshot date to ensure that all the holdings data are available to individual investors at the time of portfolio construction. Our copycat portfolio for each active fund is rebalanced on each disclosure date. Accordingly, copycat funds are at least two months out of date in tracking the active mutual fund’s portfolio. We also adjust the number of shares and the stock prices across months in each holding period for stock splits and other share adjustment using the accumulative adjustment factor given by CRSP.
The TFN/CDA holdings database only contains common stock positions and excludes other non-equity holdings. To adjust the copycat fund returns for the various asset classes, we proxy for these assets’ returns using published indexes. We assume all bonds and preferred stocks held by mutual funds earn the Barclays Lehman Brothers Aggregate Bond Index returns and all cash and other asset classes earn the Treasury-bill monthly return. The value weights for all other asset classes are collected from the CRSP mutual fund summary database.
2.3.2
Estimating Trading Costs and Expenses of Copycat Funds
The copycat fund returns defined above ignore transaction costs and other expenses. We estimate the trading costs for copycat funds based on the studies by Keim and Madhavan (1997), Wermers (2000) and Kacperczyk, Sialm and Zheng (2008). Keim and Madhavan (1997) provide fitted regressions to estimate the total institutional (explicit and implicit) execution costs for a sample of mutual funds during the period 1991-1993. Wermers (2000) re-computes the coefficients in this regression, excluding trader dummies, since trader types for fund transactions are hard to collect. We start by calculating the numbers of trading orders (both buy and sell) for each stock by comparing the fund’s holdings at two consecutive disclosure dates. For simplicity, we assume
that the copycat fund is managing the same amount of assets as its primitive fund.8 We then
follow Kacperczyk, Sialm and Zheng (2008) and compute the execution costs for each trade using
Ci,tB = 1.098 + 0.336D
N asdaq
i,t + 0.092T rsizei,t−0.084Log(mcapi,t) + 13.807( 1
Pi,t)
, (2.3)
Ci,tS = 0.979 + 0.058D
N asdaq
i,t + 0.214T rsizei,t−0.059Log(mcapi,t) + 6.537( 1
Pi,t)
, (2.4)
whereCB
i,tis the total costs (in percentage of the trade value) of buying stockiduring period
t, whileCS
i,tis the total costs (in percentage of the trade value) of selling stockiduring period
t;T rsizeis the trade size (dollar value of the stock trade divided by market capitalization of
the stock);Log(mcapi,t)is the natural logarithm of the market capitalization of the stock (in
thousands); Pi,t is the stock price; D
N asdaq
i,t is a dummy variable that equals one if the trade
occurs on Nasdaq (as opposed to NYSE or AMEX). Having computed the costs of all trades for a fund at a certain disclosure date, we estimate the total trading costs for that fund by summing the costs of all trades and dividing by the total value of the fund’s stock portfolio at the beginning of the period. In addition, we winsorize the estimated trading costs in percentage of the trade value or asset value at the 1% tails to remove the contaminating effect of outliers. Monthly transaction costs are calculated by dividing the aggregate transaction costs at a given disclosure date by the number of months since the previous disclosure date.
By assumption, copycat funds do not spend anything on research. Accordingly, they can operate with relatively low levels of expenses. Following Frank et al. (2004), we assume that 8In unreported results, we find that the trading costs of maintaining a copycat fund that is 25%, 50%, 75% and 100% as large as the target active fund would only differ in the second decimal place in percentages. This finding justifies our construction of copycat funds buying the same amount of assets as the active funds in the present study. Smaller copycat funds could perform slightly better than the numbers reported in this paper.
they incur expenses equal to those of the Vanguard Total Stock Market Index fund in 2002, 20 basis points. This index fund invests in both large and small capitalization stocks, so its expense ratio should be able to represent a broad cross-section of potential copycat funds. Nevertheless, because this fund is an extreme example of efficiency, some readers may prefer to impose higher expense ratios, and this will lead to straightforward adjustments in our calculations.
2.3.3
Representativeness of Fund Portfolio Disclosure
A potentially important element for the relative success of copycat funds is the validity of the information contained in each portfolio disclosure. A mutual fund manager might have different incentives to either reduce or increase the information revealed by portfolio disclosures hoping to revise the investors’ impression on the fund beyond what has been revealed in past returns, e.g. by ‘window dressing’ or ‘portfolio pumping’. Besides, mutual funds that expect large money flows can also attempt to conceal their true positions because predatory traders may be able to front-run on their trades (Coval and Stafford, 2007; Chen, Hanson, Hong and Stein, 2008). Other funds may just engage in active interim trading so that their disclosed holdings hardly represent their average investment styles in the recent past. In short, reported holdings may not be representative of the true underlying investment style of a mutual fund. It is therefore useful for any investor to evaluate the accuracy and representativeness of the disclosed holdings. In our study, we measure the representativeness of the reported holdings by computing the tracking error between the reported fund returns and the returns on a characteristics-based benchmark. The higher the tracking error, the lower is the holdings’ representativeness.
To define a benchmark for each mutual fund, we follow Daniel, Grinblatt, Titman and Wer-mers (1997, DGTW), Chan, Karceski and Lakonishok (1998) and Chan, Chen and Lakonishok (2002). A fund’s style is determined by the characteristics of the fund’s portfolio holdings along three dimensions: market capitalization, value-growth orientation and momentum. At the end of June, all stocks meeting the selection requirements for both the CRSP stock file and Com-pustat database are triple-sorted into 125 fractile portfolios based on size, book-to-market (BM) ratio and momentum, where the BM-ratios are industry-adjusted using 48 Fama-French industry groupings. The value-weighted portfolio returns are then computed for each portfolio in the post-ranking months. This provides a set of 125 characteristics-based benchmark portfolio returns. At each disclosure date, we match a stock in a disclosed portfolio to one of the 125 characteristic portfolios to which it belonged on the snapshot date. Next, we calculate the fund style benchmark returns for the disclosed portfolio over the 5 months prior to the disclosure date using the dis-closed portfolio weights calculated on the snapshot date and the characteristics-based benchmark
returns.
Inspired by Brown, Harlow and Zhang (2009), for each disclosure datetthe
representative-ness of the portfolio holdings disclosed by mutual fundjare measured by
T rackingErrortj=σRj,t−s−
iwi,t−2R
bi,t−2
j,t−s, s= 0,1, ...,4, (2.5)
whereRj,t−sdenotes the realized monthly return of mutual fundjfor each of the five months
prior to the each disclosure datet,wi,t−2is the value weight for stocki(disclosed at timet) two
months before the disclosure date, i.e. the date on which the holdings are valid, andRbj,ti,t−−2s is
the montht−sreturn of the style benchmark portfolio that is matched to stockiat the end of
montht−2. Equation (2.5) defines the tracking error of the mutual fund relative to a
DGTW-based benchmark five months before the disclosure date (three months before and two months after the snapshot date). The portfolio holdings that are valid at the end of each quarter not only serve as an indication for a fund’s investments in that quarter but also convey information of the
fund’s intended investment strategy in the coming quarter.9 If the portfolio disclosure is very
informative of the investment style the fund has maintained, the style benchmark returns should be highly correlated with the realized fund returns and thus generate a low tracking error. High tracking errors could be driven by window dressing, portfolio pumping, intra-quarter trading as well as overall market volatility. Therefore, we argue that our measure of the disclosure repre-sentativeness is a good proxy for the accuracy of holdings in revealing a fund’s true investment
style.10
2.4
Disclosure Frequency and Copycat Fund Performance
In this section, we evaluate whether the reporting frequency of active mutual funds influences the relative success of copycat funds. We start our analysis by looking at the average copycat fund performance relative to active mutual funds. Then we examine the effect of disclosure frequency 9Our reporting representativeness measure differs from style consistency in Brown, Harlow and Zhang (2009) in that we impose an additional linear structure in the regression of fund returns against general style benchmark returns. We attempt to capture the extent to which an active fund deviates from its disclosed holdings in a short 5-month period. Besides, holdings-based style evaluation stands out for its higher precision and deeper classification (Chan, Chen, and Lakonishok, 2002; ter Horst, Nijman, and de Roon, 2004). ter Horst, Nijman, and de Roon (2004) evaluate various aspects of returns-based style analysis and find that factor loadings of mutual funds are in general different from the actual portfolio weights.
10We find a substantial dispersion in our measure of the representativeness of disclosed fund holdings. In unre-ported results, we calculate the distribution statistics of the representativeness measures at each disclosure date and then average them over time. The average inter-quartile range is 1.03 standard deviations, which is close to 1.35 for a normal distribution. More importantly, the average kurtosis amounts to 10.25, which indicates excessive numbers of observations in both tails of the distribution.
on the tracking performance of copycat funds by comparing the performance of copycat strate-gies with different rebalancing frequencies. Finally, we investigate the impact of the disclosure policy change in 2004 on copycat performance and on the information content of the reported holdings.
2.4.1
Performance Comparisons
We compare the performance of copycat funds with their primitive active funds in terms of gross
returns as well as net returns. The monthly gross return (GRt) of a mutual fund is computed
by adding back expenses to the reported net return, where expenses include management fees,
12b-1 fees and other administrative expenses.11We follow Cohen, Coval and Pastor (2005) and
divide the annual expense ratio by 12, and add the resulting number to each monthly net return
(N Rt) in a given year.
Table2.2reports various performance measures and fund characteristics averaged across all
funds year by year. To minimize any possible survival requirements, we include in our calcula-tions each mutual fund that exists during a given month, regardless of whether that fund survives the entire year. For each month we compute the equally weighted average return across all funds existing during that month. These equally weighted monthly fund returns are then compounded into annual returns for both mutual funds and copycat strategies. The U.S. domestic active equity funds on average earn a net return of 10.33% per year, thus underperforming the CRSP value-weighted market index by 1.02%. This is consistent with previous studies showing that actively managed mutual funds on average underperform the market portfolio in net returns (Brown and Goetzmann, 1995; Carhart, 1997; Wermers, 2000). However, with an average annual expense ratio of 1.26%, mutual funds in aggregate outperform the market by 0.24%, suggesting fund managers are able to recoup at least part of their expenses. Average expense ratios increase over time, until 2003, and then start to decline. Turnover ratios show a similar pattern with a peak value of 106% appearing in 2001 and 2002.
Table2.2also presents the performance measures and the estimated trading costs for copycat
funds. Our copycat strategies generate an average gross return of 11.44% per year, 0.09% higher than the market. However, in practice copycat fund managers cannot exactly replicate the gross performance computed from closing prices due to the reality of liquidity deficiency and price impacts (Grinblatt and Titman, 1989; Wermers, 2006). The average trading costs for copycat 11The net mutual fund return is before load fees. Because load fees are borne by investors, ignoring them would only render the relative success of copycat funds more difficult.
Table 2.2:Annual Fund Performance & Characteristics
For each month, we calculate the equally weighted average performance measures and fund characteristics across all funds in our sample. To minimize the potential survivorship bias, if any, all funds will be included in the calculation in each month regardless of whether the fund could survive past the next period. Then the equally weighted average monthly returns are compounded into annual returns. Gross copycat fund returns are the returns on the hypothetical portfolios that invest in the disclosed holdings and are rebalanced as soon as the updated holdings are available to the public. Trading costs for copycat funds are estimated using the fitted regression from Kacperczyk, Sialm and Zheng (2008). Trade size and portfolio value of copycat funds are assumed to be identical to their active targets. The estimated trading costs are averaged across all copycat funds for a given year. We assume that for all years in our sample, each copycat fund incurs expenses equal to those of the Vanguard Total Stock Market Index fund in 2002, 20 basis points. We also calculate the average expense ratios and turnover ratios for active funds at the end of each year. This table also presents the number of distinct mutual funds in our merged database each year. In CRSP MFDB, turnover ratios are missing in 1991.
Mutual Funds Copycat Funds
Year No. CRSP VW Index Return (% per year) Mutual Fund Return (% per year) Expense Ratio (% per year) Turnover Ratio (% per year) Gross Copycat Return (% per year) TC for Copycat Funds (% per year) Net Copycat Return (% per year) 1985 300 31.41 27.96 1.00 79.17 29.86 0.67 28.78 1986 345 15.56 13.18 0.99 75.62 14.31 0.74 13.24 1987 394 1.83 0.39 1.06 91.84 1.60 0.84 0.64 1988 430 17.56 14.65 1.27 81.19 16.73 0.84 15.54 1989 476 28.43 25.64 1.27 76.99 27.01 0.71 25.81 1990 439 -6.08 -6.65 1.23 84.45 -5.71 0.72 -6.58 1991 533 33.64 37.44 1.02 - 39.38 0.65 38.29 1992 566 9.06 9.24 1.29 71.89 9.22 0.63 8.35 1993 744 11.58 12.82 1.26 75.10 12.66 0.64 11.70 1994 893 -0.76 -1.30 1.25 80.91 -0.42 0.65 -1.27 1995 996 35.67 31.52 1.30 88.93 32.33 0.60 31.27 1996 1088 21.16 19.12 1.29 90.77 20.15 0.59 19.21 1997 1242 30.33 24.34 1.30 87.19 25.82 0.57 24.85 1998 1388 22.28 13.84 1.30 89.11 14.93 0.57 14.00 1999 1374 25.27 25.63 1.29 89.08 24.90 0.49 24.06 2000 1530 -11.09 -0.02 1.28 99.36 0.81 0.49 0.18 2001 1602 -11.27 -10.27 1.35 105.99 -8.96 0.58 -9.63 2002 1655 -20.84 -22.65 1.40 105.91 -21.33 0.72 -22.02 2003 1707 33.14 33.56 1.46 97.23 35.48 0.67 34.34 2004 1699 13.00 12.46 1.34 89.43 13.92 0.62 12.99 2005 1705 7.33 6.97 1.34 89.87 8.59 0.59 7.76 2006 1617 16.22 12.46 1.33 87.36 14.04 0.54 13.19 2007 1602 7.30 6.26 1.30 88.29 7.13 0.48 6.40 2008 1508 -38.31 -38.61 1.28 101.98 -37.85 0.69 -38.52 1985∼2008 3046 11.35 10.33 1.26 88.57 11.44 0.64 10.52
funds amount to 0.64% per year.12Looking at the average net returns, we find that copycat funds
are able to outperform their actively managed counterparts by 0.19% per year, which is mainly due to the lower expense ratios of copycat funds. The disadvantage of copycat funds in timely access to portfolio information is thus partly offset by their lower expenses.
Table 2.3:Performance Comparison
This table compares the average performance of active mutual funds and copycat funds in terms of various measures. We first calculate the equally weighted average fund returns for a given month and then compute the time-series av-erages. The numbers in the table are the outperformance (underperformance) of copycat funds relative to their actively managed counterparts in percentages per month. Gross copycat fund returns are the returns on the hypo-thetical portfolios that invest in disclosed holdings and are rebalanced as soon as the updated holdings are available to the public. Trading costs and expenses for copycat funds are defined as previously. t-statistics are reported in parentheses. * significant at 10% level, ** at 5% level, *** at 1% level.
Average Performance Comparison (% per month) Gross Mutual Fund Return Net Mutual Fund Return Gross Copycat Fund Return -0.01
(-1.19) Gross Copycat Fund Return after TC -0.070***
(-5.54)
Gross Copycat Fund Return after Exp 0.073*** (6.15)
Net Copycat Fund Return 0.020*
(1.67)
The aggregate picture is summarized in Table2.3, which compares the gross/net monthly
return measures between copycat funds and active mutual funds. The return difference between the two strategies is used as a proxy for judging the relative success of copycat funds. Before any trading costs and expenses, the copycat funds on average underperform the active funds by 1.0
basis point per month, but this difference is statistically indistinguishable from zero.13 Taking
into account transaction costs for copycat funds the return difference becomes -7.0 basis points per month (significant at the 1% level). Thus, before expenses the average active mutual fund outperforms its copycat fund. However, in terms of net returns, copycat funds outperform mutual funds by 2.0 basis points per month, although this difference is statistically significant only at
the 10% level. Finally, Table2.3also compares the net returns before trading costs for copycat
funds and the reported net returns for mutual funds. Ignoring the possible trading costs results in a statistically significant outperformance by copycat funds. The difference of 7.3 basis points 12The magnitude of our estimated trading costs is close to other studies. For example, Chalmers, Edelen and Kadlec (1999) estimate the average trading costs for mutual funds to be 0.75% per year. Kacperczyk, Sialm and Zheng (2008) obtain an average of 0.70% per year for trading costs. Chalmers, Edelen and Kadlec (2001), Karceski, Livingston and O’Neal (2004), Edelen, Evans and Kadlec (2006), Wermers (2000) all have estimated trading costs for U.S. mutual fund industry over different subperiods. Their estimates range from 0.75% per year to 0.96% per year. Note that copycat funds, by construction, trade less than the active mutual funds.
per month is larger than the finding of Frank et al. (2004), who consider only a small segment of the mutual fund industry.
The results in Tables2.2and2.3confirm that, on average, copycat funds are able to generate
returns comparable to their actively managed counterparts after trading costs and expenses.14
The relatively high expenses of mutual funds eliminate almost all the expected gains from active investments. These findings suggest that periodic portfolio disclosure provides outside investors with free-riding opportunities to generate net performance that is comparable to active funds. Outside investors are thus able to obtain the benefits of fund research and investment strategies without incurring the same level of expenses. This raises doubts over the effectiveness of the Commission’s mandatory portfolio disclosure requirement that has aimed for protecting fund shareholders’ interests.
2.4.2
Disclosure Frequency and Tracking Performance
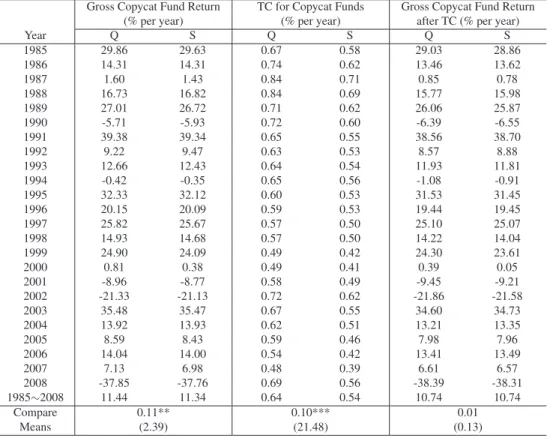
More frequent access to portfolio holdings might increase the potential for free-riding activities. Nevertheless, before 2004 a substantial number of mutual funds already voluntarily disclosed their holdings more frequently than required. Frank et al. (2004) list several reasons for mutual funds to do so. It is documented, however, that these frequent reporters are not a random sample of the cross-section of mutual funds. In particular, Ge and Zheng (2006) find that funds that are more likely to have an information advantage are less likely to disclose more frequently. Parida and Teo (2010) further study the impact of portfolio disclosure frequency on fund performance and find that the SEC’s mandate on more frequency disclosure has adverse effect on the perfor-mance of past winning funds. To obtain a first impression on the impact of disclosure frequency we now construct an alternative copycat strategy where we update the copycat portfolio at most two times per year. We do so by always selecting the next snapshot date (and the corresponding disclosure date) for a given fund at least 6 months from the previous one. We then implement our copycat investment strategy using the less frequently (semi-annually) available holdings data. In
this case the portfolio weights can be as old as eight months. In Table2.4we compare the average
performance of the quarterly rebalanced copycat funds (whose portfolios are updated as soon as new holdings are disclosed) and the semi-annually rebalanced copycat funds (whose portfolios are updated at least six months after the previous update). Before transaction costs, the quarterly rebalanced copycat funds outperform the semi-annually rebalanced ones on average by 0.10% 14In unreported results, we also compare the risk-adjusted gross and net performance between active funds and our copycat funds using the Fama-French three-factor and Carhart four-factor models, respectively. In terms of economic and statistical significance, the results are very similar.