STRATEGIC ANALYSIS OF THE COCA-COLA COMPANY
Dinesh Puravankara
B Sc (Dairy Technology) Gujarat Agricultural UniversityJ 991
M Sc (Dairy Chemistry) Gujarat Agricultural University, 1994
PROJECT SUBMITTED IN PARTIAL FULFILLMENT OF
THE REQUIREMENTS FOR THE DEGREE OF
MASTER OF BUSINESS ADMINISTRATION
In the
Faculty of Business Administration
Executive MBA
O
Dinesh Puravankara 2007
SIMON FRASER UNIVERSITY
Summer 2007
All rights reserved. This work may not be reproduced in whole or in part, by photocopy or other means, without permission of the author
APPROVAL
Name: Degree:
Title of Project:
Dinesh Puravankara
Master of Business Administration
Strategic Analysis of The Coca-Cola Company.
Supervisory Committee: Mark Wexler Senior Supervisor Professor Date Approved: Neil R. Abramson Supervisor Associate Professor
S I M O N
F R A S E R
U N I V E l i S I T Y
L I B R A R YDeclaration of
Partial Copyright Licence
The author, whose copyright is declared on the title page of this work, has granted to Simon Fraser University the right to lend this thesis, project or extended essay to users of the Simon Fraser University Library, and to make partial or single copies only for such users or in response to a request from the library of any other university, or other educational institution, on its own behalf or for one of its users. The author has further granted permission to Simon Fraser University to keep or make a digital copy for use in its circulating collection (currently available to the public at the "lnstitutional Repository" link of the SFU Library website <www.lib.sfu.ca> at: ~http:llir.lib.sfu.calhandle/l8921112>) and, without changing the content, to translate the thesislproject or extended essays, if technically possible, to any medium or format for the purpose of preservation of the digital work.
The author has further agreed that permission for multiple copying of this work for scholarly purposes may be granted by either the author or the Dean of Graduate Studies.
It is understood that copying or publication of this work for financial gain shall not be allowed without the author's written permission.
Permission for public performance, or limited permission for private scholarly use, of any multimedia materials forming part of this work, may have been granted by the author. This information may be found on the separately catalogued multimedia material and in the signed Partial Copyright Licence.
While licensing SFU to permit the above uses, the author retains copyright in the thesis, project or extended essays, including the right to change the work for subsequent purposes, including editing and publishing the work in whole or in part, and licensing other parties, as the author may desire.
The original Partial Copyright Licence attesting to these terms, and signed by this author, may be found in the original bound copy of this work, retained in the Simon Fraser University Archive.
Simon Fraser University Library Burnaby, BC, Canada
S l M O N
F l i A S E R
U N 1 V k I i S I ' X ' Y
T H I N K I N G
O F
T H E W O R L DSTATEMENT OF
ETHICS
APPROVAL
The author, whose name appears on the title page of this work, has obtained, for the research described in this work, either:
(a) Human research ethics approval from the Simon Fraser University Office of Research Ethics.
(b) Advance approval of t h e animal care protocol from the University Animal Care Committee of Simon Fraser University;
or has conducted the research
(c) as a co-investigator, in a research project approved in advance,
(d) as a member of a course approved in advance for minimal risk human research, by the Office of Research Ethics.
A copy of the approval letter has been filed at the Theses Office of the University Library at the time of submission of this thesis or project.
The original application for approval and letter of approval are fded with the relevant offices, Inquiries may be directed to those authorities.
Bennett Library Simon Fraser University Burnaby, BC, Canada
ABSTRACT
This paper performs a strategic analysis of The Coca-Cola Company, a
leader in the beverage industry. Coca-Cola, the world's leading soft drink maker,
operates in more than 200 countries and owns or licenses 400 brands of
nonalcoholic beverages. Since Coca-Cola operates in more than 200 countries,
more emphasis is given to the CanadianINorth American region in this analysis.
The company faces challenges in today's marketplace because of market
driven changes, regulatory changes and socio-economic changes. An external
analysis of the soft drink industry is performed to understand the impact of
environment. An internal analysis of Coca-Cola is performed to understand the
internal capabilities.
The conclusion of this paper emphasizes that the company needs to
reduce its dependence on carbonated beverage and diversify its product portfolio
into the noncarbonated sector to remain competitive. It is argued that the best
way to become a total beverage company is through addressing the key issues
DEDICATION
I would like to dedicate this effort to my wife Bindu for her unwavering
support and to my daughter Deepika for giving up her story time on many
occasions throughout the program.
I would also like to dedicate this work to my mother Smt. Nandini
Puravankara for all her fervent prayers for my success and all my family for their
ACKNOWLEDGEMENTS
I would like to thank Dr. Mark Wexler and Dr. Neil Abramson for assisting
me in this project to clear my thoughts, make my case and complete the project
on time. I also would like to thank all the faculty members who made the journey
interesting by sharing their knowledge and insights along the way. Lastly, I would
like to thank all my classmates and especially my team members for their support
TABLE OF CONTENTS
.
.
Approval...
11...
Abstract...
111 Dedication...
iv Acknowledgements...
v Table of Contents...
vi List of Figures...
ix List of Tables...
x Glossary...
xi Chapter 1 : Introduction...
I 1 . 1 Company Background ... 2 1.2 Financial Performance ... 3 1.3 Geographic Coverage ... 4 1.4 Organisational Structure ... 4 1.5 Company History ... 51.6 The Contemporary Coca Cola Company ... 7
1.7 Strategic Issues ... 7
1.8 An Overview of the Canadian Soft Drink Industry ... 8
1.8.1 Definition of Category ... 8
1.8.2 Coca-Cola Canada ... 9
1.8.3 Economics of the Canadian Soft Drink Industry ... 10
1.8.4 Change Drivers of the Canadian Soft Drink Industry ... 12
1.8.4.1 EconomicIMarket driven changes ... 12
1.8.4.2 Regulatory issue and changes ... 12
1.8.4.3 Social and Economic changes ... 1 4 Chapter 2: External Analysis of the Soft Drink Industry
...
172.1 Introduction to Porter's Five Force analysis ... 17
2.1 . 1 Threat of new entrants-Low ... 18
2.1.2 Threat of Substitutes-Very Strong ... 18
2.1.3 Threat of Suppliers-Strong ... 19
2.1.4 Bargaining power of Buyers-High ... 20
2.1.5 Competitive rivalry-High ... 21
2.2 Emerging trends in the soft drink industry-Industry Analysis ... 22
2.2.1 Merger & acquisition ... 22
...
2.2.3 Lifestyle 23
2.2.4 Long-term industry growth rate ... 23
2.2.5 Buyer preferences
...
232.2.6 Innovation ... 23
2.3 Summary of Key Success Factors (KSF) ... 24
2.3.1 Product Innovation ... 24 2.3.2 Size ... 24 2.3.3 Quality ... 24 2.3.4 Brand Image ... 25 ... 2.3.5 Price -25 2.3.6 Global Presence ... 25 2.3.6 Distribution ... 25
2.3.6 Healthy Choices (Product Differentiation) ... 26
... 2.4 Industry attractiveness 26 ... 2.5 Analysis of Coca-Cola vs Key competitors 27 ... 2.6 Opportunities and Threats 31 2.6.1 Expanding noncarbonated category ... 31
2.6.2 Expanding bottled water market ... 31
2.6.3 Growth in emerging market ... 32
2.6.4 Strengthen brand image ... 32
2.6.5 Rising raw material prices ... 33
2.6.6 Threat to carbonated beverage category ... 33
2.6.7 Food Safety Issues ... 33
2.6.8 Lack of innovation ... 34
Chapter 3: Internal Analysis: Strategic Fit Analysis
...
36... 3.1 Strategic fit 36 ... 3.1 . 1 Current Strategy 37 3.1.2 Product Strategy ... 38 ... 3.1.3 Research and development expenses 41 3.1.4 Structure ... 43
...
3.1.5 Decision Making 43 3.1.6 Production ... 44 3.1.7 Labour ... 45 3.1.8 Marketing ... 46 3.1.9 Distribution ... 49 3.1.
10 Risk Profile ... 49 ... . 3.1 1 1 Capital Structure 5 3 ... . 3.1 12 Overall Assessment of Strategic Fit 54 Chapter 4: Value Chain Analysis of Coca-Cola...
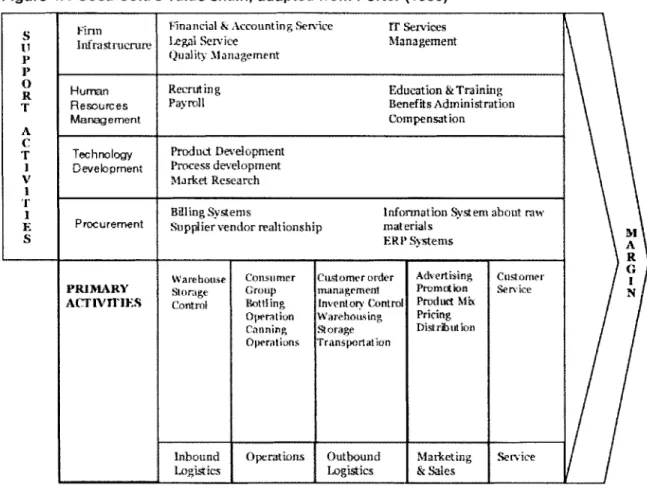
554.1 Firm Level Value Chain ... 55
... 4.2 Firm Infrastructure 55 4.2.1 Finance and accounting ... 55
... 4.2.2 Legal Services 59 ... 4.2.3 Quality 62 4.2.4 IT Services
...
63 vii...
4.2.5 Management 64
4.3 Human Resource Management ... 66
4.4 Technology Development
...
67 4.5 Procurement ... 69 4.6 Primary Activities ... 70 4.6.1 Inbound Logistics ... 70 ... 4.6.2 Operations 70 4.6.3 Outbound Logistics ... 714.6.4 Marketing and Sales ... 72
4.6.5 Service ... 74
4.7 Culture of the Firm ... 74
4.8 Financial Analysis ... 75
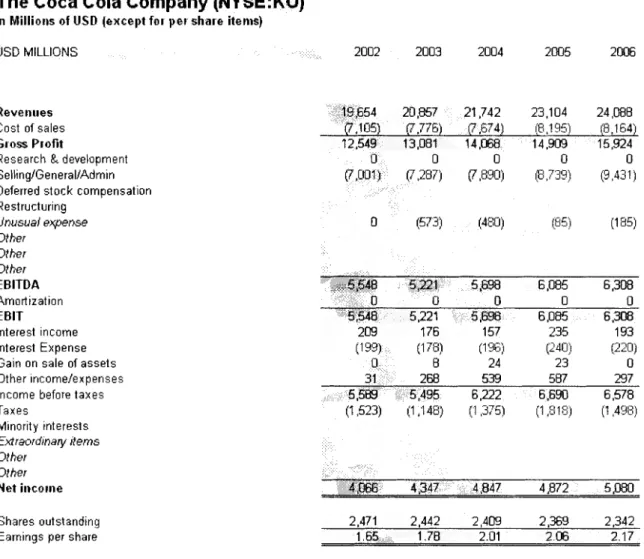
4.8.1 Discussion of Income Statement ... 76
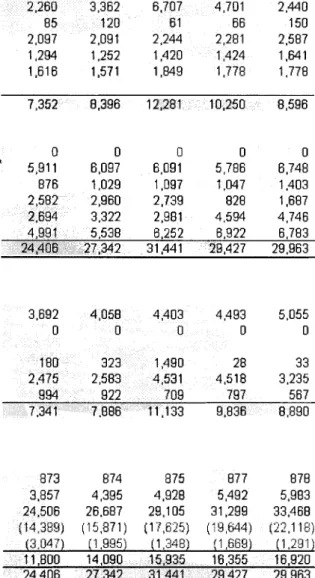
4.8.2 Discussion of Balance Sheet ... 78
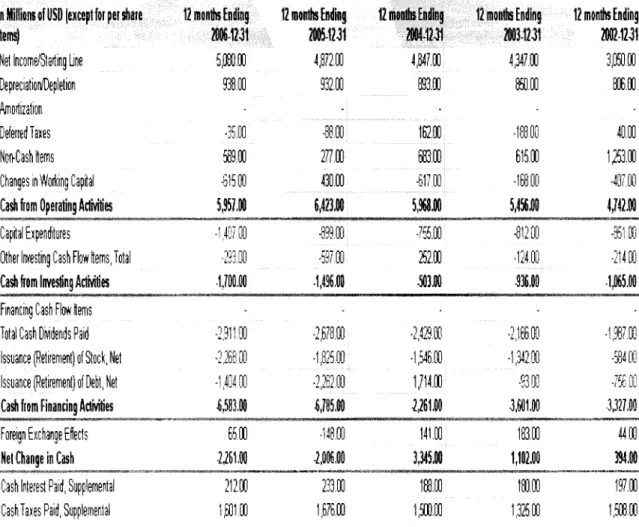
4.8.3 Discussion of Cash Flow Statement ... 79
4.8.4 Discussion of Financial Ratios ... 81
Chapter 5: Issue Analysis and Recommendations
...
84... 5.1 Declining volume in Carbonated Soft Drink Sector 84 5.2 Recommendations for declining volume in the carbonated soft drink sector ... 85
5.3 Health and Wellness Trend ... 87
5.4 Recommendations for health and wellness trend ... 89
5.5 Increased competition from PepsiCo ... 90
5.6 Recommendations for increased competition from PepsiCo ... 90
5.7 Conflict with bottlers ... 91
... 5.7 Recommendations for Conflict with bottlers 92 ... 5.8 Lack of innovation 93 5.9 Recommendations for lack of innovation ... 94
5.1 0 Food Safety and Statutory Regulation Issues ... 95
5.1 0 Recommendations for food safety and statutory regulation issues ... 96
5.1 1 The New Coca-Cola Company: Towards a Learning Organization ... 97
Reference List
...
101LIST OF FIGURES
Figure 1 :I Geographic coverage of Coca- Cola ... 4
Figure 1 :2 Organizational Structure of Coca-Cola ... 6
Figure 2:l Gartner Research: Magic Quadrant ... 29
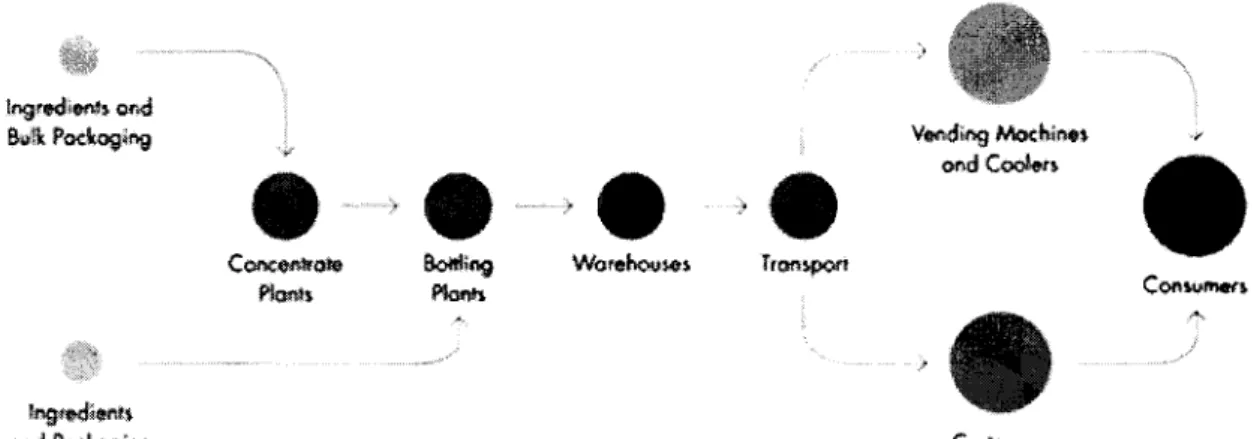
Figure 3:l Manufacturing process at Coca-Cola ... 44
Figure 4.1 Coca-Cola's value chain. adapted from Porter ( I 980) ... 56
Figure 4:2 Income Statement ... 77
Figure 4:3 Balance Sheet ... 79
Figure 4:4 Cash Flow Statement ... 80
Figure 4:5 Financial ratio Analysis (Pyramid Analysis) ... 82
LIST
OF
TABLES
Table 2-1 Financial analysis of Coca-Cola and its key competitors ... 29 Table 2-2 Firm's capability to deliver against key success factors ... 30 Table 3-1 Strategy for Coca-Cola ... 36
GLOSSARY
BI BPW CAGR CCE CCU CSD DMADV DMAlC EBP FDA FTA GAAP HFCS IBLF KSFBusiness Intelligence- Business intelligence is actually an environment in which business users receive data that is reliable, consistent,
understandable, easily manipulated and timely.
Beverage Partners Worldwide- a joint venture between Coca-Cola and Nestle
Compound Annual Growth Rate- interest rate at which a given present value would grow to a given future value in a given amount of time.
Coca Cola Enterprises
Coca Cola University
Carbonated Soft Drink- Non alcoholic beverages with carbon dioxide
Define, Measure, Analyze, Design, & Validate
Define, Measure, Analyze, Improve & Control
Enterprise Buyer Professional
Food and Drug Administration - The United States Food and Drug Administration
Free Trade Agreement- Often refers to the Canada-U.S. Free Trade Agreement that entered into force on January 1, 1989.
Generally Accepted Accounting Principles- he common set of accounting principles, standards and procedures.
High Fructose Corn Syrup A clear, highly viscous product of starch hydrolysis, where the glucose thus produced is partially isomerized to fructose.
International Business Leaders Forum
N AS National Academy of Sciences
NLRB National labour Relations Board
PET Polyethylene Terephthalate
-
A plastic material used to make beverage, concentrate, and beverage base containersRDI Reference Daily Intake
-
the dietary reference values that are used on all current US Nutrition Facts labels.RIM Records and Information Management
ROA Return on Assets
ROE Return On Equity
RONA Return On Net Assets
RTD Ready to Drink
SAP Systems Applications and Products in Data Processing
SEM Strategic Enterprise Management
BCS Business Consolidation
BPS Business Planning and Simulation
SIC Standard Industrial Classification- Statistics Canada's standardized coding system for grouping businesses engaged in similar types of activity into non-overlapping industry categories.
SWOT Strength Weakness Opportunities Threats
TCCQS The Coca Cola Quality System
TTM Trailing Twelve Month
TQM Total Quality Management- is an approach to quality management that provides a methodology for achieving business success through coordinated and informed management
YOY Year over Year
CHAPTER 1 : INTRODUCTION
The Coca-Cola Company (Coca-Cola), the worlds leading soft drink
maker, operates in more than 200 countries and sells 400 brands of nonalcoholic
beverages. Coca-Cola is also the most valuable brand in the world. Coca-Cola is
a globally recognised successful company. The Coca-Cola story began in May of
1886 and continues for more than a century through the times of war and peace,
prosperity and depression and economic boom and bust. As late as the 1990's,
Coca-Cola was one of the most respected companies in the world, a master of
brand -building and known as a very successful management team. Since 1998,
the company has been struggling with issues identified in this analysis (Chapter
4). Observers wonder if Coca-Cola has lost its fizz and if the real thing could ever
revive.
The purpose of this paper is to assess the current situation of Coca-Cola
and the industry, evaluate the existing resources, suggest a strategy and provide
strategic recommendations. A specific strategy will help to match strength and
distinctive competence in such a way that Coca-Cola enjoys a competitive
advantage over immediate rivals in the industry.
An overview of company background and the soft drink industry is outlined
in Chapter 1. Chapter 2 provides an external analysis of the soft drink industry.
emerging trends in the industry and assess the industry attractiveness of the soft
drink industry.
Chapter 3 is an internal analysis-strategic fit analysis of Coca-Cola, where
I examine the concepts of firm capabilities and provide an internal analysis of
strengths and weaknesses at Coca-Cola. Chapter 4 is an internal analysis- value
chain analysis, where I describe all the activities that make up the economic
performance and the capabilities of Coca-Cola.
Issues affecting the company are described and developed in Chapter 5.
Strategic recommendations to address the company's specific issues are
presented in Chapter 5 within the broad context of the suggested overall
strategy. The recommendations make sense if one starts with a scrutiny of the
company background. I also highlight my interest in the Canadian aspects of
Coca-Cola.
1
.I
Company Background
The Coca-Cola Company manufactures, distributes and markets
nonalcoholic beverage concentrates and syrups. Coca-Cola owns or licenses
more than 400 brands, including diet and light beverages, waters, juice and juice
drinks, teas, coffees, sports and energy drinks. It has ownership interests in
numerous bottling and canning operations. Coca- Cola sells finished beverage
products bearing the Coca-Cola trademarks in more than 200 countries. As
December 31, 2006, Coca-Cola operated through eight segments: Africa; East,
North Asia, Eurasia and Middle East; Bottling Investments and Corporate (The
Coca Cola Company, 2006).
The activities of Coca-Cola straddle all sectors of the soft drink industry: in
worldwide trade in 2004 it led in volume and value the carbonates, fruitlvegetable
juice and Ready to Drink (RTD), coffee sectors. It was the second leading player
in the world in functional drinks and Asian speciality drinks. It was number three
in bottled water. With regard to concentrates, Coca-Cola held second place in
volume and ranked third in the world in value terms. In RTD tea, Coca-Cola
ranked number one in value and number three in volume terms (Euromonitor
International, 2005).
1.2 Financial Performance
Coca-Cola grew turnover by approximately 4 percent in 2006. In the same
year it reached nearly US$24 billion. The company generated 73 percent of the
revenue from locations outside the company's domestic US market. The shift
towards foreign markets as a financial concern is likely to continue.
Recent growth has been chiefly in the form of brand extensions and an
ever-expanding distribution network. However, at a global level, stagnation in
carbonates has affected volume growth for Coca-Cola. Volume growth in terms
of cases grew by only 2 percent in 2006, and remained stagnant in the key North
American and Europe, Eurasia and Middle East markets (The Coca Cola
Company, 2006). This slow down in carbonates has impacted some investors'
1.3 Geographic Coverage
The geographic coverage of Coca-Cola is the best in the world - it is hard
to think of a brand that has achieved such massive levels of penetration and
recognition (See Fig 1 . I : Illustrates the operating segments of International
Operations). International operations contributed 73 percent of 2006's sales and
74 percent of operating income in 2006 (The Coca Cola Company, 2006).
Figure 1:l Geographic coverage of Coca- Cola
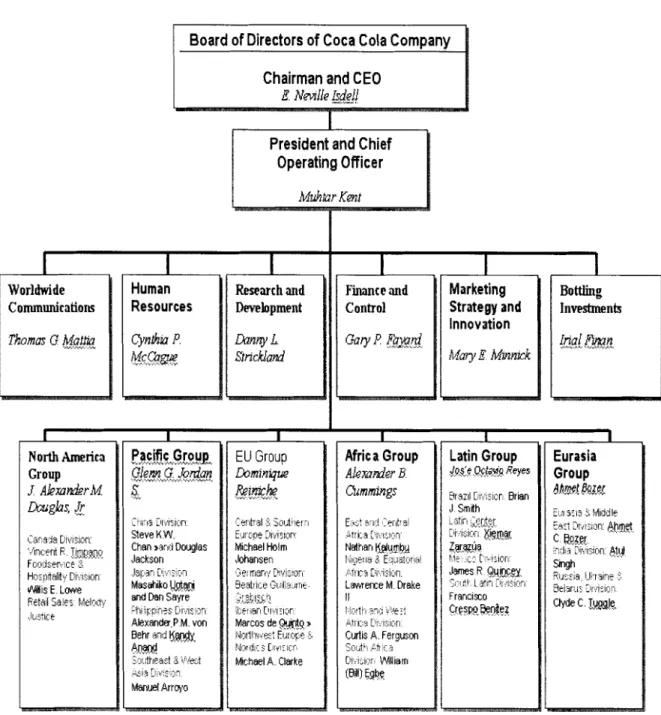
1.4 Organisational Structure
In 2001, Coca-Cola restructured its geographical operating segments and
renamed them at the same time. North America (including The Minute Maid
Company) now includes Puerto Rico, added from Latin America. Europe and
Eurasia changed theirs names to Europe, Eurasia & Middle East. At the same
time, Africa & Middle East, excluding the reclassified Middle East segment,
changed their names to Africa. Figure 1.2 summarizes the organisational
structure of Coca-Cola.
During the first quarter of 2001, Asia Pacific was renamed Asia. In 2002,
Egypt was reclassified from Europe, Eurasia & Middle East to Africa. In 2004,
Coca-Cola reclassified certain departments from the North American operating
segment to the corporate operating segment.
In March 2007, Coca-Cola reorganized its North American business to
better reflect its strategic focus, creating three new business units for its sodas
and other beverages. In a note to employees, Coke North America President
Sandy Douglas said the new operating model would enable Coca-Cola "to
transform our business and win in the marketplace." The three business units
--
sparkling beverages, still beverages and emerging brands will define Coca-Cola'sfocus in the North American market, where it faces stiff competition from rival
PepsiCo Inc and makers of healthier beverages such as juices.
1.5
Company History
The "Coca-Cola" trademark was registered in 1893, although it was seven
years earlier that pharmacist Dr John Styth Pemberton created fragrant caramel
coloured syrup that went on sale as a soda fountain drink in Atlanta, Georgia.
Large-scale bottling began in 1894, after the rights to bottle and sell Coca-Cola
Figure 1:2 Organizational Structure of Coca-Cola
Fig 1.2 Organizational Structure of Coca-Cola
Chairman and CEO
E N m h ? &dgjl
President and Chief Operating Officer Worldwide Communications Thomas G @ 4 & Human Resources QPlh P &%% Research and Development Finance and
Control Strategy and
Innovation Mury E MmPlrk Bottling Investments North America Group J AlemdrM Lwzbs Jl Pacific Group- *#.*,"*.*~A.*,.*.*u>* Glem G. Jordu~~ l u * . , . w . \ . l \ l l , v d . , ~ , A , ~ . , ~
G"
:.ma :~lvisli:in. Steve K.W. Chan t a x i Douglas Jackson .jc,~3rl [1;vi?:97 Masahiko l,&r~and Dan Sayre
r!,liipnr; C , ~ . . p i - ,
Alexanda.P.M. v m Behr and &pjyw *D"@. ;,y,$klead 8 't?,j~;t ~ z i a T,,y:y Manuel Arrojo I EU Group Dominiqw Reltdik? ,Y, >".,.\".<.\ 2 r l & & .uropr 3wis!on Michael Holm Johansen pj-;,,.:i Ssatriir ~>uil;r.ir;~e &l~j:! ;I;E'I~D ['!VITI<~T Marcos de D ;lalIf~:~: E!i:oce . ?,j:ori:f,c 3 [.i,p:!cr, Michael A. Clarke II Francisco
i:'& !-,a i~,!~:t c r e w & ? ? %
In 1923, Fanta became the first soft drink other than Coca-Cola marketed
by the company, and in the same year Coca-Cola extended into fruit juices and
concentrates with the acquisition of the Minute Maid Corporation. This added
frozen citrus concentrates and other drinks, along with the brands Minute Maid
and Hi-C to its growing portfolio.
I
.6 The Contemporary Coca Cola Company
Fast-foward 1 12 years, to April 2005, when Coca-Cola, alongside its
subsidiary, Coca-Cola Hellenic Bottling Company, agreed to a deal with Russia's
Multon juice company. Multon owns local Rich, Nico and Dobry brands. It is a
market leader in the Russian fruitlvegetable juice category with a 22.9 percent
volume share in 2004.
In March 2007, Coca-Cola acquired all Fuze Beverage brands, including
the Vitalize, Refresh, Tea and Slenderize lines for an undisclosed price. The
restructuring and realignment of Coca-Cola in recent years has slightly reduced
the company's heavy reliance on carbonates, although these still account for
some 83 percent of global volume. At the same time the acquisitions provide
dominant positions in faster-growing beverage sectors such as bottled water,
RTD tea and coffee and functional drinks.
I
.7 Strategic
Issues
Coca-Cola faces several significant strategic issues. I will enlarge upon
this discussion in Chapter 4. Three primary strategic issues are of importance.
the current health and wellness trend sweeping across the beverage industry.
The third issue is the threat of increased competition from PepsiCo. The other
strategic issues the company faces include increasing conflict with the bottlers,
lack of innovation and food safety and statutory regulatory compliance.
1.8 An Overview of the Canadian Soft Drink lndustry
The goal of this section is to understand the Canadian soft drink lndustry
in relation to the North American soft drink industry.
The Canadian soft drink industry, with more than 20 bottling plants, has
an annual payroll exceeding $360 million. Modern bottling plants can produce
more than 2,000 soft drinks per minute on each line of operation. The industry
employs more than 8,000 Canadians directly, and an additional 30,000 people
indirectly in support industries. Soft drinks represent about one third of the $4.4
billion worth of beverages Canadians purchase in supermarkets each year. This
section will briefly look into the category from a Canadian perspective, economics
of the soft drink industry in Canada and change drivers in the Canadian soft drink
industry. Finally, a brief outlook of Coca-Cola Canada is given at the end of the
section that will lead to the external analysis of the soft drink industry.
1.8.1 Definition of Category
In Canada, the soft drink industry (SIC 11 1) consists of establishments
primarily engaged in manufacturing nonalcoholic, carbonated beverages, mineral
waters and concentrates and syrups for the manufacture of carbonated
noncarbonated fruit drinks are classified in the Canned and Preserved Fruit and
Vegetable Industry (SIC 1031) (HRDSC, 2001).
Principal activities and products in this industry are:
Aerated waters;
Carbonated beverages;
Mineral and spring waters;
Soft drink concentrates and syrup; and
Soft drink preparation carbonating.
I .8.2 Coca-Cola Canada
Coca-Cola Canada continues to provide quality beverages 100 years after
the leading brand was introduced to Canadians. From the early days of horse
and cart deliveries, Coca-Cola Canada now has the largest fleet of trucks and
vehicles nationwide. Coca-Cola Canada has built a reputation for understanding
the unique aspects of the Canadian marketplace and developing marketing
customer campaigns that respond to these different opportunities. The Coca-
Cola Bottling Company produces, sells and distributes nonalcoholic beverages
and operates in all ten provinces, employing approximately 5500 Canadians.
Coca-Cola Ltd represents The Coca Cola Company in Canada and provides
research, marketing and advertising leadership as well as quality assurance
Starting with a single 3,800 square foot bottling plant in Toronto in 1905,
operations have since expanded such that the company is operating in all
provinces with local distributors in every territory. Most recently, Coca-Cola
Bottling Company completed a $1 50 million investment in a state-of-the-art
630,000 square foot production and distribution centre in Brampton, Ontario.
Over many years, and many more years in the future, Coca-Cola Canada's goal
will be to provide a moment of refreshment for thirsty Canadians- one customer
and one consumer at a time.
Coca-Cola Canada is also affiliated with numerous local and national
sporting events. Coca-Cola Canada was proud to participate as an official
sponsor for the 1976 Summer Olympic Games in Montreal, Quebec and 1988
Winter Olympic Games held in Calgary, Alberta. To officially start Vancouver's
journey to the 2010 Winter Olympic Games, Coca-Cola Ltd. introduced a
commemorative can in western Canada. The 'Celebrating the Beginning'
Vancouver 2010 cans featured a graphic of a downhill skier coasting down the
trademark Coca-Cola wave. As an Olympic worldwide partner, Coca-Cola
Canada wanted to mark this significant occasion and help its western customers
get into the Olympic spirit.
1.8.3 Economics of the Canadian Soft Drink Industry
The Canadian soft drinks market generated a total revenue of $6.1 billion
in 2005, this representing a compound annual growth rate (CAGR) of 2.5 percent
for the five-year period spanning 2001 -2005. Market consumption volume
litres in 2005. Canadians consumed an average of 55.1 litres of soft drinks in
1972, and the consumption grew by an average of 2 percent per year over the
next three decades. Fuelling this phenomenal growth were the increasing
availability of soft drinks and the introduction of diet and flavoured varieties of soft
drinks.
In 2005, Canadians consumed 107 litres of soft drink per year (Statistics
Canada, 2007). Carbonates sales proved the most lucrative for the Canadian soft
drinks market in 2005, generating a total revenue of $2.9 billion, equivalent to
47.8 percent of the markets overall value. Juice sales generated a total revenue
of 1.25 billion, equivalent to 20.5 percent of the market's overall value.
At this rate the performance of the market will drive the market to a value
of $7 billion by the end of 2010. The market volume is likely to rise to 5513 million
litres by the end of 2010. Ironically, Canada contributes just 4.5 percent of the
value of the American soft drinks market, whereas the United States generates
79.4 percent of the value of the market. The production and distribution of soft
drink involved four major participants: concentrate producers, bottlers, retail
channels and suppliers (Datamonitor, 2006).
The three major players- PepsiCo, Coca-Cola and Cadbury Schweppes
dominate the Canadian soft drink market. The market leader PepsiCo holds 35.1
percent share by volume followed by Coca Cola (26.5%) and Cadbury
market is Supermarket and Hypermarket (48.9%) outlets followed by On-Trade
(1 6.3%) and Independent Retailers (7.4%) (Datamonitor,2006).
1.8.4 Change Drivers of the Canadian Soft Drink Industry
"Change Drivers" are those large-scale factors that produce change at
lower levels of system organization. Typically, these change drivers consist of
global, demographic, economic, technological, information, and other factors that
create a changing environment to which organizations must adapt. This section
will briefly describe the change drivers in the Canadian soft drink industry such
as economic/market driven changes, regulatory changes and socio-economic
changes.
1.8.4.1 EconomiclMarket driven changes
Rationalization of the soft drink industry on a North American basis cut the
number of establishments in this industry in half between 1986 and 1993. Private
label products have made inroads into the market share of the major brands. The
industry experienced intense price competition with expansion of private label
sales. There was an overall decrease in retail prices between 1988 and 1997.
Remaining establishments are typically very efficient (HRDSC, 2001).
1.8.4.2 Regulatory issue and changes
The soft drink industry was historically based on a franchise system, which
characterized the soft drink industry worldwide. The system provided a soft drink
bottler with a defined market area and exclusive manufacturing and distribution
formula concentrates and/or syrups from a single source - the franchise company
(franchisor) that held the registered trademarks of a number of soft drink brands.
The franchiser established pricing policies and provided overall marketing and
brand promotion support. Coca-Cola System is still organized on a franchise
basis and has one of the largest trademark licensing program in the world.
The Canadian soft drink industry has undergone significant changes
during the last decade. The changes include the adoption of the Canada-United
States Free Trade Agreement (FTA), the shift to Polyethylene Terephthalate
(PET) plastic bottles and metal cans, consolidation in both the brand holding and
bottling functions in the industry and the adoption of high fructose corn syrup
(HFCS) as an alternative sweetener in place of sugar in nondiet soft drinks.
Deposit laws and other measures to ensure recycling and reuse of
beverage containers are perhaps the most significant regulatory concern of the
industry.
Requirements under food labelling of ingredients and nutritional
information continue to be under review and subject to change. Canadian food
and beverage manufacturers argue that one of the challenges facing their
industry is the lack of harmonization between Canada and the United States on
certain food ingredients and labelling regulations.
All soft drink manufacturers in Canada must meet the standards of quality,
hygiene and safety established by both Health Canada and the corporations
Health Canada, which is the regulatory agency responsible for the
development of food labelling policy, is currently examining, in consultation with
other stakeholders including industry, several food labelling issues including
health claims, nutrient content claims, nutrition labelling and food fortification.
Regarding food fortification, one of the questions under review is whether foods
that do not fit into traditional food groups (i.e., soft drinks, savoury snacks,
confections, etc.) should be considered as a vehicle for food fortification.
Although there are no customs duties and sales taxes on finished
products, with the implementation of the Canada-US Free Trade Agreement, the
largest soft drink companies tend not to ship finished product across the Canada-
U.S. border because of differences in ingredient and labelling regulations. In the
U.S., many noncolas contain caffeine, which is not allowed in such drinks in
Canada. Another ingredient, saccharine, is banned in Canada in soft drink
usage. As well, Canada has metric and bilingual labelling requirements.
At the same time, governments are streamlining food inspection systems,
reducing direct inspection while requiring documentation of food safety systems
by companies (HRDSC, 2001).
1.8.4.3 Social and Economic changes
In 2005, the average Canadian consumed 107 litres of soft drinks. On
average, Atlantic Canadians consume the most soft drinks while the lowest
consumption rate is in British Columbia. Canadians buy more than 50 per cent of
their soft drinks through grocery stores. Consumers will continue to demand high-
quality products through the marketed goods sector. In Canada, about 20 to 25
per cent of soft drinks sold are diet drinks; most soft drinks sold are regular
(nondiet) products. Although retail concentration has increased over the years,
soft drink manufacturers enjoy a wider variety of distribution channels than some
processed food and beverage products.
The industry distributes its products through supermarkets and grocery
stores, drug stores, convenience stores and gas outlets, mass merchandisers
and warehouse outlets. The foodservice and hospitality industry, in particular fast
food outlets, is another method of distribution. Vending machines also provide a
distribution channel for these products. Consumers of soft drink products have a
great assortment of flavours from which to choose. Over 25 major brands and
over 200 flavours of soft drinks are distributed throughout Canada.
The majority of soft drinks are sold in aluminium cans and PET plastic
bottles. They are also sold in bulk through soda fountains. Bottles, most of which
comprise PET plastic, account for 41.5 percent of sales, cans make up 41.6
percent, and fountain sales account for 16.9 per cent of sales. Only a very small
portion of soft drinks are still packaged in glass bottles, due in part to the late
1970s problem of exploding glass bottles with contents under pressure as well as
changing consumer preferences and lifestyles (HRDSC, 2001 ).
The first part of this chapter briefly introduced the background and
structure of Coca-Cola, financial performance and some of the strategic issues
the company is facing in the current environment. The second dealt with the
overview, economics and change drivers in the Canadian soft drink industry.
the CanadianINorth American region in this analysis. Having explained the
details about the Company and the soft drink industry. I will move on to the
external analysis of the soft drink industry in Chapter 2. The external environment
represents all external forces, factors, or conditions that exert some degree of
impact on strategies, decisions, and actions taken by the company. Next chapter
focuses on the task of external analysis of soft drink industry and its role in
CHAPTER 2: EXTERNAL ANALYSIS OF THE SOFT DRINK
INDUSTRY
The competitive state of an industry is a key factor in determining how
firms develop their strategies to earn profit over time. Even though the nature of
competition differs significantly between industries, competition in the soft drink
industry is determined by its own particular structure. Industry structure refers to
the interrelationship among the five forces presented by Porter ( I 98O), described
in detail in this chapter, that drive behaviour of firms competing in that industry.
Furthermore an attempt is made to explore the emerging trends in the soft drink
industry, identify the key success factors, evaluate industry attractiveness and
identify opportunities and threats (SWOT analysis) the company is facing in its
current environment.
2.1 Introduction to Porter's Five Force analysis
One of the earliest models used to examine industry economics and
industry attractiveness is Michael Porter's Five Force Model (Porter, 1980).
Porter suggests five forces that determine industry profitability: competitive rival
sellers within the industry, new entrants to the industry, substitute products,
suppliers, and buyers. The weaker the forces, the greater the opportunity for
superior performance by firms within the industry. Firms that satisfy the Key
2.1.1 Threat of new entrants-Low
New entrants to the industry are not a strong competitive pressure in the
soft drink industry. Coca-Cola and PepsiCo dominate with their strong brand
name and superior distribution channels. In addition, the soft-drink industry is
fully saturated. New growth is small. This makes it very difficult for new, unknown
entrants to start competing against the existing established firms. Another barrier
to entry is the high fixed costs for warehouses, trucks, and labour and economies
of scale. New entrants cannot compete on price without economies of scale.
These high capital requirements and market saturation make it extremely difficult
for companies to enter the soft drink industry; therefore new entrants are not a
strong competitive force.
The overall KSF identified from the threat of new entrants are size, price,
brand image, distribution and global presence.
2.1.2 Threat of Substitutes-Very Strong
Substitutes for Coca-Cola products are bottled water, sports drinks,
coffee, and tea. Bottled water and sports drinks are increasingly popular with the
trend towards the health conscious consumer. This trend is epitomized in the
beverage consumption pattern of the ageing baby boomers.
There are a growing number and varieties of water and sports drinks that
appeal to different consumers' tastes. These are advertised as healthier than soft
drinks. In addition, coffee and tea are competitive substitutes because they
provide caffeine. Soft drinks can be substituted with coffee. Specialty blend
coffees are also becoming more popular with the increasing number of Starbucks
stores that offer many different flavors to appeal to all consumer markets. Low
switching costs for the consumer makes the threat of substitute products very
strong (Datamonitor, 2005).
The overall KSF identified for threat of substitutes are quality and
innovation.
2.1.3 Threat of Suppliers-Strong
Suppliers to Coca-Cola are bottling equipment manufacturers and
secondary packaging suppliers. Although Coca-Cola does not do any bottling,
the company owns about 36 percent of Coca-Cola Enterprises. The rest of the
Coca-Cola Enterprises is a publicly traded company. This is the largest bottler in
the world (The Coca Cola Company 2006). Since Coca-Cola owns the majority of
the bottler, it looks like that particular supplier does not hold much bargaining
power. However, there has been increased concern about the simmering
tensions between Coca-Cola and its increasing powerful independent bottlers
such as Coca-Cola Enterprises. Coca-Cola Enterprises controls 80 percent of the
US market as well as parts of Europe. Coca-Cola is introducing new product at a
significant rate. The operational and distributional complexity due to new product
introduction is affecting the bottom line of the bottlers. Some bottlers have even
refused to carry new products. The conflict with the bottlers can be a major threat
to Coca-Cola.
In terms of equipment manufacturers, the suppliers are generally
supply, so it is fairly easy for a company to switch suppliers. This takes away
much of the suppliers' bargaining power. However, rising sugar and packaging
material prices have a direct impact on the profitability of the Coca-Cola's
products.
The overall KSF identified for threat of suppliers are size and global
presence.
2.1.4 Bargaining power of Buyers-High
The buyers of Coca-Cola and other soft drinks are mainly large grocers,
discount stores, and restaurants. The soft drink companies distribute the
beverages to these stores for resale to the consumer. The bargaining power of
the buyers is very evident and strong. Large grocers and discount stores buy
large volumes of the soft drinks, allowing them to buy at lower prices.
Restaurants have less bargaining power because they do not order in large
volume. However, with the number of people drinking less soft drink, the
bargaining power of buyers could start increasing due to decreasing buyer
demand. The interesting shift in buyer demand because of increased demand for
healthy choices has driven the market share of substitute drinks. Consumers are
focusing more on healthy choices and buying healthy drinks from "high end-
speciality stores. This phenomenon is due to health and wellness trend sweeping
across the global beverage market. Soft drink consumers are moving their
consumption from regular cola carbonates to low-calorie carbonates, bottled
water, sport drinks, juice and teas. Coca-Cola should adapt to this consumer
behaviour for future growth.
The overall KSF identified for bargaining power of buyers are size, healthy
choices and global presence.
2.1.5 Competitive rivalry-High
The competitive pressure from rival sellers is the greatest competition that
Coca-Cola faces in the soft drink industry. Coca-Cola, PepsiCo., and Cadbury
Schweppes are the largest competitors in this industry with global presence.
Though Coca-Cola owns four of the top five soft drink brands (Coca-Cola, Diet
Coke, Fanta, and Sprite), it had lower sales in 2006 than did PepsiCo. However,
Coca-Cola has higher sales in the global market than PepsiCo. In 2006, PepsiCo
dominated North America with sales of $22 billion, whereas Coca-Cola only had
about $7 billion, with more of their sales coming from overseas. PepsiCo is the
main competitor for Coca-Cola and these two brands have been in a power
struggle for more than a century.
Brand name loyalty is another competitive pressure. The Brand Keys'
Customer Loyalty Leaders Survey (Brand Loyalty, 2006) shows the brands with
the greatest customer loyalty in all industries. Diet Pepsi ranked 18th and Diet
Coke ranked 47th as having the most loyal customers to their brands
The overall KSF identified for the competitive rivalry are size, global
presence and brand image.
Porter's Five Forces Model identifies the five forces of competition for any
company. The recognition of the strength of these forces helps to see where
industry, especially from PepsiCo, is the greatest source of competition for Coca-
Cola.
2.2 Emerging trends in the soft drink industry-Industry Analysis
2.2.1 Merger & acquisitionThe soft drink industry is a mature industry that will lead to change. The
entrylexit of major firms is a trend in the industry that will also likely lead to
change. More specifically, merger and consolidation have been prevalent in the
soft drinks market. Several leading companies have been looking to drive
revenue growth and improve market share through the increased economies of
scale found through mergers and acquisitions. One specific example is how
PepsiCo acquired Quaker Oats, who in turn bought Gatorade. That will help
expand PepsiCo's energy drink sector (Datamonitor, 2005). This is a great
opportunity Coca-Cola missed as the first-mover in the energy drink sector.
2.2.2 Globalization
With the growing use of the Internet and other electronic technologies,
global communication is rapidly increasing. This is allowing firms to collaborate
within the country market and expand into world markets. It has driven
competition greatly as companies strive to be first-movers. Specifically, the global
soft drink market's compound annual growth rate (CAGR) is expected to expand
2.2.3 Lifestyle
Changing societal concerns, attitudes, and lifestyles are important trends.
In the United States and Europe, people are becoming more concerned with a
healthy lifestyle. "Consumer awareness of health problems arising from obesity
and inactive lifestyles represent a serious risk to the carbonated drinks sector"
(Datamonitor, 2005). The trend is causing change. Coca-Cola is differentiating its
products in order to increase sales in a stagnant market.
2.2.4 Long-term industry growth rate
Since 2000, the CAGR is 1.5 per cent (Datamonitor, 2005). The low
growth rates are of concern for soft drink companies, and Coca-Cola is creating
new strategies to combat the low rates.
2.2.5 Buyer preferences
Because soft drinks have been around since as early as 1798 (American
Beverage Association, 2005), buyers want innovation with the products they buy.
The key for Coca-Cola's success is differentiation.
2.2.6 Innovation
Product innovation is necessary to combat buyer's search and desire for a
variety of beverage varieties. Coca-Cola is already differentiating by taste.
Recent additions to Coca-Cola's product portfolio include regular Coke Zero, C2,
Fresca, Diet Cherry Coke, Cherry Coke, Vanilla Coke, Coca-Cola with Lime,
2.3 Summary of Key Success Factors (KSF)
Key factors for competitive success within the soft drink industry derived
from the Porter's five force analysis and industry analysis are as follows:
2.3.1 Product Innovation
Primarily, constant product innovation is imperative. Coca-Cola must be
able to recognize consumer wants and needs, while maintaining the ability to
adjust with the changing market. Coca-Cola must keep up with the changing
trends.
2.3.2 Size
Large distributors have the ability to negotiate with stadiums, universities
and school systems, making them the exclusive supplier for a specified period of
time. Additionally, they have the ability to commit to mass purchases that
significantly lower their costs. Coca-Cola must implement effective distribution
channels to remain competitive.
2.3.3 Quality
Quality of the product is also a key factor for success. In technical usage,
quality can have two meanings:
1. The characteristics of a product or service that bear on its ability to satisfy
stated or implied needs.
The Coca-Cola Quality System is a worldwide initiative involving every
aspect of the business. Everyone who works for or with Coca-Cola is empowered
and expected to maintain the highest standards of quality in products, processes
and relationships
2.3.4 Brand Image
Established brand loyalty is a large aspect of the soft drink industry. Many
consumers of carbonated beverages are extremely dedicated to a particular
product, and rarely purchase other varieties. This stresses the importance of
developing and maintaining a superior brand image.
2.3.5 Price
Price is also a key factor because consumers without a strong brand
preference will select the product with the most competitive price.
2.3.6 Global Presence
Global presence through expansion is a vital factor in the success of a
company within the soft drink industry. The United States has reached relative
market saturation, requiring movement into the global industry to maintain growth
(Datamonitor, 2005).
2.3.6 Distribution
Superior distribution channel is a key success factor because it enables
the company to move the products from the manufacturer to the consumer
2.3.6 Healthy Choices (Product Differentiation)
Healthy choices or product differentiation will be a source of competitive
advantage for a beverage manufacturer. Coca-Cola should produce beverage
that has unique and valuable characteristics for certain market segment like
health conscious consumers.
2.4 Industry attractiveness
Market size, growth rate and overall profitability are three economic
indicators that can be used to evaluate the soft drink industry. The market size of
this industry has been changing. Soft drink consumption has a market share of
46.8 percent within the nonalcoholic drink industry. Datamonitor (2005) also
found that the total market value of soft drinks reached $307.2 billion in 2004 with
a market value forecast of $367.1 billion in 2009. Further, the 2004 soft drink
volume was 325,367.2 million liters. The soft drink industry is lucrative with a
potential for high profits, but there are several obstacles to overcome in order to
capture the market share.
The growth rate has been recently criticized due to the market saturation
of soft drinks. This change is attributed to the other growing sectors of the
nonalcoholic drink industry including tea and coffee (1 1.8%) and bottled water
(9.3%). Sports drinks and energy drinks are also expected to increase in growth
Profitability in the soft drink industry will remain rather solid, but market
saturation, especially in the U.S., has caused analysts to suspect a slight
deceleration of growth in the industry (Datamonitor, 2005). Because of this,
competitors like PepsiCo are establishing themselves in alternative markets such
as the snack, confections, bottled water, and sports drinks industries. In
conclusion, the soft drink market is still very attractive with potential for high
profits that can be achieved through product diversification.
Coca-Cola should diversify its product offerings to continue to grow and
increase profits. Coca-Cola should not bet on revenue growth only from the
carbonated beverage sector. To sharpen this point I will turn to a clear
examination of Coca-Cola's competitors.
2.5
Analysis of Coca-Cola vs Key competitors
The goal of this section is to assess the performance of three competitors
and then evaluate these companies in the context of the Key success factors
identified through five force analysis and industry analysis.
The magic quadrant developed by Gartner group was applied to the
different competitors in the soft drink industry. The intent of the diagram is to
illustrate the position of competitors in the market as measured on two criteria;
namely completeness of vision and ability to execute. Based on these two criteria
the soft drink industry can be categorized into four quadrants; namely Leaders,
Leaders are companies that are reasonably strong in the breadth and
depth of their capabilities to deliver on a global basis. Challengers are well
positioned to succeed in the market. However, they may be limited to a specific
environment. Visionaries are companies that have strong vision for delivering
new products. Niche players are those that do well in a specific segment of
beverage market such as natural drinks. The competitors were assigned to the
magic quadrant based on the above definitions.
Challengers
Cadbury Cott Corp.
Hansen Natural Corp. Ocean Spray Inc
- Niche Player Leaders Coca-Cola Pepsi Redbull Gmbh National Beverage Corp
Jones Soda Co.
Visionaries
Figure 2:l Gartner Research: Magic Quadrant
(Source:Gartner Research 2004)
As can be seen in the magic quadrant illustration, Coca-Cola is in the
leader quadrant competing directly with PepsiCo. This is an accurate and
concise presentation of the strategic challenge facing Coca-Cola. The magic
quadrant clearly identifies the short-term requirement to compete with PepsiCo's
diversification strategy and the long term need to create a leadership position in
product innovation.
Coca-Cola and its key competitors financial analysis is outlined in Table
2.1. From the financial analysis it is clearly evident that low cost strategy is not a
good strategy to compete in the soft drink industry. The focus strategy adopted
by Cadbury seems to be better than low cost strategy. However, the
differentiation strategy seems to be the clear winner in the soft drink industry.
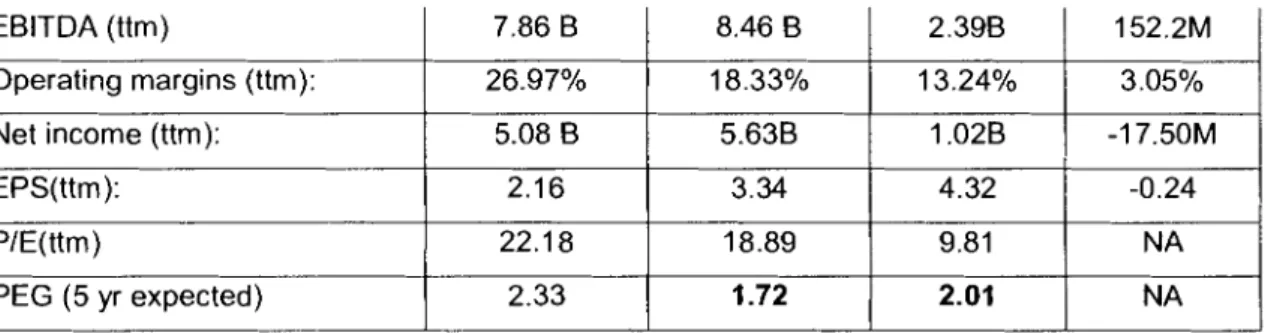
Based on the identified key success factors, Table 2.1 and magic
Table 2-1 Financial analysis of Coca-Cola and its key competitors
l ~ a r k e t Cap
1
111.2B1
103.46B ( 21.99B1
1.04B Companies Sym bol Coca-Cola KO I I I I Employeesl~uarterly Revenue ~rowth(yoy):l 6.90%
I I ! I PepsiCo PEP 2.80% Revenue (ttm) RevenueIEmployee (ttm): Gross Profit (ttm): 71,000 Cadbury CSG 7.80% 24.09 B $ 339,268.00 15.92B Cott COT 168,000 0.70% 35.14 B $ 209,149.00 19.38B 5858 1 31 63 14.35B $21 4,645.00 5.89B 1.77B $560,696.00 216.90M
I I I I
Operating margins (ttm):
I
Source: Figures from Yahoo Finance (2007)
Net income (ttm): EPS(ttm): PIE(ttm)
PEG (5 yr expected)
quadrant of current competitive performance, a basic matrix has been developed
26.97%
identifying each firm's capability to deliver against the key success factors.
18.33%
/
13.24%1
3.05%5.08 8
2.16 22.1 8
2.33
An estimated weighted score (See Table 2.2) has been assigned to each
firm's ability in the key success factors resulting in a final overall score. The
estimated capabilities were drawn from inputs from sample colleagues at Coca-
Cola. It is very clear from this analysis that differentiation strategy is the best
strategy for Coca-Cola and PepsiCo is also pursuing the same strategy.
5.63B 3.34 18.89
1.72
Table 2-2 Firm's capability to deliver against key success factors
1.02B
I
-17.50MKey Success factors
Product Innovation Size Quality Brand Image Price Global Expansion Distribution Healthy Choices (Differentiation) 4.32 9.81 2.01 -0.24 NA NA Company Strategy Weight 20% 20% 20% 10% 10% 10% 5% 5% (Maximum possible 10) Coca-Cola Differentiation 1.60 1.60 1.80 0.90 0.70 0.80 0.45 0.35 8.20 Cadbury Focus 1.50 2.00 1.40 0.70 0.80 0.70 0.40 0.40 7.90 PepsiCo Differentiation 1.80 1.60 1.60 0.80 0.70 0.70 0.45 0.40 8.05 Cott Price 1.25 1.75 1.40 0.60 0.90 0.60 0.35 0.35 7.20
However, the focus strategy of Cadbury is also very effective because it is
targeting a segment of market looking for a soft drink better than regular colas.
The introduction of Seven Up with no preservatives added is an example of
Cadbury's strategy to gain a significant increase in sales (14%) in Seven-Up
Brand products.
2.6
Opportunities and Threats
2.6.1 Expanding noncarbonated category
Noncarbonated beverages is a dynamic category growing at a very fast
pace. The Global noncarbonated drinks market grew by 7.5 percent in 2005. In
the first quarter of 2007, PepsiCo reported a volume growth of 8 percent in the
noncarbonated beverage sector. Coca-Cola reported a 7 percent increase in its
Powerade sport drink and a double digit increase in Minute Maid juice in the first
quarter of 2007. It is clear that Coca-Cola should strategically increase its market
share in fast-growing segments such as isotonic, enhanced or fortified drinks,
new age, energy and juice-based beverages. I will cover this topic more fully in
the recommendation discussion in Chapter 5.
2.6.2 Expanding bottled water market
Packaged or bottled water is one of the most dynamic segments of the
world's food and beverage market. This rise is due to consumption trends
favoring safety and health. The global bottled water sector grew by 8.5 percent in
growing market, with revenues of about $10 billion annually. Flavored water is
expected to represent a significant portion of the overall growth of the segment.
Nestle leads the global bottled water market with a market share of 32.5
percent. PepsiCo, with its Aquafina capturing 10 percent share is in second
position and Coca-Cola's Dasani brand water is the third best-selling bottled
water with 8.5 percent market share. Coca-Cola could leverage its strong
position in the bottled water segment to take advantage of growing demand for
bottled water.
2.6.3 Growth in emerging market
Russia, China and Brazil are key emerging markets for Coca-Cola.
Demand for food and beverages in these countries has increased rapidly in
recent years, driven primarily by the economic growth in these countries.
Although data are unavailable by country, the unit case volume increased by 11
percent in 2006 for North Asia, Eurasia and Middle East mainly due to growth in
China and Russia. Unit case volume increased by 7 percent in Latin America led
by Mexico and Brazil.
2.6.4 Strengthen brand image
The Coca-Cola Company uses high-profile sports events to promote its
brands. Coca-Cola has been chosen as one of the official sponsors of the 2008
Olympics Games in Beijing, China and 2010 Winter Olympics, in Vancouver,
Canada. Coca-Cola has the opportunity to use these two high-profile events to
2.6.5 Rising raw material prices
Rising sugar and packaging material prices have a direct impact on the
cost structure of Coca-Cola's products. With prices of key raw materials
increasing, the profitability of the company could come under pressure.
2.6.6 Threat to carbonated beverage category
Consumers have started to look for greater variety in their drinks. They
have also become more health conscious. This has led to a decrease in the
consumption of soda or carbonated beverages. For example, for the first time in
two decades, the number of cases of soda sold in the US dropped to 10.2 billion
cases (a 0.7% decline) in 2005. Specifically, the flagship brand Coca-Cola was
down 2 percent in volume in 2005.
In recent years, Coca-Cola has been criticized for the high amount of
sugar in its carbonated beverages, and has been blamed for contributing to
childhood obesity. Coca-Cola's revenues could be adversely affected by a
slowdown in the health-conscious carbonated beverages market.
2.6.7 Food Safety Issues
Food safety is going to be a key issue with evolving new products in the
soft drink industry. Recently class action lawsuits were filed in Massachusetts
and Florida last April 2006. The two lawsuits allege unsafe levels of benzene, a
chemical linked to cancer, in certain drinks from beverage manufacturers
Another lawsuit was filed in May 2006 against the company, this time
alleging that Coca-Cola products made in Mexico contained lead. The lawsuit
claims that elevated levels of lead have been detected in the paint used to
decorate the outside of glass Coca-Cola bottles, as well as in the beverage itself.
Recent negative publicity due to high levels of pesticide residue in the
carbonated beverages sold in India is another cause for concern. There is a
wide negative campaign against using Aspartame as an artificial sweetener in
diet drinks because of its health effects. All these food safety concerns could
further depress demand for carbonated drinks and adversely impact Coca-Cola's
bestseller.
2.6.8 Lack of innovation
Effective innovations, new product introduction, and the ability to respond
with agility to changing customer and consumer demands are essential. These
must be accomplished through the introduction of new products and formats that
are successfully planned and executed.
Coca-Cola has neglected product innovation over the last few years.
PepsiCo's better adaptation to consumer health trends recently saw it overtake
Coca-Cola in market value for the first time in 11 2 years. Innovation represents
the largest single opportunity to drive profitable growth.
Porter's five force model helped us to assess the fierce competitive
environment companies in the soft drink industry operate under and eventually
analysis also showed how the five forces interrelate to determine the
attractiveness of the soft drink industry.
The findings from the external analysis also helped us to identify
opportunities and threats. Now it is time to thoroughly evaluate Coca-Cola's
internal capabilities to compete. Chapter 3 mainly focuses on internal analysis to
CHAPTER 3: INTERNAL ANALYSIS: STRATEGIC FIT
ANALYSIS
In this chapter, I examine the concepts of firm capabilities and provide an
internal analysis of strengths and weaknesses at Coca-Cola. Developing
effective strategies requires Coca-Cola to understand how its strength and
weaknesses may differ from those of its competitors. These differences lay the
foundation on which Coca-Cola bases its strategy in the competitive
environment.
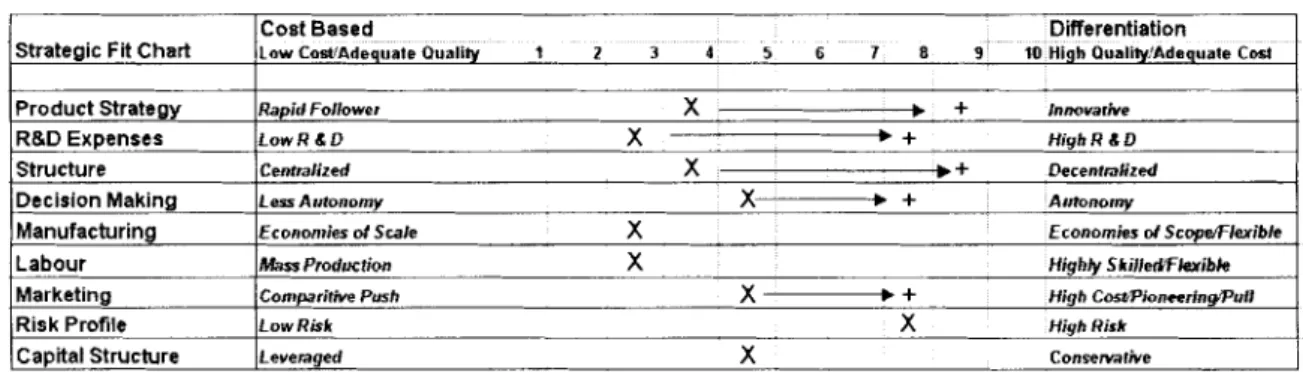
3.1 Strategic fit
The following figure summarizes Coca-Cola's alignment with two major
generic strategies; a cost based and differentiated strategy. The X indicates the
position where Coca-Cola is at present and + indicates the position where Coca-
Cola should be in future. The arrow indicates the gap between current and future
strategic positions.
Table 3-1 Strategy for Coca-Cola
Strategic Fit Chart
Cost Based Differentiation
L a w CoWAdequate Quality 1 2 3 4 5 6 7 8 9 10 High OualiWAdequate Cost
Product Strategy R&D Expenses Structure Decision Making Manufacturing Labour Market~ng Risk Profile Capital Structure I
Rapid Follower + . x Innovarive
L o w R & D x
.
+ HighR C DCentralized x .+ Decentralized
Less Autonomy -x + Autonomy
Econonfies d Scale x Economies d Scope!Flxibie
h k s Prodr~tion x Highly Skille&F&vibk
Conparitive Push + . x High CmuPioneerinyPuil
LOW Risk x Hiyh Risk
3.1 .I Current Strategy
To compete in the global beverage market, Coca-Cola uses a
differentiation strategy to create value for its customers and consumers. Coca-
Cola's mission statement reflects this: " To refresh the world. To inspire moments of optimism. To create value and make a difference" To accomplish this mission
Coca-Cola adopts the following strategic growth paths.
1. Grow Core Global Carbonated Soft Drink Brands
Coca-Cola is set to capture the full potential of Trademark Coca-Cola and
accelerate growth of core brands in each market through immediate consumption
opportunities to improve margin, consumer recruitment, and revenue.
2. Grow Other Core Brands.
This is the profitable noncarbonated market and includes coffee, energy
drinks and sports drinks.
3. Develop Transformational Wellness Platforms
Coca-Cola will enter this market with an initial focus on tea, juice, soy, and
enhanced hydration platforms.
4. Nurture System Health.
Coca-Cola is implementing a market-by-market focus on System health,
including bottler revenue growth, by balancing volume, price, mix, costs,
investments and share, concentrate pricing, cost effectiveness and route-to-
market efficiencies.
Coca-Cola should try to clearly understand what its customers want and
need. Understanding customers' expectations can help to target those likely to
value what Coca-Cola offers.
6. Create adjacent businesses.
Coca-Cola's initial priority here is the freshly brewed tea and coffee pilot
called Far Coast, which was launched in Toronto, Singapore and Olso. Other
opportunities include iCoke (a campaign run by Coca-Cola to promote its online
contests), retail concepts within retailers, and technology and ingredient
licensing.
The growth strategy looks very promising. However in reality Coca-Cola
seems to focus its effort more on the principle of saturating markets with cola. In
this era of new age beverages, Coca-Cola was slow to offer bottled water,
bypassed a chance to buy Gatorade and missed the chance to acquire the South
Beach Beverage Company, the maker of SoBe. As a result, PepsiCo now owns
Gatorade and SoBe.
3.1.2 Product Strategy
Coca-Cola practices a high degree of product adaptation and modification
across every market it serves. Rapid product testing, and adaptation are the
hallmark of Coca-Cola's product strategy. Product testing and development are
performed in each individual market, since market research for one country or
region is unlikely to show trends that are identical to other markets. Against a