U.S. Department of Justice
Executive Office for Immigration Review
FY 2013
Statistics Yearbook
Prepared by the Office of Planning, Analysis, & Technology
April 2014
Contact Information
Office of Legislative and Public Affairs 5107 Leesburg Pike, Suite 1902
Falls Church, VA 20530 (703) 305-0289 (703) 605-0365 (fax)
DISCLAIMER
The Statistics Yearbook has been prepared as a public service by the Executive Office for Immigration Review and is strictly informational in nature. In no way should any information in the Yearbook, in whole or in part, be regarded as legal advice or authority, or be understood in any way to enlarge upon, or otherwise modify or interpret, any existing legal authority, including, but not limited to, the Immigration and Nationality Act and Title 8 of the Code of Federal Regulations.
U.S. Department of Justice
Executive Office for Immigration Review
5107 Leesburg Pike, Suite 2600 Falls Church, Virginia 20530
To EOIR’s stakeholders:
Each year, the Executive Office for Immigration Review (EOIR) adjudicates hundreds of thousands of cases. These adjudications happen in our immigration courts nationwide, at the Board of Immigration Appeals, and before the Office of the Chief Administrative Hearing Officer. The annual reporting of EOIR’s statistics presents information on our case receipts and completions and looks at the characteristics of the cases before each adjudicative part of the agency.
In September 2011, I convened a Data Working Group to assess how EOIR collects, tracks and disseminates data. In October 2012, the Department of Justice, Office of the Inspector General released a report consistent with EOIR’s plans for an overhaul of our statistical
methodology. Overall, we determined that we needed to expand the way in which we evaluate our workload so that the public could more easily receive comprehensible answers to their statistics questions. As such, we have developed a new methodology, which will be used for all future external statistical reports, and on which this Fiscal Year 2013 Statistics Yearbook is based.
In the Fiscal Year 2013 report, you will notice several changes. We have rearranged some of the tabs to create a better flow of information, and the Table of Contents reflects those changes. For those of you who are familiar with our Yearbook, the numbers you see in some of the tabs will look different than what you may be used to seeing. For example, in an effort to clarify the agency’s workload, EOIR has changed the methodology for counting matters received and matters completed, which will affect the appearance of those numbers in the Statistics Yearbook.
I hope that the Statistics Yearbook continues to be a valuable tool to those using it, and we encourage you to share the Statistics Yearbook with anyone who may benefit from the information it contains. We welcome your questions and feedback and thank you for your continued support of EOIR’s efforts to improve our reporting to our stakeholders.
Juan P. Osuna Director
i
FY 2013 STATISTICS YEARBOOK TABLE OF CONTENTS
Tab Immigration Courts:
Total Matters Received and Completed A
Cases Received and Completed by Type B
Case Completions by Disposition C
Initial Case Completions by Country of Nationality D
Initial Case Completions by Language E
Initial Case Completions by Representation Status F
Initial Case Completions for Detained Cases G
Institutional Hearing Program Cases Received and Completed H
Initial Case Completions with Applications for Relief I
Asylum Cases Received and Completed J
Asylum Cases Completed by Disposition K
Asylum Grants by Country of Nationality L
Convention Against Torture M
Applications for Relief other than Asylum N
Voluntary Departure O
In Absentia Orders P
Board of Immigration Appeals:
Total Cases Received and Completed Q
Cases Received and Completed by Type R
Appeals from Immigration Judge Decisions Completed by Country of Nationality S Appeals from Immigration Judge Decisions Completed by Representation Status T Case Appeals from Immigration Judge Decisions Completed for Detained Cases U Immigration Courts and Board of Immigration Appeals:
Immigration Judge Decisions (Initial Case) Appealed V
Pending Caseload W
Office of the Chief Administrative Hearing Officer:
Total Cases Received and Completed X
ii
FY 2013 STATISTICS YEARBOOK LIST OF FIGURES AND TABLES
Page List of Figures:
Figure 1 - Total Immigration Court Matters Received and Completed A2
Figure 2 - Immigration Court Matters Received by Type A7
Figure 3 - Immigration Court Matters Completed by Type A8
Figure 4 - Immigration Judge Initial Case Completions by Completion Type C1 Figure 4A - Immigration Judge Subsequent Case Completions by Completion Type C1 Figure 5 - Immigration Judge Decisions by Disposition - Initial Case Completions C2 Figure 5A - Immigration Judge Decisions by Disposition - Subsequent Case Completions C3 Figure 6 - Other Completions by Disposition - Initial Case Completions C4 Figure 6A - Other Completions by Disposition - Subsequent Case Completions C5
Figure 7 - Changes of Venue and Transfers C6
Figure 8 - FY 2013 Initial Case Completions by Country of Nationality D1
Figure 9 - FY 2013 Initial Case Completions by Language E1
Figure 10 - Initial Case Completions: Percentage of Represented Cases F1 Figure 11 - Immigration Court Initial Case Completions: Detained and Total G1
Figure 12 - IHP Cases Received and Completed H1
Figure 13 - Immigration Court Initial Case Completions Percent with Applications I1 Figure 14 - Immigration Court Asylum Receipts: Affirmative and Defensive J1
Figure 15 - Asylum Cases: Receipts and Completions J2
Figure 16 - Immigration Court: Asylum Grant Rate K1
Figure 17 - Immigration Court: Affirmative Grant Rate K3
Figure 18 - Immigration Court: Defensive Grant Rate K3
Figure 19 - Asylum Completions by Disposition K4
Figure 20 - Immigration Court: Withholding of Removal Grant Rate K5 Figure 21 - Immigration Court: Asylum or Withholding of Removal Grant Rate K6
Figure 22 - FY 2013 Asylum Grants by Country of Nationality L1
Figure 23 -In Absentia Rates - Initial Case Completions P1
Figure 24 -In Absentia Rates for Never Detained Aliens - Initial Case Completions P2 Figure 25 -In Absentia Rates for Released Aliens - Initial Case Completions P3 Figure 26 -In Absentia Rates for Non-Detained Aliens - Initial Case Completions P4
Figure 27 - Total BIA Cases Received and Completed Q1
Figure 28 - BIA Receipts by Case Type Q2
Figure 29 - BIA Completions by Case Type Q2
Figure 30 - FY 2013 Appeals from IJ Decisions Completed by Country of Nationality S1 Figure 31 - Appeals from IJ Decisions: Percentage of Represented Cases T1 Figure 32 - Case Appeals from IJ Decisions: Detained and Total U1 Figure 33 - Immigration Judge Decisions (Initial Case) Appealed V1 Figure 34 - Immigration Court Pending Cases by Fiscal Year End W1
Figure 35 - BIA Pending Cases by Fiscal Year End W3
iii
FY 2013 STATISTICS YEARBOOK LIST OF FIGURES AND TABLES
Page List of Tables:
Table 1 - Total Immigration Court Matters Received by Court for FY 2012 and FY 2013 A3 Table 1A - Total Immigration Court Receipts by Court and Type of Matter for FY 2013 A4 Table 2 - Total Immigration Court Matters Completed by Court for FY 2012 and FY 2013 A5 Table 2A - Total Immigration Court Matters Completed by Court and Type of Matter for FY 2013 A6
Table 3 - Immigration Court Cases Received by Case Type B1
Table 4 - Immigration Court Initial Case Completions by Case Type B2 Table 4A - Immigration Court Subsequent Case Completions by Case Type B2
Table 5 - FY 2013 Changes of Venue and Transfers C7
Table 6 - Initial Case Completions by Country of Nationality: Top 25
Nationalities for FY 2009 - FY 2013 D2
Table 7 - Initial Case Completions by Language: Top 25
Languages for FY 2009 - FY 2013 E2
Table 8 - FY 2013 Immigration Court Initial Case Completions for Detained Cases G3
Table 9 - IHP Initial Case Completions by Disposition H2
Table 10 - FY 2013 Immigration Court Initial Case Completions with Applications for Relief I2
Table 11 - Asylum Completions by Court for FY 2013 J3
Table 12 - FY 2013 Asylum Grant Rate by Immigration Court K2
Table 13 - Asylum Grants By Country of Nationality: Top 25 Nationalities for
FY 2009 - FY 2013 L2
Table 14 - FY 2013 Convention Against Torture Cases by Disposition M1 Table 15 - FY 2013 Convention Against Torture Completions by Court M2
Table 16 - Grants of Relief N1
Table 17 - Initial Case Completions: IJ Removal Decisions Compared to Voluntary
Departure Decisions O1
Table 18 - BIA Receipts by Type R2
Table 19 - BIA Completions by Type R2
Table 20 - Appeals from IJ Decisions Completed by Country of Nationality: Top 25
Nationalities for FY 2009 - FY 2013 S2
Table 21 - Breakdown of BIA Completions of Detained Case Appeals from IJ Decisions U2
Executive Office for Immigration Review Office of Planning, Analysis, and Technology
FY 2013 Statistics Yearbook A1 April 2014
Immigration Courts:
Total Matters Received and Completed
When the Department of Homeland Security (DHS) charges an alien with a violation of immigration law by issuing a charging document, typically either a Notice to Appear (NTA) or a Notice of Referral to Immigration Judge, the Executive Office for Immigration Review (EOIR) obtains jurisdiction over the case. EOIR has oversight over the immigration courts nationwide, and the Board of Immigration Appeals, which has appellate review over immigration judge decisions. Once EOIR has either ordered an alien removed, or granted relief or protection from removal, DHS is responsible for effectuating that alien’s physical removal or providing that alien evidence of their immigration status, which permits the alien to remain in the United States.
In immigration court, aliens appear before an immigration judge and either
contest or concede the charges against them. In some instances, the immigration judge adjourns the case and sets a continuance date. The alien may file an application for relief or protection and, after hearing the merits of the case, the immigration judge renders a decision, either ordering the alien removed, or granting relief or protection from removal. If the immigration judge decides that DHS has not established
removability, the immigration judge may terminate the case.
Immigration judges also consider matters such as bonds and motions.
An immigration judge holds bond redetermination hearings when an alien in custody seeks release on their own recognizance, or seeks a reduction in the amount of bond previously set by DHS. In its data, EOIR does not include bond redetermination hearings that occur before EOIR receives the charging document from DHS.
Either the alien or DHS may request by motion that a case an immigration judge previously heard be reopened, reconsidered, or recalendared.
For the purposes of this Yearbook, the term “immigration court matters” includes cases (deportation, exclusion, removal, credible fear review, reasonable fear review, claimed status review, asylum only, rescission, continued detention review, Nicaraguan Adjustment and Central American Relief Act, and withholding only); bond
redeterminations; and motions to reopen, reconsider, or recalendar. Immigration court receipts are defined as the total number of charging documents; bond redeterminations; and motions to reopen, reconsider, or recalendar that the immigration courts received during the reporting period. Immigration court completions include immigration judge decisions and other completions (such as administrative closings) on cases, bond redeterminations, and motions that immigration judges did not grant.
Executive Office for Immigration Review Office of Planning, Analysis, and Technology
FY 2013 Statistics Yearbook A2 April 2014
Figure 1 250,000 270,000 290,000 310,000 330,000 350,000 FY 09 FY 10 FY 11 FY 12 FY 13
Total Immigration Court Matters Received and Completed
Receipts Completions
As shown in Figure 1, the number of matters the immigration courts received decreased by 17 percent between Fiscal Year (FY) 2009 and FY 2013. The number of matters the immigration courts completed decreased by 15 percent from FY 2009 to FY 2013.
While some courts showed increases in receipts over FY 2012 levels, others showed decreases in receipts. In Table 1, courts with increases in receipts of 25
percent or more are highlighted inblueand courts with decreases of 25 percent or more are highlighted inred. The immigration court in Harlingen, TX, showed the largest (60 percent) increase in receipts. The immigration court in Tucson, AZ, showed the largest (58 percent) decrease. Table 1A (page A4) identifies receipts for FY 2013 by type of matter.
Table 2 (page A5) provides a comparison of FY 2012 and FY 2013 completions by immigration court. Courts with increases in completions of 25 percent or more are highlighted inblue, and those with decreases of 25 percent or more are highlighted in red. El Paso, TX, showed the largest (42 percent) increase in completions. Tucson, AZ, showed the largest (52 percent) decrease. Table 2A (page A6) identifies
completions for FY 2013 by type of matter.
Total Immigration Court Matters Receipts Completions FY 09 328,619 298,025 FY 10 323,211 291,255 FY 11 338,471 309,151 FY 12 311,984 289,857 FY 13 271,279 253,942
Executive Office for Immigration Review Office of Planning, Analysis, and Technology
FY 2013 Statistics Yearbook A3 April 2014
Table 1 - Total Immigration Court Matters Received by Court for FY 2012 and FY 2013
Immigration Court FY 2012 FY 2013 Rate of Change
ADELANTO, CALIFORNIA 13,406 7,386 -45%
ARLINGTON, VIRGINIA 7,048 7,172 2%
ATLANTA, GEORGIA 6,284 4,368 -30%
BALTIMORE, MARYLAND 3,549 2,819 -21%
BATAVIA SERVICE PROCESSING CENTER (SPC), NEW YORK 2,252 1,418 -37%
BLOOMINGTON (ST. PAUL), MINNESOTA 4,048 3,058 -24%
BOSTON, MASSACHUSETTS 7,424 5,447 -27%
BUFFALO, NEW YORK 1,349 999 -26%
CHARLOTTE, NORTH CAROLINA 3,889 2,940 -24%
CHICAGO, ILLINOIS 13,622 11,498 -16%
CLEVELAND, OHIO 4,216 3,007 -29%
DALLAS, TEXAS 8,188 5,555 -32%
DENVER, COLORADO 6,959 5,118 -26%
DETROIT, MICHIGAN 4,088 3,495 -15%
EAST MESA, CALIFORNIA 2,540 2,288 -10%
EL CENTRO SPC, CALIFORNIA 1,337 1,179 -12%
EL PASO SPC, TEXAS 3,523 4,682 33%
EL PASO, TEXAS 6,004 3,365 -44%
ELIZABETH DETENTION CENTER, NEW JERSEY 4,670 3,438 -26%
ELOY, ARIZONA 9,448 8,117 -14%
FISHKILL - NEW YORK STATE DOC, NEW YORK 238 200 -16%
FLORENCE SPC, ARIZONA 7,191 6,368 -11%
GUAYNABO (SAN JUAN), PUERTO RICO 674 629 -7%
HARLINGEN, TEXAS 5,852 9,350 60% HARTFORD, CONNECTICUT 1,054 1,017 -4% HONOLULU, HAWAII 663 428 -35% HOUSTON SPC, TEXAS 14,055 12,438 -12% HOUSTON, TEXAS 3,542 5,369 52% IMPERIAL, CALIFORNIA 443 290 -35%
KANSAS CITY, MISSOURI 3,877 2,336 -40%
KROME NORTH SPC, FLORIDA 11,478 9,417 -18%
LAS VEGAS, NEVADA 2,773 2,134 -23%
LOS ANGELES, CALIFORNIA 19,735 18,564 -6%
LOS FRESNOS (PORT ISABEL SPC), TEXAS 7,028 7,189 2%
MEMPHIS, TENNESSEE 2,074 1,670 -19%
MIAMI, FLORIDA 6,221 6,944 12%
NEW ORLEANS, LOUISIANA 887 538 -39%
NEW YORK CITY, NEW YORK 14,374 14,389 0%
NEWARK, NEW JERSEY 6,185 4,973 -20%
OAKDALE FEDERAL DETENTION CENTER, LOUISIANA 10,858 8,804 -19%
OMAHA, NEBRASKA 4,516 2,547 -44% ORLANDO, FLORIDA 2,974 3,274 10% PEARSALL, TEXAS 7,674 7,944 4% PHILADELPHIA, PENNSYLVANIA 1,491 1,325 -11% PHOENIX, ARIZONA 3,483 4,518 30% PORTLAND, OREGON 827 850 3%
SAIPAN, NORTHERN MARIANA ISLANDS 136 99 -27%
SALT LAKE CITY, UTAH 2,007 1,299 -35%
SAN ANTONIO, TEXAS 8,197 10,007 22%
SAN DIEGO, CALIFORNIA 2,683 2,427 -10%
SAN FRANCISCO, CALIFORNIA 9,363 10,558 13%
SEATTLE, WASHINGTON 1,280 1,374 7%
STEWART DETENTION FACILITY, GEORGIA 11,200 8,225 -27%
TACOMA, WASHINGTON 9,372 7,115 -24%
TUCSON, ARIZONA 1,694 710 -58%
ULSTER - NEW YORK STATE DOC, NEW YORK 419 320 -24%
VARICK SPC, NEW YORK 3,626 2,841 -22%
YORK, PENNSYLVANIA 7,996 5,450 -32%
Executive Office for Immigration Review Office of Planning, Analysis, and Technology
FY 2013 Statistics Yearbook A4 April 2014
Table 1A - Total Immigration Court Receipts by Court and Type of Matter for FY 2013
Immigration Court New NTAs Bonds Motions Total Matters
ADELANTO, CALIFORNIA 3,229 4,094 63 7,386
ARLINGTON, VIRGINIA 5,467 963 742 7,172
ATLANTA, GEORGIA 3,175 737 456 4,368
BALTIMORE, MARYLAND 1,844 494 481 2,819
BATAVIA SERVICE PROCESSING CENTER (SPC), NEW YORK 727 663 28 1,418
BLOOMINGTON (ST. PAUL), MINNESOTA 2,181 532 345 3,058
BOSTON, MASSACHUSETTS 3,076 1,482 889 5,447
BUFFALO, NEW YORK 820 27 152 999
CHARLOTTE, NORTH CAROLINA 2,127 554 259 2,940
CHICAGO, ILLINOIS 8,674 2,100 724 11,498
CLEVELAND, OHIO 2,092 729 186 3,007
DALLAS, TEXAS 4,532 632 391 5,555
DENVER, COLORADO 3,196 1,510 412 5,118
DETROIT, MICHIGAN 2,245 1,070 180 3,495
EAST MESA, CALIFORNIA 1,553 673 62 2,288
EL CENTRO SPC, CALIFORNIA 702 446 31 1,179
EL PASO SPC, TEXAS 3,408 1,223 51 4,682
EL PASO, TEXAS 2,766 416 183 3,365
ELIZABETH DETENTION CENTER, NEW JERSEY 2,088 1,300 50 3,438
ELOY, ARIZONA 5,734 2,334 49 8,117
FISHKILL - NEW YORK STATE DOC, NEW YORK 187 0 13 200
FLORENCE SPC, ARIZONA 4,772 1,544 52 6,368
GUAYNABO (SAN JUAN), PUERTO RICO 472 49 108 629
HARLINGEN, TEXAS 8,556 3 791 9,350 HARTFORD, CONNECTICUT 814 78 125 1,017 HONOLULU, HAWAII 238 124 66 428 HOUSTON SPC, TEXAS 8,582 3,586 270 12,438 HOUSTON, TEXAS 4,899 0 470 5,369 IMPERIAL, CALIFORNIA 263 0 27 290
KANSAS CITY, MISSOURI 1,553 579 204 2,336
KROME NORTH SPC, FLORIDA 5,259 3,894 264 9,417
LAS VEGAS, NEVADA 1,641 308 185 2,134
LOS ANGELES, CALIFORNIA 12,796 3,336 2,432 18,564
LOS FRESNOS (PORT ISABEL SPC), TEXAS 4,406 2,732 51 7,189
MEMPHIS, TENNESSEE 1,461 7 202 1,670
MIAMI, FLORIDA 5,495 0 1,449 6,944
NEW ORLEANS, LOUISIANA 434 3 101 538
NEW YORK CITY, NEW YORK 12,065 0 2,324 14,389
NEWARK, NEW JERSEY 2,966 1,292 715 4,973
OAKDALE FEDERAL DETENTION CENTER, LOUISIANA 5,556 3,186 62 8,804
OMAHA, NEBRASKA 1,576 716 255 2,547 ORLANDO, FLORIDA 2,343 340 591 3,274 PEARSALL, TEXAS 5,043 2,874 27 7,944 PHILADELPHIA, PENNSYLVANIA 1,039 0 286 1,325 PHOENIX, ARIZONA 4,228 0 290 4,518 PORTLAND, OREGON 673 12 165 850
SAIPAN, NORTHERN MARIANA ISLANDS 81 2 16 99
SALT LAKE CITY, UTAH 1,077 137 85 1,299
SAN ANTONIO, TEXAS 8,458 650 899 10,007
SAN DIEGO, CALIFORNIA 1,924 35 468 2,427
SAN FRANCISCO, CALIFORNIA 8,083 1,680 795 10,558
SEATTLE, WASHINGTON 1,146 0 228 1,374
STEWART DETENTION FACILITY, GEORGIA 6,044 2,128 53 8,225
TACOMA, WASHINGTON 3,671 3,366 78 7,115
TUCSON, ARIZONA 673 0 37 710
ULSTER - NEW YORK STATE DOC, NEW YORK 299 1 20 320
VARICK SPC, NEW YORK 1,402 1,325 114 2,841
YORK, PENNSYLVANIA 3,539 1,733 178 5,450
Executive Office for Immigration Review Office of Planning, Analysis, and Technology
FY 2013 Statistics Yearbook A5 April 2014
Table 2 - Total Immigration Court Matters Completed by Court for FY 2012 and FY 2013
Immigration Court FY 2012 FY 2013 Rate of Change
ADELANTO, CALIFORNIA 11,169 6,404 -43%
ARLINGTON, VIRGINIA 6,751 6,522 -3%
ATLANTA, GEORGIA 5,453 4,738 -13%
BALTIMORE, MARYLAND 5,056 4,667 -8%
BATAVIA SERVICE PROCESSING CENTER (SPC), NEW YORK 2,016 1,177 -42%
BLOOMINGTON (ST. PAUL), MINNESOTA 3,848 3,503 -9%
BOSTON, MASSACHUSETTS 8,197 7,265 -11%
BUFFALO, NEW YORK 1,084 1,043 -4%
CHARLOTTE, NORTH CAROLINA 4,426 4,872 10%
CHICAGO, ILLINOIS 11,519 10,508 -9%
CLEVELAND, OHIO 3,893 3,020 -22%
DALLAS, TEXAS 7,907 7,715 -2%
DENVER, COLORADO 7,383 5,600 -24%
DETROIT, MICHIGAN 4,540 3,137 -31%
EAST MESA, CALIFORNIA 2,044 1,668 -18%
EL CENTRO SPC, CALIFORNIA 1,350 1,075 -20%
EL PASO SPC, TEXAS 2,513 3,566 42%
EL PASO, TEXAS 4,490 2,478 -45%
ELIZABETH DETENTION CENTER, NEW JERSEY 3,600 2,296 -36%
ELOY, ARIZONA 7,445 4,967 -33%
FISHKILL - NEW YORK STATE DOC, NEW YORK 233 208 -11%
FLORENCE SPC, ARIZONA 5,202 2,921 -44%
GUAYNABO (SAN JUAN), PUERTO RICO 961 688 -28%
HARLINGEN, TEXAS 3,152 2,491 -21% HARTFORD, CONNECTICUT 1,429 1,377 -4% HONOLULU, HAWAII 927 619 -33% HOUSTON SPC, TEXAS 11,272 9,539 -15% HOUSTON, TEXAS 2,959 2,869 -3% IMPERIAL, CALIFORNIA 352 246 -30%
KANSAS CITY, MISSOURI 4,133 3,022 -27%
KROME NORTH SPC, FLORIDA 9,621 7,496 -22%
LAS VEGAS, NEVADA 2,630 2,361 -10%
LOS ANGELES, CALIFORNIA 20,171 24,227 20%
LOS FRESNOS (PORT ISABEL SPC), TEXAS 5,483 4,068 -26%
MEMPHIS, TENNESSEE 2,340 2,718 16%
MIAMI, FLORIDA 7,786 7,883 1%
NEW ORLEANS, LOUISIANA 686 860 25%
NEW YORK CITY, NEW YORK 18,332 17,157 -6%
NEWARK, NEW JERSEY 6,556 5,611 -14%
OAKDALE FEDERAL DETENTION CENTER, LOUISIANA 9,823 6,826 -31%
OMAHA, NEBRASKA 3,938 3,160 -20% ORLANDO, FLORIDA 4,098 4,763 16% PEARSALL, TEXAS 5,295 4,785 -10% PHILADELPHIA, PENNSYLVANIA 2,375 2,228 -6% PHOENIX, ARIZONA 1,884 2,642 40% PORTLAND, OREGON 1,505 1,585 5%
SAIPAN, NORTHERN MARIANA ISLANDS 154 136 -12%
SALT LAKE CITY, UTAH 2,046 1,334 -35%
SAN ANTONIO, TEXAS 5,587 6,821 22%
SAN DIEGO, CALIFORNIA 2,500 3,293 32%
SAN FRANCISCO, CALIFORNIA 9,073 9,600 6%
SEATTLE, WASHINGTON 2,549 2,820 11%
STEWART DETENTION FACILITY, GEORGIA 10,461 8,170 -22%
TACOMA, WASHINGTON 7,077 5,561 -21%
TUCSON, ARIZONA 1,777 856 -52%
ULSTER - NEW YORK STATE DOC, NEW YORK 420 300 -29%
VARICK SPC, NEW YORK 3,375 2,616 -22%
YORK, PENNSYLVANIA 7,011 3,864 -45%
Executive Office for Immigration Review Office of Planning, Analysis, and Technology
FY 2013 Statistics Yearbook A6 April 2014
Table 2A - Total Immigration Court Matters Completed by Court and Type of Matter for FY 2013
Immigration Court Initial Case Completions Subsequent Case Completions Bonds Motions (Not Granted) Total Matters ADELANTO, CALIFORNIA 2,277 119 3,989 19 6,404 ARLINGTON, VIRGINIA 4,709 788 956 69 6,522 ATLANTA, GEORGIA 3,508 385 675 170 4,738 BALTIMORE, MARYLAND 3,420 673 484 90 4,667
BATAVIA SERVICE PROCESSING CENTER (SPC), NEW YORK 442 42 682 11 1,177
BLOOMINGTON (ST. PAUL), MINNESOTA 2,632 244 557 70 3,503
BOSTON, MASSACHUSETTS 4,636 1,016 1,495 118 7,265
BUFFALO, NEW YORK 834 130 35 44 1,043
CHARLOTTE, NORTH CAROLINA 3,906 340 551 75 4,872
CHICAGO, ILLINOIS 7,543 617 2,180 168 10,508
CLEVELAND, OHIO 2,005 210 761 44 3,020
DALLAS, TEXAS 6,535 371 656 153 7,715
DENVER, COLORADO 3,592 419 1,532 57 5,600
DETROIT, MICHIGAN 1,833 157 1,070 77 3,137
EAST MESA, CALIFORNIA 926 53 666 23 1,668
EL CENTRO SPC, CALIFORNIA 582 53 423 17 1,075
EL PASO SPC, TEXAS 2,356 48 1,147 15 3,566
EL PASO, TEXAS 1,916 96 418 48 2,478
ELIZABETH DETENTION CENTER, NEW JERSEY 929 49 1,296 22 2,296
ELOY, ARIZONA 2,579 65 2,295 28 4,967
FISHKILL - NEW YORK STATE DOC, NEW YORK 195 9 0 4 208
FLORENCE SPC, ARIZONA 1,407 63 1,434 17 2,921
GUAYNABO (SAN JUAN), PUERTO RICO 532 84 50 22 688
HARLINGEN, TEXAS 1,825 219 2 445 2,491 HARTFORD, CONNECTICUT 1,107 140 79 51 1,377 HONOLULU, HAWAII 390 97 124 8 619 HOUSTON SPC, TEXAS 5,806 209 3,496 28 9,539 HOUSTON, TEXAS 2,452 271 0 146 2,869 IMPERIAL, CALIFORNIA 226 14 0 6 246
KANSAS CITY, MISSOURI 2,191 175 597 59 3,022
KROME NORTH SPC, FLORIDA 3,238 214 3,961 83 7,496
LAS VEGAS, NEVADA 1,806 212 302 41 2,361
LOS ANGELES, CALIFORNIA 17,830 2,713 3,233 451 24,227
LOS FRESNOS (PORT ISABEL SPC), TEXAS 1,411 32 2,599 26 4,068
MEMPHIS, TENNESSEE 2,406 234 5 73 2,718
MIAMI, FLORIDA 6,523 1,042 0 318 7,883
NEW ORLEANS, LOUISIANA 761 72 3 24 860
NEW YORK CITY, NEW YORK 14,159 2,640 0 358 17,157
NEWARK, NEW JERSEY 3,564 636 1,269 142 5,611
OAKDALE FEDERAL DETENTION CENTER, LOUISIANA 3,553 79 3,169 25 6,826
OMAHA, NEBRASKA 2,115 267 729 49 3,160 ORLANDO, FLORIDA 3,694 590 331 148 4,763 PEARSALL, TEXAS 1,896 46 2,837 6 4,785 PHILADELPHIA, PENNSYLVANIA 1,823 366 0 39 2,228 PHOENIX, ARIZONA 2,394 207 1 40 2,642 PORTLAND, OREGON 1,402 149 12 22 1,585
SAIPAN, NORTHERN MARIANA ISLANDS 111 19 2 4 136
SALT LAKE CITY, UTAH 1,104 83 127 20 1,334
SAN ANTONIO, TEXAS 5,649 245 608 319 6,821
SAN DIEGO, CALIFORNIA 2,761 332 35 165 3,293
SAN FRANCISCO, CALIFORNIA 6,985 897 1,627 91 9,600
SEATTLE, WASHINGTON 2,500 278 0 42 2,820
STEWART DETENTION FACILITY, GEORGIA 5,919 96 2,130 25 8,170
TACOMA, WASHINGTON 2,050 99 3,398 14 5,561
TUCSON, ARIZONA 816 31 0 9 856
ULSTER - NEW YORK STATE DOC, NEW YORK 264 27 1 8 300
VARICK SPC, NEW YORK 1,088 114 1,383 31 2,616
YORK, PENNSYLVANIA 1,905 171 1,720 68 3,864
Executive Office for Immigration Review Office of Planning, Analysis, and Technology
FY 2013 Statistics Yearbook A7 April 2014
Figure 2 provides information on the type of matters the immigration courts receive. Cases (new NTAs) formulate the bulk of the courts’ work; the courts also process significant numbers of bonds and motions to reopen, reconsider, and recalendar.
Figure 2
Immigration Court Matters Received New
NTAs Bonds Motions Total FY 09 256,378 51,584 20,657 328,619 FY 10 248,815 52,623 21,773 323,211 FY 11 240,258 76,796 21,417 338,471 FY 12 214,262 78,004 19,718 311,984 FY 13 193,350 57,699 20,230 271,279
Executive Office for Immigration Review Office of Planning, Analysis, and Technology
FY 2013 Statistics Yearbook A8 April 2014
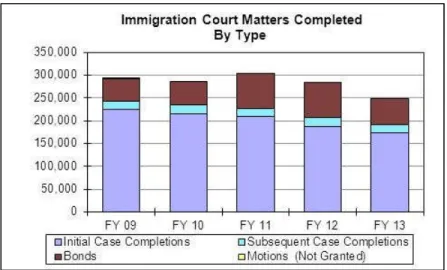
Figure 3 provides information on the type of matters the immigration courts completed. Figure 3 Initial Case Completions Subsequent Case Completions Bonds Motions (Not Granted) Total FY 09 224,577 17,493 50,645 5,310 298,025 FY 10 215,293 18,886 51,625 5,451 291,255 FY 11 209,282 18,732 75,508 5,629 309,151 FY 12 188,230 18,393 77,849 5,385 289,857 FY 13 173,018 19,047 57,132 4,745 253,942
Executive Office for Immigration Review Office of Planning, Analysis, and Technology
FY 2013 Statistics Yearbook April 2014
B1
Immigration Courts:
Cases Received and Completed by Type
Until April 1, 1997, the two major types of cases adjudicated by immigration courts were exclusion and deportation cases. Individuals who the former Immigration and Naturalization Service (INS) charged as excludable were placed in exclusion
proceedings. Exclusion cases generally involved a person who tried to enter the United States, but was stopped at the point of entry because INS found the person to be
inadmissible. Deportation cases usually arose when INS alleged that an alien had entered the country illegally, or had entered legally, but then violated one or more conditions of their visa.
Provisions of the Illegal Immigration Reform and Immigrant Responsibility Act of 1996 established five new types of cases: removal, credible fear review, reasonable fear review, claimed status review, and asylum only. Additional types of cases include: rescission, continued detention review, Nicaraguan Adjustment and Central American Relief Act (NACARA), and withholding only.
Table 3 shows all types of cases that the immigration courts received between Fiscal Year (FY) 2009 and FY 2013.
Table 3 - Immigration Court Cases Received by Case Type
Type of Case FY 2009 FY 2010 FY 2011 FY 2012 FY 2013
Deportation 68 77 76 5 1
Exclusion 9 13 4 1 0
Removal 254,460 246,214 237,478 211,193 187,677
Credible Fear Review 861 1,144 885 739 1,768
Reasonable Fear Review 229 387 441 815 1,162
Claimed Status 41 47 26 37 31
Asylum Only 404 383 407 355 394
Rescission 46 48 49 25 46
Continued Detention Review 1 1 5 2 0
NACARA 19 4 1 0 2
Withholding Only 240 497 886 1,090 2,269
Executive Office for Immigration Review Office of Planning, Analysis, and Technology
FY 2013 Statistics Yearbook April 2014
B2
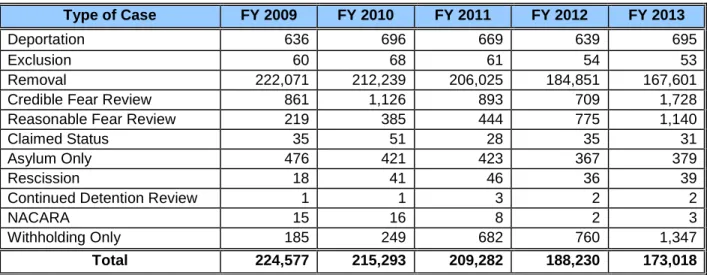
Table 4 shows all types of the immigration courts’ initial case completions for the period FY 2009 to FY 2013. Note that initial case completions reflect immigration judge decisions and other completions. As shown in Tab C, other completions accounted for 17 percent of the cases completed in FY 2013.
Table 4 - Immigration Court Initial Case Completions by Case Type
Type of Case FY 2009 FY 2010 FY 2011 FY 2012 FY 2013
Deportation 636 696 669 639 695
Exclusion 60 68 61 54 53
Removal 222,071 212,239 206,025 184,851 167,601
Credible Fear Review 861 1,126 893 709 1,728
Reasonable Fear Review 219 385 444 775 1,140
Claimed Status 35 51 28 35 31
Asylum Only 476 421 423 367 379
Rescission 18 41 46 36 39
Continued Detention Review 1 1 3 2 2
NACARA 15 16 8 2 3
Withholding Only 185 249 682 760 1,347
Total 224,577 215,293 209,282 188,230 173,018
Table 4A shows all types of the immigration courts’ subsequent case completions for the period FY 2009 to FY 2013.
Table 4A - Immigration Court Subsequent Case Completions by Case Type
Type of Case FY 2009 FY 2010 FY 2011 FY 2012 FY 2013
Deportation 2,024 1,990 1,972 1,666 1,829
Exclusion 226 226 204 149 174
Removal 15,136 16,567 16,424 16,449 16,911
Credible Fear Review 0 0 0 0 0
Reasonable Fear Review 1 0 0 0 0
Claimed Status 0 0 2 0 1
Asylum Only 80 85 94 68 74
Rescission 1 4 4 2 3
Continued Detention Review 0 0 0 0 0
NACARA 2 0 2 0 5
Withholding Only 23 14 30 59 50
Executive Office for Immigration Review Office of Planning, Analysis, and Technology
FY 2013 Statistics Yearbook April 2014
C1
Immigration Courts:
Case Completions by Disposition
After a hearing, the immigration judge either renders an oral decision or reserves the decision and issues a decision at a later date. In rendering a decision, the
immigration judge may order the alien removed from the United States, grant some form of relief, or terminate the case. In addition to decisions, there are other possible case outcomes which are reported here as other completions.
Figure 4 and Figure 4A provide a breakdown of initial case completions and subsequent case completions from Fiscal Year (FY) 2009 to FY 2013 by type of completion – either through an immigration judge decision or through another type of completion.
Figure 4
Figure 4A
Immigration Judge Initial Case Completions by Completion Type
Decisions Other Completions Total FY 09 216,308 8,269 224,577 FY 10 206,158 9,135 215,293 FY 11 202,708 6,574 209,282 FY 12 171,501 16,729 188,230 FY 13 143,678 29,340 173,018
Immigration Judge Subsequent Case Completions by Completion Type
Decisions Other Completions Total FY 09 16,122 1,371 17,493 FY 10 17,363 1,523 18,886 FY 11 17,553 1,179 18,732 FY 12 15,889 2,504 18,393 FY 13 14,853 4,194 19,047
Executive Office for Immigration Review Office of Planning, Analysis, and Technology
FY 2013 Statistics Yearbook April 2014
C2
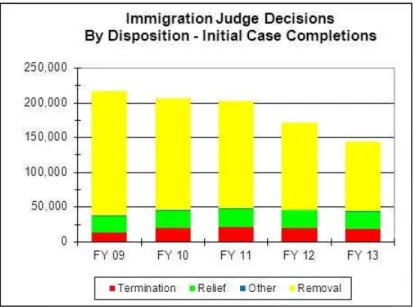
Figure 5 provides a breakout of decisions by disposition for the initial case
completions for FY 2009 to FY 2013. Immigration judges first decide whether or not the charges against an alien should be sustained. If the charges are not sustained or if the alien has established eligibility for naturalization, the judge terminates the case. If the charges are sustained, the judge decides whether to order the alien removed from the United States or to grant relief. In some cases, the immigration judge may permit the alien to depart the United States voluntarily. Orders of voluntary departure are counted as removals.
Figure 5
Number % of Total Number % of Total Number % of Total Number % of Total
FY 09 13,937 6.4 23,251 10.7 178,270 82.4 850 0.4 216,308 FY 10 19,776 9.6 25,155 12.2 160,295 77.8 932 0.5 206,158 FY 11 20,516 10.1 26,459 13.1 154,762 76.3 971 0.5 202,708 FY 12 19,682 11.5 25,824 15.1 125,239 73.0 756 0.4 171,501 FY 13 19,107 13.3 24,006 16.7 99,611 69.3 954 0.7 143,678 Other Removal Relief Termination
IJ Decisions by Disposition - Initial Case Com pletions
Executive Office for Immigration Review Office of Planning, Analysis, and Technology
FY 2013 Statistics Yearbook April 2014
C3
Figure 5A provides a breakout of decisions by disposition for the subsequent case completions for FY 2009 to FY 2013.
Figure 5A
Number % of Total Number % of Total Number % of Total Number % of Total
FY 09 3,101 19.2 5,433 33.7 7,156 44.4 432 2.7 16,122 FY 10 4,592 26.4 5,800 33.4 6,574 37.9 397 2.3 17,363 FY 11 5,087 29.0 5,358 30.5 6,736 38.4 372 2.1 17,553 FY 12 5,306 33.4 4,395 27.7 5,897 37.1 291 1.8 15,889 FY 13 5,346 36.0 3,816 25.7 5,453 36.7 238 1.6 14,853 Other Removal Relief Termination
IJ Decisions by Disposition - Subsequent Case Com pletions
Executive Office for Immigration Review Office of Planning, Analysis, and Technology
FY 2013 Statistics Yearbook April 2014
C4
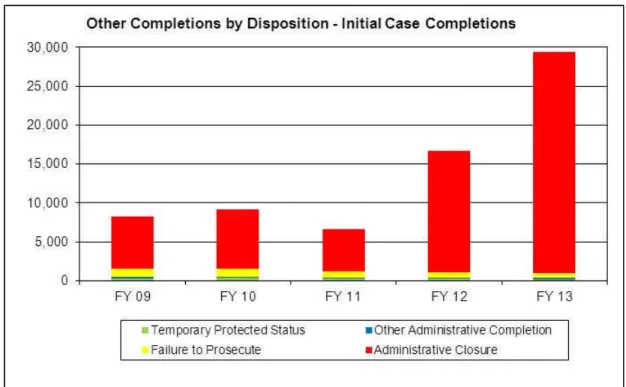
Figure 6 provides a breakout of other completions by disposition type for the initial case completions for FY 2009 to FY 2013. Cases that are not decided on their merits are classified as other completions. The increase in the number of other completions over the last five fiscal years resulted from an increased number of administrative closures, which increased from 82 percent of other completions in FY 2009 to almost 97 percent of the total in FY 2013.
Figure 6 Number % of Total Number % of Total Number % of Total Number % of Total FY 09 6,789 82.1 1,038 12.6 148 1.8 294 3.6 8,269 FY 10 7,605 83.3 1,056 11.6 145 1.6 329 3.6 9,135 FY 11 5,364 81.6 868 13.2 103 1.6 239 3.6 6,574 FY 12 15,715 93.9 659 3.9 121 0.7 234 1.4 16,729 FY 13 28,405 96.8 577 2.0 182 0.6 176 0.6 29,340 Failure to Prosecute Administrative Closure
Other Com pletions by Disposition - Initial Case Com pletions
Total Other Administrative Completion Temporary Protected Status
Executive Office for Immigration Review Office of Planning, Analysis, and Technology
FY 2013 Statistics Yearbook April 2014
C5
Figure 6A provides a breakout of other completions by disposition type for the subsequent case completions. These also showed an increase in administrative closures over the five-year time period.
Figure 6A Number % of Total Number % of Total Number % of Total Number % of Total FY 09 1,098 80.1 9 0.7 204 14.9 60 4.4 1,371 FY 10 1,343 88.2 4 0.3 122 8.0 54 3.5 1,523 FY 11 996 84.5 11 0.9 123 10.4 49 4.2 1,179 FY 12 2,379 95.0 5 0.2 73 2.9 47 1.9 2,504 FY 13 4,049 96.5 4 0.1 86 2.1 55 1.3 4,194 Failure to Prosecute Administrative Closure
Other Com pletions by Disposition - Subsequent Case Com pletions
Total Other Administrative Completion Temporary Protected Status
Executive Office for Immigration Review Office of Planning, Analysis, and Technology
FY 2013 Statistics Yearbook April 2014
C6
Figure 7 provides information on the number of cases transferred to a different hearing location or granted a change of venue for FY 2009 to FY 2013.
Figure 7
Changes of
Venue Transf ers Total FY 09 24,928 23,485 48,413 FY 10 30,399 23,317 53,716 FY 11 38,731 36,782 75,513 FY 12 43,882 39,634 83,516 FY 13 50,893 37,770 88,663
Changes of Venue and Transfers
Table 5 provides a breakout of cases, by immigration court for FY 2013, for which an immigration judge granted a motion to change venue or a motion to transfer.
Executive Office for Immigration Review Office of Planning, Analysis, and Technology
FY 2013 Statistics Yearbook April 2014
C7
Table 5 – FY 2013 Changes of Venue and Transfers
Im m igration Court Changes of Venue Transfers Total
ADELANTO, CALIFORNIA 850 1,129 1,979
ARLINGTON, VIRGINIA 682 1,616 2,298
ATLANTA, GEORGIA 384 410 794
BALTIMORE, MARYLAND 336 2 338
BATAVIA SERVICE PROCESSING CENTER (SPC), NEW YORK 28 421 449
BLOOMINGTON (ST. PAUL), MINNESOTA 188 305 493
BOSTON, MASSACHUSETTS 287 911 1,198
BUFFALO, NEW YORK 522 35 557
CHARLOTTE, NORTH CAROLINA 209 0 209
CHICAGO, ILLINOIS 2,276 1,731 4,007
CLEVELAND, OHIO 144 563 707
DALLAS, TEXAS 241 1,407 1,648
DENVER, COLORADO 356 1,002 1,358
DETROIT, MICHIGAN 307 398 705
EAST MESA, CALIFORNIA 187 434 621
EL CENTRO SPC, CALIFORNIA 33 194 227
EL PASO SPC, TEXAS 14 1,216 1,230
EL PASO, TEXAS 1,398 508 1,906
ELIZABETH DETENTION CENTER, NEW JERSEY 191 1,098 1,289
ELOY, ARIZONA 3,302 2 3,304
FISHKILL - NEW YORK STATE DOC, NEW YORK 25 26 51
FLORENCE SPC, ARIZONA 3,084 17 3,101
GUAYNABO (SAN JUAN), PUERTO RICO 189 17 206
HARLINGEN, TEXAS 5,755 169 5,924 HARTFORD, CONNECTICUT 73 41 114 HONOLULU, HAWAII 13 69 82 HOUSTON SPC, TEXAS 35 4,049 4,084 HOUSTON, TEXAS 3,541 648 4,189 IMPERIAL, CALIFORNIA 109 162 271
KANSAS CITY, MISSOURI 110 493 603
KROME NORTH SPC, FLORIDA 2,596 22 2,618
LAS VEGAS, NEVADA 133 86 219
LOS ANGELES, CALIFORNIA 2,500 2,089 4,589
LOS FRESNOS (PORT ISABEL SPC), TEXAS 35 2,943 2,978
MEMPHIS, TENNESSEE 304 47 351
MIAMI, FLORIDA 1,374 122 1,496
NEW ORLEANS, LOUISIANA 945 67 1,012
NEW YORK CITY, NEW YORK 1,763 174 1,937
NEWARK, NEW JERSEY 620 66 686
OAKDALE FEDERAL DETENTION CENTER, LOUISIANA 33 2,691 2,724
OMAHA, NEBRASKA 176 565 741 ORLANDO, FLORIDA 326 103 429 PEARSALL, TEXAS 84 3,096 3,180 PHILADELPHIA, PENNSYLVANIA 349 62 411 PHOENIX, ARIZONA 2,897 236 3,133 PORTLAND, OREGON 243 41 284
SAIPAN, NORTHERN MARIANA ISLANDS 0 3 3
SALT LAKE CITY, UTAH 56 1 57
SAN ANTONIO, TEXAS 4,688 3,544 8,232
SAN DIEGO, CALIFORNIA 1,056 71 1,127
SAN FRANCISCO, CALIFORNIA 803 1,658 2,461
SEATTLE, WASHINGTON 623 9 632
STEWART DETENTION FACILITY, GEORGIA 704 0 704
TACOMA, WASHINGTON 1,783 0 1,783
TUCSON, ARIZONA 142 10 152
ULSTER - NEW YORK STATE DOC, NEW YORK 59 19 78
VARICK SPC, NEW YORK 22 692 714
YORK, PENNSYLVANIA 1,710 280 1,990
Executive Office for Immigration Review Office of Planning, Analysis, and Technology
FY 2013 Statistics Yearbook April 2014
D1
Immigration Courts:
Initial Case Completions by Country of Nationality
In Fiscal Year (FY) 2013, the top 10 nationalities accounted for approximately 78 percent of all initial case completions, as shown in Figure 8. A total of 217 nationalities are reported in the FY 2013 immigration judge initial case completions. Mexico and Central American countries are consistently among the predominant nationalities of these completions.
Figure 8
Country of Nationality Initial Case
Completions % of Total Mexico 74,235 42.91% Guatemala 15,239 8.81% El Salvador 13,528 7.82% Honduras 10,344 5.98% China 8,221 4.75% Cuba 3,174 1.83% Dominican Republic 2,932 1.69% Ecuador 2,289 1.32% India 2,128 1.23% Jamaica 2,106 1.22% All Others 38,822 22.44% Total 173,018 100%
FY 2013 Initial Case Completions by Country of Nationality
Executive Office for Immigration Review Office of Planning, Analysis, and Technology
FY 2013 Statistics Yearbook April 2014
D2
Table 6 provides information on the top 25 nationalities each year for FY 2009 through FY 2013. During the five-year period, eight of the top 10 nationalities were: Mexico, Guatemala, El Salvador, Honduras, China, Dominican Republic, Cuba, and Jamaica.
Table 6 - Initial Case Completions by Country of Nationality Top 25 Nationalities: FY 2009 - FY 2013
Rank FY 2009 FY 2010 FY 2011 FY 2012 FY 2013
1 Mexico Mexico Mexico Mexico Mexico
2 Guatemala Guatemala Guatemala Guatemala Guatemala
3 El Salvador El Salvador El Salvador El Salvador El Salvador
4 Honduras Honduras Honduras Honduras Honduras
5 China China China China China
6 Dominican Republic Haiti Dominican Republic Dominican Republic Cuba 7 Haiti Dominican
Republic Cuba Cuba
Dominican Republic
8 Colombia Colombia Jamaica India Ecuador
9 Cuba Cuba Colombia Jamaica India
10 Jamaica Jamaica India Colombia Jamaica
11 Brazil Brazil Haiti Ecuador Colombia
12 Ecuador Ecuador Brazil Haiti Philippines
13 India Philippines Ecuador Brazil Brazil
14 Philippines Peru Philippines Philippines Haiti
15 Peru India Peru Peru Peru
16 Nicaragua Venezuela Nicaragua Nicaragua Nicaragua
17 Venezuela Nicaragua Venezuela Nigeria Pakistan
18 Canada Canada Ghana Pakistan Nigeria
19 Pakistan Pakistan Nigeria Ghana Venezuela
20 Indonesia Nigeria Canada Venezuela Kenya
21 Nigeria Russia Pakistan South Korea Russia
22 Russia Vietnam Russia Russia Ghana
23 Vietnam South Korea South Korea Kenya Nepal
24 Ghana Ghana Trinidad and
Tobago Canada South Korea
25 Ethiopia Kenya Kenya Trinidad and
Executive Office for Immigration Review Office of Planning, Analysis, and Technology
FY 2013 Statistics Yearbook April 2014
E1
Immigration Courts:
Initial Case Completions by Language
Figure 9 shows a breakdown of Fiscal Year (FY) 2013 initial case completions by language. Out of 260 languages from the initial case completions in FY 2013, the top five languages - Spanish, English, Mandarin, Russian, and Arabic - accounted for approximately 90 percent of these initial case completions.
Figure 9
FY 2013 Initial Case Completions by Language Language Initial Case
Completions % of Total Spanish 114,531 66.20% English 32,547 18.81% Mandarin 6,521 3.77% Russian 1,461 0.84% Arabic 1,341 0.78% Other 16,617 9.60% Total 173,018 100%
Executive Office for Immigration Review Office of Planning, Analysis, and Technology
FY 2013 Statistics Yearbook April 2014
E2
Table 7 provides information on the top 25 languages each year for FY 2009 through FY 2013. For the five-year period, eight of the top 10 languages were: Spanish, English, Mandarin, Russian, Arabic, Portuguese, Creole, and French.
Table 7 – Initial Case Completions by Language Top 25 Languages: FY 2009 – FY 2013
Rank FY 2009 FY 2010 FY 2011 FY 2012 FY 2013
1 Spanish Spanish Spanish Spanish Spanish
2 English English English English English
3 Mandarin Mandarin Mandarin Mandarin Mandarin
4 Creole Creole Russian Russian Russian
5 Russian Russian Creole Arabic Arabic
6 Portuguese Portuguese Portuguese Creole Portuguese
7 Arabic Arabic Arabic Portuguese Creole
8 Foo Chow Foo Chow French French Punjabi
9 French French Korean Korean French
10 Indonesian Korean Foo Chow Foo Chow Korean
11 Korean Indonesian Punjabi Punjabi Foo Chow
12 Punjabi Armenian Tigrigna
-Eritrean Gujarati Nepali
13 Albanian Punjabi Amharic Nepali Amharic
14 Amharic Amharic Gujarati Amharic Indonesian
15 Armenian Vietnamese Indonesian Indonesian Tagalog
16 Vietnamese Tagalog Nepali Vietnamese
Romanian-Moldovan
17 Tagalog Albanian Vietnamese Tagalog Vietnamese
18 Chaldean Polish Tagalog Tigrigna
-Eritrean Gujarati
19 Urdu Urdu Armenian Urdu Urdu
20 Polish Somali Polish Armenian Albanian
21 Nepali Nepali Somali Tamil Armenian
22 Tibetan Tibetan Albanian
Romanian-Moldovan
Tigrigna -Eritrean
23 Somali Tigrigna
-Eritrean Tamil Albanian Somali
24 Tigrigna
-Eritrean Bengali Urdu Polish Polish
25 Bengali Cantonese
Executive Office for Immigration Review Office of Planning, Analysis, and Technology
FY 2013 Statistics Yearbook April 2014
F1
Immigration Courts:
Initial Case Completions by Representation Status
An attorney or other representative whom the Board of Immigration Appeals has fully accredited may represent individuals in proceedings before an immigration
judge. Many individuals who appear before EOIR are indigent and cannot afford a private attorney. EOIR provides lists of free legal service providers and maintains a list of fully-accredited representatives who may be able and willing to assist indigent aliens in immigration proceedings. EOIR also is implementing a policy in which EOIR
provides, among other procedural protections, representatives for unrepresented immigration detainees whom an immigration judge determines have serious mental disorders that render them mentally incompetent to represent themselves at immigration hearings.
As shown in Figure 10, the percentage of represented aliens increased each year from Fiscal Year (FY) 2009 (35%) to FY 2013 (59%).
Figure 10
Initial Case Completions Representation in Immigration Courts
Represented Unrepresented Total
FY 09 79,198 145,379 224,577
FY 10 86,307 128,986 215,293
FY 11 89,022 120,260 209,282
FY 12 94,009 94,221 188,230
Executive Office for Immigration Review Office of Planning, Analysis, and Technology
FY 2013 Statistics Yearbook April 2014
G1
Immigration Courts:
Initial Case Completions for Detained Cases
Detention locations include Department of Homeland Security (DHS) Service Processing Centers (SPC), DHS contract detention facilities, state and local
government jails, and Bureau of Prisons institutions. For the purpose of this Yearbook, Institutional Hearing Program (IHP) cases are considered detained cases. See Tab H.
Figure 11 provides a comparison of detained initial case completions to total initial case completions. The number of cases completed for detained aliens decreased 53 percent from Fiscal Year (FY) 2009 to FY 2013.
Figure 11
Immigration Court Initial Case Completions for Detained Aliens (Including IHP) Initial Case
Completions for Detained Aliens
Initial Case Completions for All
Aliens Percent Detained FY 09 134,246 224,577 60% FY 10 114,892 215,293 53% FY 11 112,776 209,282 54% FY 12 89,619 188,230 48% FY 13 63,313 173,018 37%
Executive Office for Immigration Review Office of Planning, Analysis, and Technology
FY 2013 Statistics Yearbook April 2014
G2
Table 8 provides information, by immigration court, on FY 2013 detained completions. The following immigration courts each completed more than 3,000 detained initial cases in FY 2013: Stewart Detention Facility, Houston SPC, Oakdale Federal Detention Center, Krome North SPC, and Dallas. Immigration courts in three border states – Texas, Arizona, and California – accounted for 45 percent of the
detained completions in FY 2013. Courts in those three states are highlighted inbluein Table 8.
Executive Office for Immigration Review Office of Planning, Analysis, and Technology
FY 2013 Statistics Yearbook April 2014
G3
Table 8 - FY 2013 Immigration Court Initial Case Completions for Detained Cases
Immigration Court Completions
ADELANTO, CALIFORNIA 2,263
ARLINGTON, VIRGINIA 1,386
ATLANTA, GEORGIA 690
BALTIMORE, MARYLAND 521
BATAVIA SERVICE PROCESSING CENTER (SPC), NEW YORK 421
BLOOMINGTON (ST. PAUL), MINNESOTA 885
BOSTON, MASSACHUSETTS 1,096
BUFFALO, NEW YORK 28
CHARLOTTE, NORTH CAROLINA 7
CHICAGO, ILLINOIS 2,217
CLEVELAND, OHIO 1,084
DALLAS, TEXAS 3,020
DENVER, COLORADO 1,300
DETROIT, MICHIGAN 945
EAST MESA, CALIFORNIA 881 EL CENTRO SPC, CALIFORNIA 580 EL PASO SPC, TEXAS 2,352
EL PASO, TEXAS 624
ELIZABETH DETENTION CENTER, NEW JERSEY 893
ELOY, ARIZONA 2,562
FISHKILL - NEW YORK STATE DOC, NEW YORK 195
FLORENCE SPC, ARIZONA 1,406
GUAYNABO (SAN JUAN), PUERTO RICO 69
HARLINGEN, TEXAS 205 HARTFORD, CONNECTICUT 406 HONOLULU, HAWAII 128 HOUSTON SPC, TEXAS 5,800 HOUSTON, TEXAS 121 IMPERIAL, CALIFORNIA 142
KANSAS CITY, MISSOURI 555
KROME NORTH SPC, FLORIDA 3,221
LAS VEGAS, NEVADA 718
LOS ANGELES, CALIFORNIA 2,284 LOS FRESNOS (PORT ISABEL SPC), TEXAS 1,404
MEMPHIS, TENNESSEE 0
MIAMI, FLORIDA 435
NEW ORLEANS, LOUISIANA 1
NEW YORK CITY, NEW YORK 3
NEWARK, NEW JERSEY 983
OAKDALE FEDERAL DETENTION CENTER, LOUISIANA 3,541
OMAHA, NEBRASKA 682 ORLANDO, FLORIDA 369 PEARSALL, TEXAS 1,889 PHILADELPHIA, PENNSYLVANIA 1 PHOENIX, ARIZONA 168 PORTLAND, OREGON 55
SAIPAN, NORTHERN MARIANA ISLANDS 6
SALT LAKE CITY, UTAH 691
SAN ANTONIO, TEXAS 1,070 SAN DIEGO, CALIFORNIA 29 SAN FRANCISCO, CALIFORNIA 1,489
SEATTLE, WASHINGTON 14
STEWART DETENTION FACILITY, GEORGIA 5,879
TACOMA, WASHINGTON 2,020
TUCSON, ARIZONA 377
ULSTER - NEW YORK STATE DOC, NEW YORK 263
VARICK SPC, NEW YORK 1,043
YORK, PENNSYLVANIA 1,896
TOTAL 63,313
Executive Office for Immigration Review Office of Planning, Analysis, and Technology
FY 2013 Statistics Yearbook April 2014
H1
Immigration Courts:
Institutional Hearing Program Cases Received and Completed
The Institutional Hearing Program (IHP) is a cooperative effort between EOIR; the Department of Homeland Security (DHS); and various federal, state, and municipal corrections agencies. In Fiscal Year (FY) 2013, DHS filed charging documents with the immigration courts for incarcerated aliens in 63 different institutions. Immigration judges and court staff either travel to these institutions to conduct IHP hearings or the
immigration judges conduct the hearings by video teleconference.
Figure 12 provides information on IHP receipts and completions for FY 2009 to FY 2013. IHP receipts and completions both declined by 29 percent from FY 2009 to FY 2013.
Figure 12
IHP Cases Received and Completed New NTAs Initial Case Completions FY 09 5,706 4,928 FY 10 5,096 4,376 FY 11 5,287 4,332 FY 12 4,396 3,854 FY 13 4,030 3,506
Executive Office for Immigration Review Office of Planning, Analysis, and Technology
FY 2013 Statistics Yearbook April 2014
H2
Table 9 provides a breakdown of IHP initial case completions by disposition.
Table 9 - IHP Initial Case Completions by Disposition
FY 09 FY 10 FY 11 FY 12 FY 13 4,764 4,265 4,228 3,764 3,312 Removal 4,578 4,160 4,102 3,645 3,208 Termination 116 84 98 80 80 Relief 27 13 26 31 20 Other 43 8 2 8 4 164 111 104 90 194 4,928 4,376 4,332 3,854 3,506 Total Completions
Total Decisions in IHP Cases
Executive Office for Immigration Review Office of Planning, Analysis, and Technology
FY 2013 Statistics Yearbook April 2014
I1
Immigration Courts:
Initial Case Completions with Applications for Relief
Figure 13 provides information on the percent of initial case completions in which the alien filed an application for relief. For the purpose of this Yearbook, voluntary departure (Tab O) is not considered an application for relief.
Figure 13
Initial Case Completions with and without Applications for Relief With Applications Percent with
Applications Without Applications Percent Without Applications Total FY 09 55,224 25% 169,353 75% 224,577 FY 10 56,006 26% 159,287 74% 215,293 FY 11 56,332 27% 152,950 73% 209,282 FY 12 62,207 33% 126,023 67% 188,230 FY 13 68,566 40% 104,452 60% 173,018
Table 10 shows the number and percentage of initial case completions with applications for relief at each immigration court in Fiscal Year (FY) 2013. Courts in which 15 percent or less of the completions involved applications for relief are shown in red. Courts in which 50 percent or more of the completions involved applications for relief are shown inblue.
Executive Office for Immigration Review Office of Planning, Analysis, and Technology
FY 2013 Statistics Yearbook April 2014
I2
Table 10 - FY 2013 Immigration Court Initial Case Completions with Applications for Relief
ADELANTO, CALIFORNIA 2,277 670 29%
ARLINGTON, VIRGINIA 4,709 1,780 38%
ATLANTA, GEORGIA 3,508 1,461 42%
BALTIMORE, MARYLAND 3,420 1,465 43%
BATAVIA SERVICE PROCESSING CENTER (SPC), NEW YORK 442 120 27%
BLOOMINGTON (ST. PAUL), MINNESOTA 2,632 841 32%
BOSTON, MASSACHUSETTS 4,636 2,540 55%
BUFFALO, NEW YORK 834 192 23%
CHARLOTTE, NORTH CAROLINA 3,906 1,536 39%
CHICAGO, ILLINOIS 7,543 2,078 28%
CLEVELAND, OHIO 2,005 675 34%
DALLAS, TEXAS 6,535 1,373 21%
DENVER, COLORADO 3,592 1,325 37%
DETROIT, MICHIGAN 1,833 667 36%
EAST MESA, CALIFORNIA 926 286 31%
EL CENTRO SPC, CALIFORNIA 582 196 34%
EL PASO SPC, TEXAS 2,356 290 12%
EL PASO, TEXAS 1,916 470 25%
ELIZABETH DETENTION CENTER, NEW JERSEY 929 309 33%
ELOY, ARIZONA 2,579 525 20%
FISHKILL - NEW YORK STATE DOC, NEW YORK 195 41 21%
FLORENCE SPC, ARIZONA 1,407 209 15%
GUAYNABO (SAN JUAN), PUERTO RICO 532 282 53%
HARLINGEN, TEXAS 1,825 559 31% HARTFORD, CONNECTICUT 1,107 495 45% HONOLULU, HAWAII 390 206 53% HOUSTON SPC, TEXAS 5,806 876 15% HOUSTON, TEXAS 2,452 1,196 49% IMPERIAL, CALIFORNIA 226 25 11%
KANSAS CITY, MISSOURI 2,191 490 22%
KROME NORTH SPC, FLORIDA 3,238 890 27%
LAS VEGAS, NEVADA 1,806 590 33%
LOS ANGELES, CALIFORNIA 17,830 10,849 61%
LOS FRESNOS (PORT ISABEL SPC), TEXAS 1,411 479 34%
MEMPHIS, TENNESSEE 2,406 828 34%
MIAMI, FLORIDA 6,523 2,899 44%
NEW ORLEANS, LOUISIANA 761 261 34%
NEW YORK CITY, NEW YORK 14,159 10,319 73%
NEWARK, NEW JERSEY 3,564 1,420 40%
OAKDALE FEDERAL DETENTION CENTER, LOUISIANA 3,553 291 8%
OMAHA, NEBRASKA 2,115 946 45% ORLANDO, FLORIDA 3,694 2,109 57% PEARSALL, TEXAS 1,896 473 25% PHILADELPHIA, PENNSYLVANIA 1,823 899 49% PHOENIX, ARIZONA 2,394 1,251 52% PORTLAND, OREGON 1,402 876 62%
SAIPAN, NORTHERN MARIANA ISLANDS 111 21 19%
SALT LAKE CITY, UTAH 1,104 241 22%
SAN ANTONIO, TEXAS 5,649 1,233 22%
SAN DIEGO, CALIFORNIA 2,761 1,071 39%
SAN FRANCISCO, CALIFORNIA 6,985 3,991 57%
SEATTLE, WASHINGTON 2,500 1,464 59%
STEWART DETENTION FACILITY, GEORGIA 5,919 410 7%
TACOMA, WASHINGTON 2,050 534 26%
TUCSON, ARIZONA 816 240 29%
ULSTER - NEW YORK STATE DOC, NEW YORK 264 51 19%
VARICK SPC, NEW YORK 1,088 360 33%
YORK, PENNSYLVANIA 1,905 392 21% TOTAL 173,018 68,566 40% Percent With Applications # of Completions With Applications Initial Case Completions Immigration Court
Executive Office for Immigration Review Office of Planning, Analysis, and Technology
FY 2013 Statistics Yearbook April 2014
J1
Immigration Courts:
Asylum Cases Received and Completed
There are two types of asylum processes – defensive and affirmative. The defensive asylum process applies to aliens who appear before EOIR and who request asylum before an immigration judge. The process is called “defensive” because it can provide relief from being removed from the United States. The affirmative asylum process applies to aliens who initially file an asylum application with the Department of Homeland Security’s U.S. Citizenship and Immigration Services.
For the purpose of this Yearbook, asylum receipts are based on the initial asylum application received date and asylum completions are based on the initial case
completion. Figure 14 shows the affirmative and defensive asylum receipts at the immigration courts for Fiscal Year (FY) 2009 to FY 2013.
Figure 14
Affirmative Defensive Total
FY 09 17,856 12,256 30,112
FY 10 20,080 12,730 32,810
FY 11 24,893 17,771 42,664
FY 12 24,885 19,411 44,296
FY 13 14,957 21,717 36,674
Executive Office for Immigration Review Office of Planning, Analysis, and Technology
FY 2013 Statistics Yearbook April 2014
J2
As shown in Figure 15, asylum receipts increased by 22 percent and asylum completions increased by eight percent from FY 2009 to FY 2013.
Figure 15
Asylum Receipts and Completions Receipts Completions FY 09 30,112 35,301 FY 10 32,810 32,301 FY 11 42,664 31,275 FY 12 44,296 33,887 FY 13 36,674 37,986
Table 11 provides information on FY 2013 asylum completions by immigration court. In FY 2013, the New York, NY; Los Angeles, CA; and San Francisco, CA, immigration courts accounted for 49 percent of the asylum completions.
Executive Office for Immigration Review Office of Planning, Analysis, and Technology
FY 2013 Statistics Yearbook April 2014
J3
Table 11 - Asylum Completions by Court for FY 2013
Immigration Court Completions
ADELANTO, CALIFORNIA 336
ARLINGTON, VIRGINIA 1,191
ATLANTA, GEORGIA 619
BALTIMORE, MARYLAND 913
BATAVIA SERVICE PROCESSING CENTER (SPC), NEW YORK 56
BLOOMINGTON (ST. PAUL), MINNESOTA 366
BOSTON, MASSACHUSETTS 1,053
BUFFALO, NEW YORK 69
CHARLOTTE, NORTH CAROLINA 608
CHICAGO, ILLINOIS 763
CLEVELAND, OHIO 421
DALLAS, TEXAS 461
DENVER, COLORADO 390
DETROIT, MICHIGAN 272
EAST MESA, CALIFORNIA 162
EL CENTRO SPC, CALIFORNIA 134
EL PASO SPC, TEXAS 108
EL PASO, TEXAS 126
ELIZABETH DETENTION CENTER, NEW JERSEY 146
ELOY, ARIZONA 183
FISHKILL - NEW YORK STATE DOC, NEW YORK 6
FLORENCE SPC, ARIZONA 90
GUAYNABO (SAN JUAN), PUERTO RICO 37
HARLINGEN, TEXAS 194 HARTFORD, CONNECTICUT 219 HONOLULU, HAWAII 119 HOUSTON SPC, TEXAS 157 HOUSTON, TEXAS 301 IMPERIAL, CALIFORNIA 7
KANSAS CITY, MISSOURI 177
KROME NORTH SPC, FLORIDA 354
LAS VEGAS, NEVADA 271
LOS ANGELES, CALIFORNIA 7,587
LOS FRESNOS (PORT ISABEL SPC), TEXAS 296
MEMPHIS, TENNESSEE 320
MIAMI, FLORIDA 1,402
NEW ORLEANS, LOUISIANA 117
NEW YORK CITY, NEW YORK 8,917
NEWARK, NEW JERSEY 733
OAKDALE FEDERAL DETENTION CENTER, LOUISIANA 50
OMAHA, NEBRASKA 658 ORLANDO, FLORIDA 1,381 PEARSALL, TEXAS 248 PHILADELPHIA, PENNSYLVANIA 482 PHOENIX, ARIZONA 347 PORTLAND, OREGON 504
SAIPAN, NORTHERN MARIANA ISLANDS 12
SALT LAKE CITY, UTAH 80
SAN ANTONIO, TEXAS 407
SAN DIEGO, CALIFORNIA 392
SAN FRANCISCO, CALIFORNIA 2,245
SEATTLE, WASHINGTON 890
STEWART DETENTION FACILITY, GEORGIA 80
TACOMA, WASHINGTON 235
TUCSON, ARIZONA 98
ULSTER - NEW YORK STATE DOC, NEW YORK 5
VARICK SPC, NEW YORK 65
YORK, PENNSYLVANIA 126
Executive Office for Immigration Review Office of Planning, Analysis, and Technology
FY 2013 Statistics Yearbook April 2014
K1
Immigration Courts:
Asylum Cases Completed by Disposition
Figure 16 provides the asylum grant rate for the past five years. The grant rate is calculated as a percentage of asylum claims decided on the merits. The grant rate increased from Fiscal Year (FY) 2009 (47%) to FY 2013 (53%).
Figure 16
Table 12 provides information on the FY 2013 asylum grant rate for each individual immigration court.
Asylum Grant Rate
Grants Denials Grant Rate
FY 09 8,800 9,876 47%
FY 10 8,518 8,335 51%
FY 11 10,137 9,280 52%
FY 12 10,711 8,502 56%
Executive Office for Immigration Review Office of Planning, Analysis, and Technology
FY 2013 Statistics Yearbook April 2014
K2
Table 12 – FY 2013 Asylum Grant Rate by Immigration Court
Immigration Court Grants Denials Grant Rate
ADELANTO, CALIFORNIA 20 236 8%
ARLINGTON, VIRGINIA 550 172 76%
ATLANTA, GEORGIA 24 195 11%
BALTIMORE, MARYLAND 297 290 51%
BATAVIA SERVICE PROCESSING CENTER (SPC), NEW YORK 4 36 10%
BLOOMINGTON (ST. PAUL), MINNESOTA 24 109 18%
BOSTON, MASSACHUSETTS 188 145 56%
BUFFALO, NEW YORK 13 30 30%
CHARLOTTE, NORTH CAROLINA 24 110 18%
CHICAGO, ILLINOIS 181 273 40%
CLEVELAND, OHIO 37 183 17%
DALLAS, TEXAS 74 150 33%
DENVER, COLORADO 69 151 31%
DETROIT, MICHIGAN 40 129 24%
EAST MESA, CALIFORNIA 26 108 19%
EL CENTRO SPC, CALIFORNIA 20 101 17%
EL PASO SPC, TEXAS 0 87 0%
EL PASO, TEXAS 0 63 0%
ELIZABETH DETENTION CENTER, NEW JERSEY 18 98 16%
ELOY, ARIZONA 1 139 1%
FISHKILL - NEW YORK STATE DOC, NEW YORK 0 4 0%
FLORENCE SPC, ARIZONA 4 69 5%
GUAYNABO (SAN JUAN), PUERTO RICO 0 3 0%
HARLINGEN, TEXAS 48 32 60% HARTFORD, CONNECTICUT 42 96 30% HONOLULU, HAWAII 59 39 60% HOUSTON SPC, TEXAS 5 103 5% HOUSTON, TEXAS 44 118 27% IMPERIAL, CALIFORNIA 0 0 0%
KANSAS CITY, MISSOURI 34 63 35%
KROME NORTH SPC, FLORIDA 8 189 4%
LAS VEGAS, NEVADA 8 102 7%
LOS ANGELES, CALIFORNIA 795 1,457 35%
LOS FRESNOS (PORT ISABEL SPC), TEXAS 87 165 35%
MEMPHIS, TENNESSEE 76 111 41%
MIAMI, FLORIDA 168 354 32%
NEW ORLEANS, LOUISIANA 25 46 35%
NEW YORK CITY, NEW YORK 5,415 1,022 84%
NEWARK, NEW JERSEY 163 130 56%
OAKDALE FEDERAL DETENTION CENTER, LOUISIANA 3 40 7%
OMAHA, NEBRASKA 22 132 14% ORLANDO, FLORIDA 137 249 35% PEARSALL, TEXAS 13 164 7% PHILADELPHIA, PENNSYLVANIA 105 66 61% PHOENIX, ARIZONA 26 20 57% PORTLAND, OREGON 51 73 41%
SAIPAN, NORTHERN MARIANA ISLANDS 0 0 0%
SALT LAKE CITY, UTAH 10 24 29%
SAN ANTONIO, TEXAS 101 125 45%
SAN DIEGO, CALIFORNIA 63 93 40%
SAN FRANCISCO, CALIFORNIA 598 419 59%
SEATTLE, WASHINGTON 155 193 45%
STEWART DETENTION FACILITY, GEORGIA 1 54 2%
TACOMA, WASHINGTON 22 115 16%
TUCSON, ARIZONA 28 34 45%
ULSTER - NEW YORK STATE DOC, NEW YORK 0 5 0%
VARICK SPC, NEW YORK 3 41 7%
YORK, PENNSYLVANIA 4 68 6%
Executive Office for Immigration Review Office of Planning, Analysis, and Technology
FY 2013 Statistics Yearbook April 2014
K3
Figures 17 and 18 show the grant rates for affirmative and defensive asylum claims.
Figure 17
Figure 18
Immigration Court Affirmative Grant Rate
Grants Denials Grant Rate
FY 09 6,322 5,232 55%
FY 10 6,250 3,997 61%
FY 11 7,319 3,618 67%
FY 12 7,823 3,000 72%
FY 13 7,306 2,617 74%
Immigration Court Defensive Grant Rate
Grants Denials Grant Rate
FY 09 2,478 4,644 35%
FY 10 2,268 4,338 34%
FY 11 2,818 5,662 33%
FY 12 2,888 5,502 34%
Executive Office for Immigration Review Office of Planning, Analysis, and Technology
FY 2013 Statistics Yearbook April 2014
K4
Figure 19 illustrates all asylum initial case completions broken out by disposition. The number of asylum grants increased by 13 percent from FY 2009 to FY 2013 while the number of denial decisions decreased by 11 percent for the same time period.
Figure 19
Grants Denials Withdrawn Abandoned Other Total FY 09 8,800 9,876 6,450 3,248 6,927 35,301 FY 10 8,518 8,335 6,275 1,646 7,527 32,301 FY 11 10,137 9,280 5,137 1,430 5,291 31,275 FY 12 10,711 8,502 5,357 1,296 8,021 33,887 FY 13 9,933 8,823 6,400 1,439 11,391 37,986
Executive Office for Immigration Review Office of Planning, Analysis, and Technology
FY 2013 Statistics Yearbook April 2014
K5
An applicant for asylum also is an applicant for withholding of removal under section 241(b)(3) of the Immigration and Nationality Act (INA). Figure 20 depicts the withholding of removal grant rate under section 241(b)(3) of the INA. Cases that had grants for both asylum and withholding were omitted from the withholding of removal grant rate because they have previously been counted as an asylum grant.
Figure 20
Immigration Court Withholding of Removal Grant Rate
Grants Denials Grant Rate
FY 09 1,574 10,247 13%
FY 10 1,496 8,700 15%
FY 11 1,673 9,943 14%
FY 12 1,553 9,203 14%
Executive Office for Immigration Review Office of Planning, Analysis, and Technology
FY 2013 Statistics Yearbook April 2014
K6
Figure 21 shows the percentage of cases in which asylum or withholding of removal was granted. The overall grant rate from FY 2009 to FY 2013 increased from 55 percent to 61 percent. The number of cases which result in asylum grants and withholding grants increased by 10 percent from FY 2009 to FY 2013. For the same time period the number of denials for these cases decreased by 13 percent.
Figure 21
Asylum Grants Withholding of Removal Grants
Denials of Both Asylum and Withholding of Removal Grant Rate FY 09 8,800 1,574 8,422 55% FY 10 8,518 1,496 6,936 59% FY 11 10,137 1,673 7,656 61% FY 12 10,711 1,553 7,020 64% FY 13 9,933 1,518 7,320 61%
Executive Office for Immigration Review Office of Planning, Analysis, and Technology
FY 2013 Statistics Yearbook April 2014
L1
Immigration Courts:
Asylum Grants by Country of Nationality
Figure 22 displays the top 10 nationalities granted asylum in Fiscal Year (FY) 2013. In FY 2013 the top 10 nationalities accounted for 70 percent of all asylum grants. China accounted for nearly 46 percent of all asylum grants. A total of 144 nationalities were represented among individuals granted asylum in FY 2013.
Figure 22
Country of Nationality Completions % of Total
China 4,532 45.63% Ethiopia 399 4.02% Nepal 381 3.84% India 322 3.24% Egypt 305 3.07% Soviet Union 252 2.54% Eritrea 240 2.42% Russia 187 1.88% El Salvador 181 1.82% Mexico 155 1.56% All Others 2,979 29.99% Total 9,933 100%
Executive Office for Immigration Review Office of Planning, Analysis, and Technology
FY 2013 Statistics Yearbook April 2014
L2
Table 13 provides information on the top nationalities granted asylum for the period FY 2009 to FY 2013. For each of the five years, five of the top 10 countries from which aliens were granted asylum were represented: China, Ethiopia, Nepal, India, and Eritrea.
Table 13 - Asylum Grants by Country of Nationality Top 25 Nationalities: FY 2009 - FY 2013
Rank FY 2009 FY 2010 FY 2011 FY 2012 FY 2013
1 China China China China China
2 Ethiopia Ethiopia Eritrea Ethiopia Ethiopia
3 Haiti Nepal Ethiopia Nepal Nepal
4 Iraq India Nepal Eritrea India
5 Colombia Egypt Egypt Egypt Egypt
6 India Somalia Soviet Union Soviet Union Soviet Union 7 Eritrea Colombia India India Eritrea 8 Albania Eritrea Somalia Guatemala Russia
9 Guinea Soviet Union Colombia El Salvador El Salvador 10 Nepal Armenia Russia Pakistan Mexico 11 Cameroon Cameroon Cameroon Cameroon Guatemala 12 Egypt Guinea Venezuela Russia Cameroon 13 Venezuela Venezuela Guatemala Guinea Pakistan 14 Soviet Union Russia Guinea Mexico Guinea 15 Armenia Guatemala El Salvador Venezuela Sri Lanka 16 Somalia El Salvador Pakistan Sri Lanka Honduras
17 Indonesia Iraq Armenia Indonesia Somalia 18 Guatemala Albania Iraq Colombia Venezuela 19 Russia Haiti Albania Iraq Indonesia 20 El Salvador Pakistan Sri Lanka Iran Mali
21 Sri Lanka Indonesia Indonesia Moldavia
(Moldova) Gambia 22 Burma (Myanmar) Sri Lanka Mexico Somalia Colombia 23 Kenya Yugoslavia Iran Honduras Albania
24 Yugoslavia Kenya Kenya Gambia Moldavia (Moldova) 25 Iran Burma (Myanmar) Mali Armenia Bangladesh
Executive Office for Immigration Review Office of Planning, Analysis, and Technology
FY 2013 Statistics Yearbook April 2014
M1
Immigration Courts:
Convention Against Torture
In 1999, the Department of Justice implemented regulations regarding the Convention Against Torture and other Cruel, Inhuman or Degrading Treatment or Punishment (Convention Against Torture or CAT). There are two forms of protection under the 1999 regulations:
Withholding of removal may be granted to an alien who establishes that they would be tortured in the proposed country of removal.
Deferral of removal may be available to aliens who are not eligible for withholding of removal under the Convention Against Torture, but provides less protection against removal as the protection can be more easily and quickly terminated if it becomes possible to remove the alien.
As shown in Table 14, the immigration courts adjudicated 26,317 CAT
applications during Fiscal Year (FY) 2013. Of those, immigration judges granted 506 CAT applications, and the majority of those grants were withholding.
Table 14 - FY 2013 Convention Against Torture Cases by Disposition Granted
Denied Other Withdrawn Abandoned Total Withholding Deferral Total
375 131 506 9,575 9,699 5,819 718 26,317
Table 15 shows a breakdown of CAT completions by immigration courts. The New York City, NY; Los Angeles, CA; San Francisco, CA; Miami, FL; and Orlando, FL, immigration courts combined completed approximately 53 percent of the total FY 2013 CAT cases.