NEER WORKING PAPER SERIES
ISSUES IN THE MEASUREMENT AND INTERPRETATION OF SAVING AND WEALTH
Michael J. Boskin
Working Paper No. 2633
NATIONAL BUREAU OF ECONOMIC RESEARCH
1050
Massachusetts AvenueCambridge, MA 02138 June 1988
I would like to thank participants at the 50th Anniversary Conference on Research on Income and Wealth, especially the discussants and panelists, for many valuable suggestions and the National Bureau of Economic Research and the Stanford Center for Economic Policy Research for financial support. This research is part of NEER's
research
program in Taxation. Anyopinions
expressed re those of the author not those of the National Bureau of
NBER Working Paper #2633 June 1988
ISSUES IN THE MEASUREMENT AND INTERPRETATION OF SAVING AND WEALTH
Alternative measures of saving are developed and compared to the traditional NIPA estimates. Various data sources and estimation
methodologies all conclude that adJustments for net saving in durables, government capital, capital gains and losses, and revaluations are
substantial. For example, government capital and durables adjustments raise the NIPA estimate of net national saving in 1985 from 4.7% to 8.8%.
New estimates of saving, developed and measured as the change in real net worth based on data from the Federal Reserve Flow of Funds
National Balance Sheets, differ substantially from the NIPA estimates. For example, in 1986 and 1987, the NIPA net national saving measure is 1.8% and 1.9%, respectively, whereas my corresponding estimates from FED data are 11.5% and 3.3%. My new estimates of net private saving from FED data average 6.5% for the period 1981-87, versus 11.3% for the 1951-80 period. Net national saving has fallen even further, from an average of 11.2% in 1951-80 to 3.2% in 1981-87. correspondingly, real private net worth reached 13.4 trillion (in constant 1982 dollars) by 1987, but its rate of growth slowed in the period 1979-87 relative to the postwar average.
Various conceptual and measurement issues are discussed. Most
important are 1) the appropriate level of aggregation across households of different age and type, sectors of the economy, and types of assets, and 2) improved measures of personal income to include as much currently unrecorded income as possible.
Michael J. Boskin NBER
1. Introduction
The saving and wealth accumulation behavior of an economy reveal much about it, as they reflect preferences, incentives, institutions, and demographics. However, there are numerous measurement and interpretation issues surrounding data on, adjusted measures of, and empirical analyses about postwar U.S. saving and wealth. It is by now well known, and
considered conventional wisdom, that the U.S. postwar saving rate is low by international standards, and has fallen since the 1950s and 1960s, This "conventional wisdom" sterns primarily from the traditional National Income and Product Account measures of gross and net private and national saving in
the United States.
There are, however, other sources for measuring saving, and reasons to believe the NIPA saving figures are the beginning, not the end, of the
story. Serious conceptual and measurement issues, ranging from the comprehensiveness of the definition of saving to important details
concerning deflators, as well as a host of other matters, remain unresolved. Since its inception, the Conference on Research on Income and Wealth has devoted a nontrivial fraction of its efforts to dealing with these and related issues, as have numerous other studies in the last decade, including some of my own, conducted by and for the National Bureau of Economic
Research.
In the first three Conference on Research in Income and Wealth volumes, saving and wealth were prominent features. Issues I discuss below were discussed even then: the treatment of capital gains and losses in the NIPA,
inflation and inventory valuation adjustments, real corporate profits. In volume one, measuring national wealth, including valuation problems,
government product; in volume two, capital gains and alternative definitions of saving; in volume three, alternative definitions and methods of measuring
saving and its components. The talent mobilized to work on these issues in the 1930s was impressive, and included Simon Kuznets, Raymond Goldsmith, Milton Friedman, Gottfried Haberler and Solomon Fabricant, among many others.
Since a complete review of that literature would comprise a lengthy paper itself, suffice it to say that the last Conference on Research in Income and Wealth was devoted to issues in measuring saving and investment. The forthcoming Conference voluxne1 contains a large number of important, novel, and useful papers, many of which contain partial surveys of their respective subfields within the general area of study.
It is no coincidence that the most famous book ever written in
economics, Adam Smith's Wealth of Nations, bore its title. For 200 years, issues concerning the measurement, positive analysis of, and normative prescriptions for increasing, national wealth have been an important
component of the economics profession.
These concerns about the economic Costs and benefits of saving also have an interesting and checkered history (see L. Klein, 1986). Polonius'
advice was, "Neither a borrower nor a lender be." Benjamin Franklin's quip that "a penny saved is a penny earned" is perhaps the most often-quoted schoolboy maxim concerning the benefits of thrift, but in the middle third of this century, it gave way to the Keynesian notion that spending might be insufficient to support full employment. Keynes and the postwar
stagnationists were deeply concerned that insufficient spending would lead to chronic and massive unemployment, so they argued for policies designed to
soak up excess saving. While it is not my purpose here to present my own or a summary of other views concerning this Keynesian proposition, suffice it to say that the force of that argument has been mitigated considerably by recent analytical and empirical research in economics, and that at best, it
is a weak and temporary proposition.
It is obvious, however, that we could save too much. In order to save more, we must forego current consumption. Therefore, individuals and
societies must somehow balance the benefits of increased consumption in the future against the cost of foregone consumption opportunities today. To show how full circle we have come, the current Chairman of the Federal Reserve Board, Alan Greenspan, has been calling for the federal government to run a budget surplus on average, primarily to compensate for what he regards as a chronicly low saving rate.
That we save too little as a nation appears to be a widespread view among economists. Some refer to the apparent (usually measured by the NIPA saving figures) historical decline in the saving rate, as well as the better
aggregate performance of the U.S. economy in the l950s and 1960s then subsequently. Whether the low saving rate is a cause of the subsequent deterioration of the economy's performance or an effect thereof, or both, is generally left unspecified.
Others bemoan the low U.S. saving rate relative to other countries. It is clear that saving in the United States, as conventionally measured, is below that of other advanced economies. While we will discuss below
extended measures of saving that suggest that the traditional measures probably overstate this difference, it is still substantial. When I was a graduate student, it was common to argue that it was reasonable for the United States to have a much lower saving rate than other economies because we were so much richer than they, they were saving rapidly to try to catch
up and to finance the rebuilding of their infrastructure after the
devastation from World War II (although why this was still going on in the l970s suggests convenient arguments die slowly). The rate of growth of GNP
in many of these other economies exceeded that of the United States and our lower saving and investment rates were often singled out for a non-trivial
share of the blame.
Recently, a new argument has claimed that the major problem with our low private and even lower national saving rate is that it falls
substantially below our rate of net investment. The low investment rate is assumed to be one cause of slow productivity growth, and is itself
substantially below the investment rates of most other advanced economies. We appear to be unwilling to see the investment rate fall to the still lower rate of net national saving. This leads us to rely on historically large imports of foreign capital to finance a substantial fraction of our net investment and a modest fraction of our gross investment. If this continues for very long, it would imply an explosive growth of external debt and concomitant adjustment problems later on.
My own view of the relationship of domestic saving and investment is that they are indeed eventually linked. In the short and medium run, there is no necessary tie between domestic investment and saving, as capital is internationally quite mobile, at least over a modest fraction of the saving of any society. Eventually, however, an advanced economy such as the United States will need to finance its own domestic investment. This implies that in the long-run domestic investment will be constrained by the available supply of private saving and gives some force to the concern about an apparently low private saving rate.
interpretation, evolution, and analysis of saving and wealth in the postwar United States. Saving behavior may well be linked to our long-term growth as well as potentially to our short-run stability. As interesting as these analytical and empirical issues are (see Boskin (1988) and Bernheim (1987) for a discussion of sc .e of these issues), my goal here is much more modest. Having raised these issues, I present a brief survey of some important issues in the definition and measurement of saving. I also present some selected recent results, identify some substantial progress made, and
present some sugesstions for future avenues of research. I do not have the time or space, nor is it my comparative advantage given the other
participants and papers in this conference and previous conferences on income and wealth, to go into great technical detail concerning many of the
issues raised. For that, the interested reader is referred to some references.
Toward this end, Section 2 discusses definitions, measures, and sources of information concerning saving and wealth, and their relationship to
theories of saving and consumption. It briefly mentions some of the potential problems, such as sampling error, measurement error, and various data sources. After a brief discussion of the NIPA saving figures, the Federal Reserve Flow of Funds, household surveys, an1 the estate tax data, it turns to the definition of saving for an individual, a sector, and a nation. It discusses the Keynesian emphasis on short-run flows, the lifecycle permanent income view attempting to distinguish transitory and permanent components on the one hand, or the need to develop household age or cohort specific balance sheets combined with demographic information on the other, the Ricardian equivalence intergenerational altruism view that only aggregate resources matter for consumption and that the distribution of
and hence age-specific balance sheets would be beside the point.
Various well-known conceptual problems with the NIPA and the Flow of Funds are discussed, such as the failure of the NIPA to measure capital gains and losses, etc. Issues such as the measurement and valuation of human wealth and changes therein, including the valuation of human and nonhuman wealth in a world of incomplete markets, appropriate deflators,
inflation adjustment, cost-of-living indices, etc. are discussed. A comparison of the traditional NIPA saving measures with those from the
Federal Reserve Flow of Funds is presented, as are new more comprehensive extentions of the NIPA saving data to incorporate net saving in government capital and consumer durables. These comparisons are interesting and informative, although we make no pretense of delving deeply into reasons for the differences (see Wilson, et al (1988) for a discussion thereof). They reveal a somewhat more complete story concerning the evolution of private and national saving and wealth than has heretofore been available. They suggest that more comprehensive measures of saving reveal substantially higher net saving rates in the U.S. than the traditional NIPA estimates, but
they reinforce the view that the saving rate though higher,. has fallen, as has the rate of wealth accumulation.
Section 3 discusses aggregation and disaggregation. Various theories of private behavior and the nature of credit markets suggest alternative views of the propriety of aggregating and disaggregating saving and wealth data by sector (household, business, goverment), by age or other
characteristics of households, by type of asset or liability, etc. For example, what has become to be called Denison's Law has led many people to suggest that gross private saving is the most appropriate variable to analyze for the economy, as households see through the corporate veil. I
have elsewhere argued that both the gross and net numbers should be examined and that there is little stability in the net private saving rate. An
asymmetric information model of the capital market which led to credit rationing would require a distinction between household saving and business saving, as the internal cost of funds to a firm would be less than external financing (see Stiglitz and Weiss (1981)). Various assets and liabilities have different liquidity, risk, expected duration, etc. These may also be
important for analyzing the performance of the economy.
We also make a brief reference to my own work with Lawrence Lau which suggests the potential importance of taking extreme care in analyzing aggregation issues for U.S. saving.
Section 4 turns to some specific issues. First, we turn to consumer durables and present augmented NIPA figures including durable purchases as saving and the rental flow from the stock of durables as consumption and income. We also mention government capital, including government tangible capital, government lending, government contingent and potential
liabilities, etc. Adjusted or augmented NIPA-type saving rates are also presented, including consumer durables and various components of government net capital formation. A comparison is made to Japan, to highlight the potential importance such adjustments make in international comparisons of saving rates.
We also discuss education and human capital, pension and Social Security wealth, estimates of income and its components, revaluations of financial assets and liabilities due to interest rate changes, or other factors, and inflation adjustment, as well as the saving by Americans abroad.
For each of these items, we simply raise the issues surrounding them and including them in an augmented, more comprehensive measure of saving,
discuss their rough orders of magnitude, and how they might affect the evolution of the saving rate in the United States and its comparisons with other countries.
Finally, Section 5 presents a brief conclusion. I conclude that we have come some distance to a better understanding of saving and wealth. I conclude that no single theory --
Keynesian,
permanent income, purelifecycle with no bequest motive or intergenerational altruism -
- is
sufficient by itself to explain aggregate saving in the United States. While each of these models of saving behavior lend important insights andcontain some elements of truth, none are sufficient by themselves, and all are strongly rejected in aggregate data.
We have also come a substantial way toward refining some of the adjustments to saving and wealth estimates which a more comprehensive
definition of saving would entail, and discovered that the interpretation of these data depends heavily upon one's model of the economy. No one number will be the answer to all questions. For example, while many of the
adjustments such as that for consumer durables, would raise the U.S. private saving rate, there would also be a corresponding entry on the investment side and would do nothing to redress the shortfall of saving relative to domestic investment which necessitates capital imports. We may be somewhat less anxious about the rate that Americans are acquiring claims to assets, but other concerns remain. Capital gains and losses such as those in the stock market, may partly explain swings in the traditional NIPA saving measures, both because consumption and saving are affected by changes in wealth and because of the institutional features of pension funds, the majority of which are of the defined-benefit type in the United States. This in turn implies that large swings in the stockmarket (and/or major
changes in interest rates) will substantially change contributions to these pension funds and hence personal saving.2
My penultimate conclusion is that the United States still has a low rate of saving (although not nearly so low as the traditional NIPA measure would reveal), and rate of wealth creation. We start from a high level of wealth, but on a per capita, or perhaps more importantly, on a per worker basis, the rate of wealth accumulation has slowed substantially. While
saving in the United States takes on a somewhat different composition than saving in other countries, we are only begirg to understand not just how
to measure it, but the implications thereof, and the policies and other factors which affect that composition. For all the advances made and the insights gained, there is still a substantial shortfall of national saving relative to domestic investment.
2. Definitions, Measures, Sources
The potential data on saving and wealth come from several, potentially complementary, sources. The three generic types of data used are the
aggregate data from the National Income and Product Accounts, the data from the Federal Reserve Flow of Funds, and household survey data. In addition, some information on wealth and its distribution has been derived from estate tax returns, usually federal but also state. The latter are particularly useful in dealing with a truncated sample of the upper tail of the wealth
distribution. The relative advantages and disadvantages of household survey data with respect to the NIPA and Flow of Funds data have been discussed in detail in several other studies (see for example, Curtin, Juster and Morgan
(1988)). Annual surveys chronically underestimate wealth and property income. While important advances have been made in attempting to aggregate up from household data, the quality, measurement error, sampling error, and other concerns are non-trivial. Further, to measure saving from household surveys, one would not generally be able to get an accurate measure of both income and total spending in order to get at saving by subtraction, and while surveys of saving behavior are more common in some other countries
(e.g. ,
the
annual Family Saving Survey and Family Income and Expenditure Survey in Japan) than in the United States, there are several surveys in which it is possible to analyze data on the same households at two different points in time and thereby attempt to create balance sheets at those two points in time and to difference them to get a measure of saving ordis saving.
Another issue is the gray area between the business sector and the household sector in which substantial saving occjrs --
nonprofits,
trusts,pensions, and other vehicles which may be either excluded from household surveys or where individual responses may be subject to considerable error (e.g., accrued net saving in life insurance). Important recent data from the 1983 Survey of Consumer Finances, the 1984 Wealth Supplement to the Panel Study of Income Dynamics, and the 1984 Wealth Supplement to the Survey of Income and Program Participation are all fruitful data sources.
Numerous other household surveys contain substantial information on property income, and the question arises how to aggregate it to the presumably more accurate national control totals such as those in the National Income and Product Accounts, and then to capitalize them or to translate them into asset values. This is most easily done for interest bearing assets of a fixed duration, and much more difficult to do for other
types of
assets and liabilities. Many of the recent studies of the dissaving behavior of the elderly (e.g., Hurd (1987), Bernheim (1984), Diamond and Hausman (1984), and others) attempt to make the best use possible of such household survey data. I shall say no more about this source of information ocher than that it is an important additional source which can be integrated with aggregate data on the one hand, anddisaggregated to provide details on distributions and characteristics that may be of great interest.
Before turning to NIPA and Flow of Funds saving estimates and the corresponding wealth estimates from the Flow of Funds, a few words concerning theories of saving and consumption and what sorts of data are consistent or inconsistent with them are in order.
The three leading theories of saving/consumption behavior are Keynesian
(KN) ,
lifecycle/permanent
income hypotheses (LCH/PIH), and intergenerational altruism (IGA). The Keynesian predilection to focus on short-run cash flows generally ignored capital gains and losses as components of income andfocused on the flow of saving out of current disposable income. In
contrast, the permanent income hypothesis attempted to disentangle permenant from transitory components and has vastly different predictions concerning the response of saving to permanent and transitory components of income (including transitory components due to fiscal policy changes).
Importantly, the lifecyle hypothesis suggests that the marginal propensity to save depends upon age and that demographics are important. This leads immediately to going beyond aggregate saving data to attempt to analyze the effects of the age distribution of the population or resources on saving and suggests the calculation of age or cohort specific balance sheets and saving rates may be quite useful in the analysis of trends in saving behavior and their responses to various policy experiments.
In sharp contrast to the LCH stands the strong implications of intergenerational altruism that aggregate consumption depends only on aggregate resources, not on their distribution across generations. Age
specific policies should have no impact on aggregate consumption and national saving, as private saving will adjust to public saving or
dissaving. The potential usefulness of household balance sheets and age specific saving rates for analyzing saving and its reaction to policy experiments is useful only in the context of testing Ricardian
equivalence/intergenerational altruism. If one accepts the strong tenets of Ricardian equivalence, the usefulness of the data disaggregated by age
disappears. In Boskin and Kotlikoff (1985), we build a finite approximation to an intergenerationally altruistic infinitely lived optimal consumption program and test whether the age distribution of resources affects
consumption, given the aggregate level of resources. We reject this
implication of Ricardian equivalence based on postwar U.S. time series data. In Boskin and Lau
(1988),
we develop age-cohort-specific balance sheets by combining Current Population Survey data on the age distribution of income with more usual aggregate variables. We estimate an economically important and statistically significant effect of the age distribution of human and nonhuman wealth on the share of aggregate wealth consumed. We also estimate a large, statistically significant generation effect: households headed by persons born since 1939 consume a larger share of their wealth than those born prior to 1939, at the same age. The strong implication of Ricardian equivalence is rejected.Most aggregate time series studies reject the simple Keynesian
specification of consumption and suggest that there is tax discounting, on the one hand, or at least a large fraction of the population is forward
looking and maximizing over a longer time horizon than the typical Keynesian short-run flows. For example, Hall and Mishkin (1982) conclude that about four-fifths of consumers could be modeled as if they are maximizing over a long time horizon, whereas one-fifth could not.
Studies of the dissaving behavior of the elderly have generally concluded that the strictest version of the lifecycle hypothesis, an expected average propensity to consume over the lifetime of one, is
inconsistent with the observed behavior, although Hurd (1987) presents data which are consistent with the LCH.
My own conclusion is that no single model of saving and consumption behavior is sufficient to explain aggregate saving fully. All of the
theories are rejected in studies based on aggregate time series data, and others usually rejected in other studies. There appears to be substantial heterogeneity among consumers. This heterogeneity may be a function of age, income and desired consumption profiles leading to liquidity constraints, or a host of social, psychological, environmental, historical and economic variables. I believe that there is now strong evidence that the age distribution of resources, given their aggregate level, affects aggregate consumption, and therefore there is some potential gain in attempting to integrate microeconomic (hopefully longitudinal) survey data on the
distribution of resources by characteristics of households with aggregate
data.
Saving is usually defined as foregoing current consumption and
providing funds either directly or indirectly to capital markets to channel into productive investment, whether in tangible, financial, or human
capital. it is a neat concept, but there are an inordinate number of difficulties in measuring it.
S, is equal to income minus consumption in that period,
minus C. Or,
(1)
S —
'' - C.
Hence, saving will equal investment ex post. From the Haig-Simon's definition of income,
(2)
Y —
C
+
(W
-W1)
income is the sum of consumption plus the change in net worth, the difference is the change in the value of assets and of liabilities. Therefore,
(3) S —
-or
saving equals the change in net worth. The problems in measuring saving (and when we integrate saving over a period of time, wealth) stem from difficulties in measuring Y, C, andand W1.
It is worth mentioning that so prominent an economist as Lawry Klein (1986) has argued that "the importance of saving tends to be understated if we treat it as a mere residual." Klein emphasizes that households make
genuine decisions about most asset and liability changes, whereas the residual concept was popularized from the Depression mentality as a typical representation of personal saving.
First, household saving in our national accounts is estimated as a residual, after subtracting consumer expenditures, taxes, and interest payments to business from estimated personal income. The measurement errors
in these components (each of which is potentially quite large relative to net saving), will show up dollar for dollar in net saving. Suppose, heroically, that we have a good estimate of income. Then errors in the measurement of consumption which may be quite small relative to consumption translate into larger percentage errors in the measure of saving, which is much smaller. I consider this to be a problem, but much less of a problem
than measuring income. Suppose we measure consumption properly, but mismeasure, say underestimate, income. Then in general, saving will be
underestimated dollar for dollar. Again, I consider this to be an extremely important issue, perhaps the most important one. Numerous studies suggest that income is substantially underestimated in the national income accounts. The BEA makes an adjustment to personal income related, apparently, to IRS estimates of under reported adjusted gross income. While the range of estimates of this underestimation is substantial (see Feige (1985)), I believe it is not trivial.
One extreme set of estimates based on a transactions methodology (Feige (1983)) estimates that while unrecorded income was trvial in the 1950s and 1960s, by the late 1970s and early l98Os, it amounted to 40% of GNP. An unrecorded income which was primarily saved of even one-tenth this size would raise the net private saving rate by 80%, from 5% to 9% of GNP! If net private saving runs about 250 billion dollars per year, and gross private saving about 600 or 700 billion dollars per year, a few percentage point underestimate of income will lead to a serious underestimate of
saving. A related problem may be the understatement of the income earned and saving done abroad.
What are the likely reasons for underestimating income? A good discussion of some of these issues is presented in Holloway (1988); it includes where one draws the boundary in the GNP accounts (e.g. ,
placing
emphasis on market transactions with only a few imputations, excluding illegal activity, excluding capital gains, to which we will return below). Much has been made recently of the underground economy, and estimates of the size of the underground economy vary by two orders of magnitude.3 This includes illegal activity and activity that is deliberately unreported, usually for tax reasons, such as cash payments for services that go
unreported. To the extent that personal income is seriously understated, we would expect the degree of underreporting to be positively correlated with marginal effective tax rates. arro and Sahasakul (1983) estimate that the fraction of U.S. households subject to high marginal tax rates quadrupled between 1965 and 1980. While marginal tax rates have come down some since then, this suggests that by the late 1970s and early 1980s the
underreporting of personal income had probably grown substantially.
P,ut is personal income that underreported? Since comsuniption is two-thirds of income, and is estimated from transactions, some of the incone which is unreported for tax purposes does show up in transactions.
eventually working its way back into the income figures.
Still, the net degree of underreporting of personal income is a source of some concern, especially since there is reason to believe that it has grown substantially over precisely the period in which there is great concern about the fall in the saving rate. Finally, a word should be said about international comparisons. Since U.S. marginal tax rates are now much lower than those in most other advanced economies, we would expect the degree of underreporting and the underground economy to be somewhat less in
the United States then in these countries. But this is only conjecture, for this will reflect social attitudes, the nature and resources devoted to tax enforcement, etc. and on this I believe we have little evidence. In any
event, I believe it is a fruitful area for future research. As already noted, the NIPA measui of saving excludes net capital gains or losses in its measure of saving, as in its measure of income.
A third problem is the treatment of expenditures on consumer durables as consumption rather than as saving. Finally, the treatment of government saving or dissaving in the U.S. National Income and Product Accounts is a rather mechanical reporting of the budgetary position, with no attempt to develop a separate capital account on the expenditure side for government units in reporting a surplus or deficit on current operating accounts. The federal government's own budget suffers from this difficulty, but the Department of Commerce does attempt to estimate government capital stocks, investment, and depreciation. We will return to these two issues in Section 4 below.
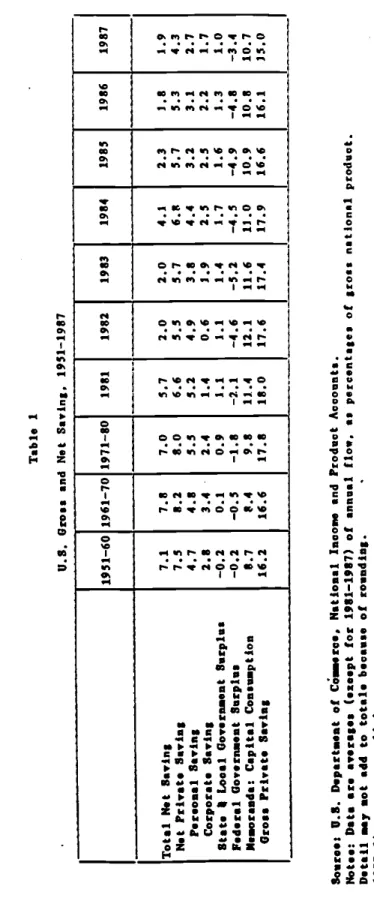
Let us turn to the NIPA saving figures for the United States. Table 1 presents estimates of gross and net national saving and its components in the United States from 1951-1987, Net saving is decomposed into private saving, the state and local government surplus and the federal government surplus. Private saving in turn is decomposed into personal and corporate saving. Numerous conjectures have been made concerning whether the
appropriate rate to study is net or gross, private or total, or disaggregated personal and corporate saving. For example, David and
Scadding (1974) find that the gross private saving rate at full employment is remarkably constant, reinforcing the finding of Denison (1958) . They
infer from this that households see through the corporate veil and that movements between personal and corporate saving reflect various factors such
as changes in the relative tax advantages of the two forms of saving.
However, they strongly reject the ultra-rationality argument that households see through the government veil, an argument associated with Martin Baily (1962) and Robert Barro (1974).
Recent theoretical work on credit markets (e.g., Stiglitz and Weiss (1981)) suggests that maintaining the distinction between household and corporate saving may be quite important. Asymmetric information may lead to a situation where the cost of internal funds is substantially below the cost of external funds, and therefore corporate cash flow may be an important
separate determinant of business investment, a result consistent with investment equations in many large macroeconometric models. If this is the case, it may be important for some purposes not to aggregate private saving.
Further. focusing on gross saving and its apparent stability -.
although
it has not been as stable through 1987 -- seems
odd since virtually all theories are in terms of how households, firms, and even governments wish to form their net wealth position. In brief, any rationalityhypothesis seems somewhat out of balance if it ignores the fact that
depreciation is estimable. There is much less stability in the net private saving rate and in the net national saving rate than the corresponding gross figures.
The most important items to note in Table 1 are the levels of gross and net saving, which are low relative to that of other societies (see glades and Sturm (1983)), and the substantial decline in the net private saving rate, and especially the net national saving rate in the l980s relative to the 1950s, 1960s and 1970s. These data undoubtedly form the most important
basis
for concern over the level and trend in private and national saving in
As noted above in equation (3), saving can also be defined as the change in net worth. An alternative approach to measuring saving may be obtained from estimates of sectoral and national net worth through time. The Federal Reserve's year end balance sheets for the U.S. economy provide
just such a source of data. Recall that the National Income and Product Account saving and income measures exclude capital gains and losses. These are, in principle, captured by the Federal Reserve's Balance Sheets, which should also reflect some wealth accumulated in the underground economy. The Flow of Funds data have their own problems, both internally and relative to household surveys and the NIPAs (see, e.g. ,
Curtin,
Juster and Morgan (1988) and Wilson, Freund, Yohn and Lederer (1988)). Among the more important arethat bonds are carried at par (in recent years, the changes in the value of bonds will not necessarially net internally given the increase in foreign
holdings) , and the rudimentary treatment of the government sector in the
Flow of Funds -
- in
particular, as with the NIPA, there is no attempt to estimate changes in the value and the imputed income from government tangible capital. (I ignore the even thornier problem of contingent and potential liabilities and intangible capital discussed below.) The Flow of Funds Balance Sheets, however, do attempt to record the current value of all. assets and liabilities in the economy, such as owner-occupied housing,consumer durables, inventories and depreciable plant and equipment. In principle, the FOF not only includes traditional gains and losses, but
revaluations of real assets caused by depreciation, obsolescence or other sources. For business tangible capital, the estimates are of the
replacement cost, not the current market value. Hence, when Tobin's q diverges systematically from one, the Flow of Funds data may over-or-understate the value of tangible business capital.
inflation, with the net worth data as year end figures, we need to estimate saving in current dollars as
(4)
S —
- 1't''t-l
where is an index of prices. Because these are end of year data, I use the December consumer price index. There are numerous reasons why other indices might be more appropriate, but it is much more difficult to obtain them on a year end basis rather than quarterly or an average over the year.
The Flow of Funds also presents considerable disaggregation with respect to the sector (e.g., households, nonfinancial corporations,
government units. etc.), and type of assets and liabilities. We present in Table 2 the private, public and national saving rates as a percentage of GNP
from the period 1948-1987. These data reveal some interesting differences relative to the data in Table 1. While they are usually substantially higher, they vary quite a bit more, and as they reflect changes in asset values, are even negative on occasion (for example, see national saving in
1982 and 1985). Table 3 presents estimates on a decade by decade average basis for private public and national saving. The net private saving rate
in the l950s is more than 150% as large as that reported in the NIPA. In the 1960s, it is somewhat larger, although it had fallen somewhat relative to the 1950s. The net private saving rate from the Flow of Funds rebounds in the 1970s and again, is more than one and one-half times that of the corresponding data from NIPA. The data for the first half of the 1980s from the Flow of Funds reveals the tremendous fall in both the private saving rate, and the national saving rate. As Table 3 reveals, the public saving rate was about zero in the 1950s, 1960s, and 1970s, as traditionally
measured budget deficits in the 1970s were offset by accumulation
of
financial
assets by the public sector. The net national saving rates, therefore, are almost identical with the net private saving rates, and again, are much larger than the NIPA numbers. Net national saving has fallen tremendously in .he 1980s, as both net private saving has fallen and the public sector has turned into a dissaver, even when one accounts for its accumulation of financial assets (although not of tangible assets).Let us now turn our attention to measures of wealth and the rate of growth of wealth. Table 4 presents estimates of private, public and national net worth in billions of constant 1982 dollars, for the period 1948-1987, derived from the Flow of Funds. Recall that the public sector data include only financial assets, not tangible assets. These data suggest that private real net worth has more than tripled in the period 1948-1987, and that national real net worth has almost quadrupled in the same period. On a per capita basis, real net worth has about doubled.
Table 5
presents estimates of the rate of growth of net worth (i.e.
the
rate of change of net worth, both private and national). This reflects the rate of private and national saving in the numerator, includingrevaluations, and the pre-existing level of net worth in the denominator. While
there
is substantial year-to-year variation in both the private and national growth rates of net worth, it is clear that the rate of growth of realnet worth in the
U.S. economy has slowed substantially inthe period
1979-1987
relative to any other extended subperiod since World War II.Perhaps the most serious omission from these measures of net worth is
that
they reflect only nonhuman capital. The capitalized value of expected futureearnings, human wealth,
is not included. There have been manyattempts
to estimate measures of human wealth, and/or to incorporate them in
(1988), Jorgenson and Fraumeni (1988)). There are many difficulties in obtaining such estimates, including capitalization rates, the appropriate expected earnings process for forecasts, questions of differential risk, discounting, liquidity, bequeathability, etc. Roughly speaking, about
three-quarters of national income is a return to labor; ignoring all these differences would suggest that about three-quarters of total wealth would be human wealth. Of course, mortality, disability and similar probabilities
must be added to discount rates on future earnings; there is differential taxation of different sources and uses of income (although these have
declined with the new tax law), etc. Human wealth must be estimated in more indirect ways than many components of nonhuman wealth whose asset values can be determined via the market.
Finally, in discussing definitions, measures, and data needs, it is important to realize that the economy changes. The pace at which we want to augment or update measures of saving and wealth, or reclassify items, etc., depends heavily upon the purpose in generating the data in the first place.
3. Aggregation and Disaggregation
Discussed above was the issue of whether to combine the household and corporate sectors following Denisons Law, as enunciated and reconfirmed (as of that time) by David and Scadding (1974)), or at the other extreme,
whether to separate household and business saving because of credit
rationing. Additional distinctions might be drawn on the type of assets and liabilities, for example, their liquidity properties, fixed costs in
shifting in and out of them, their duration, etc. We also mention that a strong Ricardian might aggregate all resources, ignoring their age
and private capital, might even aggregate private and public saving, and focus only on national saving, as changes in public saving or dissaving might be exactly offset according to the theory by private saving.
The purpose of this section is to highlight two other issues of
aggregation. First, within the household sector there have been tremendous changes in household formation, dissolution, the age structure of
households, average household size, life expectancy, and household
composition. Particularly when we begin to analyze consumer durables, the value of housing, and lifecycle or age-specific balance sheet data, it is
important to keep these changes in mind. For example, Boskin and Lau (1988) document that slightly more than half of the average annual percentage
increase in real consumption in the period 1950-1980 was due to the growth in the number of households as opposed to the annual percentage increase in real consumption per household.
Thus, one might wish to decompose changes in the aggregate saving rate into the sum of the rates of change per household and the rate of change in the number of households. We know, for example, that in equation (1) that
St —
:.ii: ii:
where we index households of type i, age j in year t. The households might differ by size, asset values, net worth, or access to credit markets, family composition, etc.; age may be important for lifecycle or other reasons. We know from survey data that some households are saving and others dissaving, and that the aggregate saving rate is the sum of these household-specific
saving rates. Probing a little deeper, changes in saving caused, for example, by changes in an exogenous (to the household) variable z, we note
that the elasticity of aggregate saving with respect to z is a weighted average of the percentage changes of the saving of the different household types with respect to the given percentage change of the variable for them, with the weights being the share (possibly negative) of aggregate saving accounted for by that type, or mathematically
dm5.
jt
d2nS
L
N.jStt
dmnz
—
j
dlnz t Sijtij
where N.. refers to the number of households of type i and age j in year t and to the saving or dissaving of a household of type i, age j in year t.
Thus, analyses of aggregate saving must come to grips with the problems of aggregation to the extent that households are heterogeneous (see
Jorgenson, Lau and Stoker (1982) and Boskin and Lau (1988)). Quite apart from Lucas-type critiques, analyses of the effects of various variables on aggregate saving may be quite misleading if the shares of saving, or of
income and wealth, held by households of different types and ages change through time. We know, for example, there have been tremendous changes in the age distribution of income in the United States (see, e.g., Boskin, Kotlikoff and Knetter (1985)). Perhaps the most important aspect of this change has been the tremencous increase in the relative economic well-being of the elderly, which some theories of saving suggest should be dissaving during retirement.
4. Some Specific Issues
durables as consumption rather than as saving. Many have argued (and I have generally been sympathetic to the argument) that it would be preferable to treat expenditures on consumer durables and the imputed rental flow of the durables as consumption (see David and Scadding (1974), Roskin, Robinson and Huber (1988), Holloway (1988), Hendershott and Peek (1988), among others). Recall that estimates of the value of consumer durables are included conceptually in the Flow of Funds estimates. Various issues arise in valuing the services of consumer durables (Katz (1983)). We present in Table 6 NIPA saving rates augmented to include consumer durables for a few years. Note that this adds about 5 percentage points to the NIPA estimate of gross saving. Of course, as mentioned in the introduction, it would also be included on the investment side, and does nothing for the shortfall of our domestic saving relative to our investment. U.S. citizens invest much more in consumer durables than persons in other societies. This undoubtedly
reflects a number of factors, including the size of homes, etc. The difference is particularly important relative to Japan, where the durables adjustment closes the saving rate differential substantially (see Table 6 for some comparisons with Japan including durables adjustments and also government capital). It might well be useful for the REA to supplement (not replace) the current saving data with such estimates for durables.
Government tangible capital, as well as contingent and potential
liabilities, are also of potential importance. Governments in all countries own, use, and provide services from, capital. Differences in the rates of growth of public capital, and differences in levels across societies, can lead to misconceptions about aggregate national well-being and aggregate saving rates. Of course, government saving and investment does not pass the same kind of market tests as private saving and investment. InBoskin,
Robinson and Huber (1988), new estimates of government saving, capital formation, and wealth for the United States in the period 1947-1985 are estimated. Table 6 includes estimates of NIPA saving figures augmented to include net government saving in the form of nonmilitary capital and total capital. Again, the saving rate rises several percentage points, but recall that government capital depreciates and that our ability to estimate that depreciation is subject to even more difficulties than our ability to estimate the depreciation of private tangible assets. The comparison with Japan is instructive, since government military capital formation in the United States is substantially larger, but total government capital
formation is substantially smaller, than in Japan as a percentage of GNP. Revaluations of assets and liabilities are presumably captured approximately by market values and represented in the Flow of Funds.
Obviously, they do not do so precisely. Estimated revaluations of tangible capital for the NIPA estimates would be adjusted upward, reflecting
generally positive real revaluations. These are caused by a variety of factors, but especially the decline in investment goods prices relative to the overall price level. Revaluations of financial assets and liabilities other than general real interest rate changes should net internally as one household's capital gain is another's capital loss, or conversely, between the public and private sectors. Of course, a general mood of pessimism or optimism tending to change the rate at which future incomes are discounted could cause a substantial overall revaluation. Further, to the extent that there are foreign holdings by Americans and holdings of U.S. assets by
foreigners the real revaluations will not necessarily cancel for the US. as a whole. Indeed, the saving abroad by U.S. citizens is quite difficult to measure.
income was undoubtedly a major issue in the measurement of saving. Under reporting, as well as measurement errors, play a role and are likely to change systematically over time. The measurement of real income is even more difficult. Distortions caused by inflation create difficulties in computing changes in real corporate balance sheets, as well as other
components of income. It is beyond the scope of the paper to go into detail here, but not only is the measurement of real income tremendously difficult and important (especially for corporate profits) but an appropriate real cost-of-living index would include the price of future consumption in it, and this obviously varies with the ex ante expected real net (of taxes) rate of return, which has varied over time.
Human capital, whether in education, health, nutrition, etc. ,
has
been discussed very briefly above. Clearly, the United States spends a much larger fraction of its CNP on education than most other societies. This is especially true for higher education. Difficulties of comparability,however, abound. It is alleged, for example, that students in the U.K. or Japan are much further along when they finish high school than our students. A distinction between investment and consumption in educational expenditures is not easy to draw empirically. Estimates of the rate of return must rely on some estimate of the amount of such investment, and thus a certain amount of indirection is necessary in obtaining estimates. Despite improvements in correcting for sample selection bias, etc., we are still some distance from estimating gross investment and saving in human capital. Some estimates, e.g., Kendrick (1976), place the amount of human capital investment at approximately the same level as nonhuman investment in the economy. Estimating net saving and investment in human capital is even more
on the job, depreciate or become obsolete? Clearly, unlike financial assets, or tangible nonhuman capital, they cannot be bequeathed, although they may be an input into human investment in ones children. Again, I refer the interested reader to Jorgenson and Fraumenti (1988), and perhaps just as importantly, its discussion by Rosen (1988) to gain a feel for some of the issues involved.
The appropriate treatment of private pensions in saving statistics is a subject of much dispute. Currently, for example, employer contributions of defined-benefit pension plans show up in the private saving statistics. Some have argued for a concept of pension wealth, i.e., the expected present value of future pension payments. An analogous argument has been made for Social Security. It Is not our purpose here to review the voluminous
literature of the potential impact of Social Security wealth on real economic activity such as saving choices, or the analogous literature on private or state and local and other government non-fully funded
liabilities. At various points in history, currently unfunded liabilities have been large, subject to substantial variation depending upon assumed
patterns of economic and demographic trends and subject to enormous change through minors changes in the rules relating to benefit calculations or taxes. Further, social security has begun a systematic move away from pay as you go finance toward building an historically large surplus.
How to define the expected obligations of the Social Security system, for example, is also open to much controversy. Under a closed group
approach, the expected future taxes and benefits paid by particular cohorts. for example, all those alive or all those currently above a certain age, such as 18, would be calculated, discounted to the present, and compared. The difference between the expected present value of benefits and taxes would be the surplus or deficit. This concept, using current participants
as a group, is adopted by Arthur Anderson & Co (1986). Such an estimate would add $100 billion or more per year to the federal government deficit. Likewise, to the
extent
there were accruing unfunded liabilities in state and local government or private pension funds, these would need to be netted out (to the extent that they were not netted explicitly or via marketvaluation of corporate equities in Flow of Funds or other data). Recall that the state and local surplus in recent years has been over one percent of CNP, but that much of it is in their pension funds, whose simultaneously accruing liabilities are not included in the national saving statistics.
Under an open group concept, the expected present value of benefits and taxes paid over some time period, often taken to be 75-year actuarial
projection period of the Social Security Administration, would be compared with the difference being the surplus or deficit. Thus, taxes paid in the early working years of the currently unborn and benefits paid to persons during retirement who are not yet in the labor force would be counted, While the Social Security system in the United States, as well as most other
advanced economies, has become so large, and contains so many features, including insurance features, it may well affect private saving behavior, I believe the best we can do is provide some supplemental information to the
traditional NIPA treatment of Social Security in the budget, simply netting the excess of taxes over outlays as positive government saving, currently offsetting the larger deficit in the non-Social Security part of the budget. The substantial unfunded liabilities I have dealt with elsewhere (see
Boskin, Robinson and Huber (1988)).
I do not think it is sensible to include OASI contributions as part of personal saving, as suggested by Hendershott and Peek (1988). This would double the net private saving rate, but while it is true that some
individuals believe that their contributions are a sort of saving, legally and by nature of the formulae in use at any point in time, there is no necessary relationship between an individual's marginal contribution and their own marginal returns. Of course, for the nation as whole, the aggregate saving is captured by the difference in the cash flow in the system plus (by no means easy to estimate) the change in expected real net accrued liabilities. For those interested in the relationship of marginal Social Security taxes paid and expected marginal benefits for households of different income levels, family type and ages, see Boskin, Kotlikoff,
Puffert, and Shoven (1987).
I do not have the space to go into contingent liabilities by sector, such as those generated in the thrift industry or pension plans. The nature of deposit and pension insurance is to provide a put option and create a heads I win tails the taxpayer loses type situation, which may encourage excessive risk.taking. I have dealt with these issues in the context of a more appropriate budgetary treatment elsewhere (Boskin, Rarham, Cone and Ozler, (1987)).
5. Conclusion
My conclusion is quite simple: We have come some way toward
understanding, measuring, interpreting, and analyzing saving and wealth. While there is a substantial need for continued research into analyzing saving behavior and wealth accumulation, the following conclusions deserve emphasis:
1. While the United States has a saving rate which is low by
historical and international standards, that saving rate is substantially higher when more comprehensive measures of saving are developed. While there are substantial difficulties in developing such augmented measures of
national saving, various data sources and estimation methodologies all conclude that adjustments for net saving in durables, government capital, capital gains and losses, revaluations, etc. are substantial.
2. The adjustments for durables and government capital are likely to narrow the saving rate gap between the United States and Japan, and to a lesser extent between the United States and the European economies. This reduction in the "saving rate gap" is much greater for gross saving than net saving.
3. No one saving rate measure is the answer to all questions one might pose about saving and wealth accumulation. Often there will be offsetting
tendencies by sector, asset type, etc. A decrease in the traditional NIPA saving figures may reflo-t a rise in the stock market which may decrease saving either because of direct adjustment on the part of households or mechanical adjustments due to the actuarial formulae for pension plans. 4. The reasonable, even permissable, level of aggregation, across types of households, ages of households, sectors of the economy, and types of assets and liabilities, depends heavily upon one's prior beliefs
concerning an apropriate model of the economy (for example, of credit markets in deciding whether to combine household and corporate saving, and of household behavior in deciding whether to analyze private saving and government saving separately from national saving).
5. Innumerable technical issues remain, ranging from appropriate deflators to valuation in nonmarket situations. 1''hile these often revolve around technical issues, they also involve components of saving and of
wealth which can be large relative to the more traditional components, e.g. social security, the contingent liabilities of the banking system, etc. The remarkable change in the U.S. net international lending position in recent
years suggest that the traditional argument that most capital gains and losses, and revaluations, will net internally is no longer accurate.
6. Perhaps the most important measurement issue for traditional saving estimates is improving the measures of personal income to include as much unrecorded income as plausible.
7. supplementing the aggregate data with age cohort specific data may be of great value.
At the last Conference on Research in Income and Wealth many of these issues were addressed for the economy as a whole or for important subsectors of the economy, and important subsets of these issues. I have no doubt whatsoever that when future generations of economists celebrate subsequent major anniversaries of the Conference on Research in Income and Wealth, they will bear witness to considerable additional value added in measuring,
Table 1 U.S. Gross and Net SavIng 1951—1987 1951—60 1961—70 1971—80 1981
1982
1983 19841985
1986
1987
Total NitSavIng
7.1
7.8
7.0
5.7
2.0
2.0
4.1
2.3
J.8
1.9
Nit
Private S.ving 7.5 8.2 8.0 6.6 5.5 5.7 6.8 5.7 5.3 4.3 Personal Saving 4.7 4.8 5.5 5.2 4.9 3.8 4.4 3.2 3.1 2.7 Corporat. Saving 2.8 3.4 2.4 1.4 0.6 3.9 2.5 2.5 2.2 1.7 St.t. I Local Oovsrn*.nt Surplus —0.2 0.1 0.9 3.1 1.1 1.4 1.7 1.6 1.3 1.0 F.d.ralGo,.rnnent
Surplus —0.2 —0.5 —1.8 —1.1 —4.6 —5.2 —4.5 -4.9 —4.8 —3.4 JI..ora.da: Capital Consuaption 8.7 8.4 9.8 11.4 12.1 11.6 .11.010.9
10.8
10.7
Gross
Privats Saving 16.2 16.6 17.8 18.0 17.6 17.4 17.9 16.6 16.1 35.0 Sour..US.
D.pirt.ent ofCoirc..
National Income and Product Accounts. Not..: Data an, averages (.zospt for 1981—1987) of annual flow, as percentage, of gross national product. D.t.Il mey not add to totals b.cause of rounding. 1987 figuns. are preli.inary.Table 2
Sectoral Savings Rates
(% of GNP)
Year
J
Private Public National
1948 15.5 5.0 20.5 1949 23.9 -3.8 20.1 1950 6.6 6.7 13.3 1951 9.8 4.8 14.6 1952 15.2 -1.2 13.9 1953 12.1 -1.9 10.2 1954 15.8 -2.8 13.0 1955 20.0 0.0 20.0 1956 15.6 1.7 17.3 1957 6.4 0.9 7.3 1958 9.3 -2.6 6.7 1959 10.3 -0.6 9.7 1960 7.3 0.5 7.7 1961 9.1 -1.5 7.5 1962 8.5 -0.9 7.6 1963 5.5 0.2 5.7 1964 13.2 -0.6 12.6 1965 10.8 0.3 11.1 1966 14.2 0.6 14.8 1967 9.6 -1.2 8.4 1968 12.0 0.0 12.0 1969 5.1 1.6 6.7 1970 2.5 0.1 2.7 1971 14.0 -2.0 12.1 1972 16.4 -0.4 16.0 1973 11.2 2.3 13.5 1974 12.5 2.1 14.6
1975
9.3 -3.3 6.0 1976 20.1 -1.8 18.3 1977 19.6 -0.1 19.4 1978 20.3 0.7 21.0 1979 2.5 2.1 4.7 1980 2.5 0.3 2.8 1981 9.6Ø4
9.2 1982 -5.3 -3.9 -9.2 1983 11.1 -4.4 6.6 1984.2
-3.3 3.9 1985 1.6 -3.6 .2.0 1986 16.2 -4.7 11.5 1987 5.9 -2.6 3.3Source: Author's calculations froze National Balance Sheets,
Source: Author's calculations.
Table 3
Sectoral Average Saving Rates
(% of CNP)
Years
J
Private Public National
1951-60 12.2 -0.1 12.0
1961-70 9.0 -0.1 8.9
1971-80 12.8 0.0 12.8
table 4
Net Worth in Billions of 1982 Dollars
Year
Private Public National1948 $3906.1 $-831.2 $3074.9 1949 4167.0 -873.0 3294.1 1950 4241.8 -797.2 3444.7 1951 4362.9 -738.2 3624.7 1952 4558.3 -754.2 3804.1 1953 4721.8 -779.7 3942.1 1954 4936.4 -817.9 4118.5 1955 5231.2 -817.3 4413.9 1956 5467.1 -791.1 4676.0 1957 5566.3 -777.2 4789.1 1958 5709.8 -817.8 4892.0 1959 5879.9 -828.4 5052.0 1960 6002.4 -820.3 5182.1 1961 6160.1 -846.9 5313.3 1962 6316.7 -862.8 5454.0 1963 6422.6 -859.8 5562.8 1964 6691.4 -872.0 5819.4 1965 6925.6 -865.7 6059.9 1966 7251.1 -851.5 6399.6 1967 7475.8 -878.8 6596.9 1968 7770.4 -879.6 6890.8 1969 7896.7 -838.6 7058.1 1970 7959.8 -835.4 7124.4 1971 8327.2 -886.8 7440.4 1972 8784.4 -897.5 7886.9 1973 9106.8 -832.7 8274.1 1974 9452.8 -774.0 8678.8 1975 9714.2 -867.8 8846.4 1976 10315.9 -922.6 9393.3 1977 10927.8 -926.4 10001.4 1978 11586.4 -902.6 10683.8 1979 11667.1 -834.9 10832.3 1980 11745.9 -827.1 10918.7 1981 12050.6 -839.5 11211.1 1982 11883.4 -962.9 10920.5 1983 12246.2 -1108.5 11137.6 1984 12496.9 -1223.9 11273.1 1985 12553.9 -1352.9 11201.1 1986 13158.9 -1528.0 11630.9 1987 13382.8 -1626.1 11756.7
Table 5
Pate of Growth of Net Worth (Percentage Points)
Year
Private INational
1948 4.2 7.1 1949 6.3 6.7 1950 1.84.4
1951 2.8 5.0 1952 4.3 4.7 1953 3.5 3.5 1954 4.3 4.3 1955 5.6 6.7 19564.3
5.6 1957 1.8 2.4 1958 2.5 2.1 1959 2.9 3.2 1960 2.0 2.5 1961 2.6 2.5 1962 2.5 2.6 1963 1.6 2.0 1964 4.0 4.4 1965 3.4 4.0 1966 4.5 5.3 1967 3.0 3.0 1968 3.8 4.3 1969 1.6 2.4 1970 0.8 0.9 19714.4
4.2 1972 5.2 5.7 1973 3.5 4.7 1974 3.7 4.7 1975 2.7 1.9 1976 5.8 5.8 1977 5.6 6.1 1978 5.7 6.4 1979 0.7 1.4 1980 0.7 0.8 1981 2.5 2.6 1982 -1.4 -2.7 1983 3.0 1.9 1984 2.0 1.2 1985 0.5 -0.6 1986 4.6 3.7 1987 1.7 1.1Table 6
Augmented Saving Rates, U.S.
and Japan, Selected Years,
U.S.
GrossSaving
Rates (Gross National Saving/GNP)U.S. Saving 1950 1960 1970 1980 1985 11.7 13.2 8.2 10.6 6.2 8.2 7.7 8.5 4.7 5.5 14.6 11.8 10.9 11.1 8.8 8.7 8.7 9.2 7.0 8.8 1970 22.8 30.9 22.6 31.6 23.1 31.7 23.2 1975 14.7 21.1 21.6 21.7 1980 13.2 19.8 20.2 20.4 1984 14.4
1GNP and NNP augmented to include corresponding rental flows.
Sources: U.S.: Boskin, Robinson and Huber (1988); Japan: Boskin and Roberts (1986).
Exclude Govt
Nonmilitary
Investment
(NIPA Basis)
1950 1960 1970 1980 1985 Include GovtNonmilitary
Invstnt in Fixed
Reproducible
Capital
(OECD Basis)Include Govt
Nonmilitary
Invstmt
in Fixed Reproducible Capital & Consumer Durables 17 .8 15.0 13.8 16.4 13.81
All
Govt.Invstmt
& Consumer Durables
23.9
22.9
21.8
24.0
24.3
20.3 18.3 16.8 18.1 15.5 24.7 21.9 21.3 23.2 22.2REFERENCES
Arthur Anderson & Co. 1986, Sound Financial Reporting in the U.S. Government: A Prerequisite to Fiscal Responsibility.
Auerbach, A., 1982, "Saving in the U.S.: Some Conceptual Issues," in P. Hendershott ed., The
Level
and Composition of Household Saving, Cambridge: Ballinger Publishing.Bailey, M.J. 1962, National Income and the Price Level, New York: McGraw-Hill.
Barro, R.J. ,
1974,
"Are Government Bonds Net Wealth?" Journal of PoliticalEconomy, November/December, 82:1095-1117.
Barro, R.J. and C. Sahasakul, 1983, "Measuring the Average Marginal Tax Rate from the Individual Income Tax," Journal of Business, October, 56:419-452.
Bernheim, 8.D. ,
1984,
"Dissaving After Retirement," NBER Working Paper No.1409.
Bernheim, B.D. ,
1987,
"Ricardian Equivalence: An Evaluation of Theory andEvidence," Macroeconomics Annual 2. 1987, Cambridge: NBER.
Bernheim, ED. and J.B. Shoven (1988), "Pension Funding and Saving," in Z. Bodie, J.B. Shoven, and D.A. Wise, eds., Pensions in the U.S. Economy, Chicago: University of Chicago Press.
Blades, D.W. and P. Sturrn, 1982, "The Concept and Measurement of Savings: The United States and Other Industrialized Countries," in Saving and Government Policy, Federal Reserve Bank of Boston Conference Series, No.
25.
Boskin, M.J., 1982, "Federal Government Deficits: Myths and Realities," American Economic Review, May, 72:296-303.
Boskin, M.J. ,
1986,
"Theoeretical and Empirical Issues in the Measurement,Evaluation, and Interpretation of Postwar U.S. Saving," in G.F. Adams and S.M. Wachter, eds., SavinEs and Camital Formation: The Policy Options, Lexington, Massachusetts: Lexington Books.
Boskin, M.J., 1988, "Concepts and Measures of Federal Deficits and Debt and Their Impact on Economic Activity," in K.J. Arrow and M.J. Boskin, eds., Economics of Public Debt, Macmillan, forthcoming.
Boskin, M.J., 1988, "Consumption, Saving, and Fiscal Policy," American Economic Review, May, 78:401-407.
Boskin, M.J., B. Barham, K. Cone and S. Ozier, 1987, "The Federal Budget an. Federal Insurance Programs," in M. Boskin, ed., Modern Develovments In
Boskirt, M.J. and L.J. Kotljkoff, 1985, "Public Debt and
U.S. Savings: A New
Test of the Neutrality Hypothesis," in K. Brunner and A.H. Metzler, eds. Carnegie-Rochester Conference Series on Public Po],icy: The "New MonetaryEconomics." Fiscal Issues and Unemployment, 23:55-86.
Boskin, M.J., L.J. Kotlikoff, and M. Knetter, 1985. "Changes in the Age Distribution of Income in the United States. 1968-1984," NBER WorkingPaper No. 1766.
Boskin, M.J., L.J. Kotlikoff, D.J. Puffert, and J.B. Shoven, 1987, "Social Security: A Financial Appraisal Across and Within Generations," National Tax Journal, March, 40:19-34.
Boskin, M.J. and L.J. Lau, 1988, "An Analysis of Postwar U.S. Consumption and Savings Behavior," mimeo, Stanford University.
E,oskin, M.J., M.S. Robinson, and A.M. Huber, 1988, "Government Saving, Capital Formation and Wealth in the United States, 1947-1985," in R. E. Lipsey and Helen Tice, eds. , The Measurement of Saving. Investment and Wealth, Chicago: University of Chicago Press, 1988.
Boskin, M.J., M.S. Robinson, and J.M. Roberts, 1986, "New Estimates of Federal Government Tangible Capital and Net Investment," in D.W. Jorgenson, ed. ,
Technology
and CalDital Formation, forthcoming.Boskin, M.J. and J.M. Roberts, 1986, "A Closer Look at Saving
Rates in the United States and Japan," Washington: American Enterprise Institute Working Paper No. 9.
Curtin, R.T., FT. Juster, and J.N. Morgan, 1988, "Survey Estimates of Wealth: An Assessment of Quality," in R.E. Lipsey and H.S. Tice, eds., The Measurement of Saving. Investment and Wealth, Chicago: University of
Chicago Press, forthcoming.
David, P.A. and J. Scadding, 1974, "Private Saving: Ultrarationality, Aggregation, and 'Denison's Law,'" Journal of Political Econorriy.
March/April, 82:2252L+9.
Denison, E.F. ,
1958,
"A Note on Private Saving," Review of Economics andStatistics, August, 40:261-267.
Diamond, P.A. and J.A. Hausman, 1984, "Individual Retirement and Savings Behavior," Journal of Public Economics, February/March, 23:81-114.
Feige, E.L. ,
1983,
"The Meaning of the "Underground Economy" and the FullCompliance Deficit," in W. Gaertner and A. Wenig, eds. ,
Studies
in Contemporary Economics: The Economics of the Shadow Economy, Berlin: Springer-Verlag.Hall, R.E. and F.S. Mishkin, 1982, "The Sensitivity of Consumption to Transitory Income: Estimates from Panel Data on Households," Econometrica, March, 50:461-481.
Hendershott P. and J. Peek, 1988, "Private Saving in the United
States: 1950-85," in RE. Lipsey and H.S. Tice, eds. , The Measurement of Savtn. Investment and Wealth, Chicago: University of Chicago Press, forthcoming.
Holloway, T.M. ,
1988,
"Present NIPA Saving Measures: TheirCharacteristics and Limitations," in RE. Lipsey and H.S. Tice, eds. , The Measurement of Saving. Investment and Wealth, Chicago: University of Chicago Press, forthcoming.
Hurd, M., 1987, "Savings of the Elderly and Desired Bequests," American Economic Review, June, 77:298-312.
Jorgenson, D,W. and B.M. Fraumeni, 1988, "The Accumulation of Human
and Nonhuman Capital, 1948-1984," in R.E. Lipsey and H.S. Tice, eds., The Measurement of Savinz. Investment and Wealth, Chicago: University of Chicago Press, forthcoming.
Jorgenson, D.W. ,
L.J.
Lau, and TM. Stoker, 1982, "The Transcendental Logarithmic Model of Aggregate Consumer Behavior," Advances inEconometrics, 1:97-238.
Katz, A. J. ,
1983,
"Valuing the Services of Consumer Durables,"Review of Income and Wealth, December, 29:405-427.
Kendrick, J.W., 1976, The Formation and Stocks of Total Capital, New York: National Bureau of Economic Research.
Klein, L., 1986, "International Aspects of Saving," in C.F. Adams and S.M. Wachter, eds., Savings and Capital Formation: The Policy Options,
Lexington, Massachusetts: Lexington Books.
Lipsey, R.E. and H.S. Tice, eds.., 1988, The Measurement of Saving.
Investment and Wealth, Chicago: University of Chicago Press, forthcoming.
Rosen, S., 1988, "Discussion," in R.E. Lipsey and H.S. Tice, eds,, Ih.
Measurement
of Savinz. Investment and Wealth, Chicago: University of Chicago Press, forthcoming.Stiglitz, J.E. and A. Weiss, 1981, "Credit Rationing in Markets with Imperfect Imformation," American Economic Review, June, 71:393-410.
Wilson, J.F., J.L. Freund, F.O. Yohn and W. Lederer, 1988, "Household
Saving Measurement: Recent Experience from the Flow of Funds Perspective," in R.E. Lipsey and H.S. Tice, eds., The Measurement of Savinz. Investment and Wealth, Chicago: University of Chicago Press, forthcoming.