COMPARATIVE BANK STUDY: A BACKGROUND PAPER*
by
Marfo B. Lamberte** Working Paper No. 87--04
April 1987
* This is part of a bigger study entitled: "Comparativ6 Bank Study" jointly sponsored by the Philippine Institut_ for Development Studies (PIDS) and Ohio State University
(osu).
** Research Fellow, PIDS. The author is grateful to Ms. Kristine Chua for her able research assistance and to Ms. Juanita Tolentino for patiently typing the draft.
TABLE OF CONTENTS
page
I. Introduction 1
II. Regulatory Environment 2
iII. Performance of the Financial System 18
IV. Comparative Performance of KBS, PDBs,
and RBs at the Regional Level 29
Strength in Deposit Mobilization 35
Stability 41
Profitability 44
V. The Interest Rate Elasticity and
Institution Elasticity Hypotheses 47
VI. Focus on Individual Colnmercial Banks 54
I. INTRODUCTION
The PIDS-OSU research project entitled: "Comparative Bank Studies in Rural Areas" will examine the performance of rural[ banks (RBs), branches of private cotm_ercial banks (KBs) and private development banks (PDBs) serving the same rural areas. The overall objective is to deter_line prospechs for institutional viability in offering and expanding fiilancial services to rural clientele in the Philippines (see Grailam [1986]). Primary data will be collected from a sample of rural banks and branches of private commercial banks and private development banks.
This paper provides a general background to the
ab0vementioned research project. The findings here could help the research team in preparing the research design for the comparative bank studies. The analysis is mainly based on secondary and more aggregative data. The main objectives are:
(I) to briefly review existing banking regulations; (2) to describe the performance of the financial system in the most
recent past; (3) to compare the performance of KBs, PDBs and RBs by region; (4) to test the "interest rate" and "institution elasticity"_hypotheses using a combination of time series (1983-85) and cross-section data (13 regions and 3 categories of banks, namely KBs, PDBs and RBs; and (5) to examine the performance of
Ii. REGULATORY ENVIRONMENT
Financial institutions are operating under the framework set by the 1980 financial reforms. The main objectives of such reforms are to : (i) to increase competitive conditions amon_ banks, and (2) to increase the availability of and access to longer term funds.
The attainment of these objectives, first of all, demands a restructuring of the banking system. _'igure 1 shows the current structure of the financial system. Functional distinctions among banks have been reduced. For example, savings and mortgage banks, savings and loan associations and private development banks are not anymore legally different from each other. Services offered by one category of bank have been broadened to make banks realize economies of scope and to allow greater
competition among different categories of banks. One significant feature of the 1980 financial reforms is the creation o_ universal banks which have expanded co_nercial banking functions.
Table 1 summarizes salient regulations which are relevant to our comparative bank stud'y. The minimum capital requirement greatly varies among different types of banks. Interestingly, the current real values of these minimum capital requirements are substantially below their real values in 1980 because of the 139 percent inflation rate between 1980 and 1986.
Universal banks are allowed to offer a host of banking and non-banking services, many of which were prohibited before the
... -n...
Universal Banks CommercialBanks PrivateDevelop_entBanWs Rural Banks
... 7 ... _ ...
Minimum Capital _5_._M._ _I@V)M a} New: " P@,5_
•. R_equire_,lent Metro Manila -Other Places - P b) E_isting: 14etroManila - _I_ Other _}laces- PSM
iI. Limits or,Eq_ity N. FinancialPfllied A. Fhl _llied A, ncial Allied A, Financial Allied Investmerls Unde_ akings: Und Is' ur,u_rtahinqs' Und,-j'takJnps:
CoA_' uanks - 30X Co_m'l banks - 30t, Banks - 3@X - alloq_ed but Thrift bp_ks _ Thrift banks & Others - 4@X with orlor
rural hanks - I@_W ,floralbanks- 10@X apnroval of
Others - tO@,X Others - t00)_' the _on+..'ta,'?'
Board.
B. Non-Finar,c:ia[$1lIiedB," Non-FinancialAllied B. Non-financialAllied B. Non-Financial_lllied
Undertakings- I@@_4 Undertakings- I@0_( Undertakin.os-._Y. Undertakinos- i_1_._
C. Non-IllliedEt r- C. Non-AlliedEnter- _. Non-_lliedEnter- C. Non-(lllied
Enter-prises - JSW prises - prohibited prises- prohibited pY-is_s- prohibited
Ill. Banking Nation_ Nationwide Nationwide Limited _o the re_ion
offices where the a_oli_ant ban_¢
' is Icr_ ed,
IV, Reserve _eoui.... _( _IX 14_( I_X
_ents (short-term deoosit
1980 financial reforms. For instance, they can go into investment or merchant banking which was previously restricted to
I
investment houses only. In short, they can engage in almost all economic activities. There are however certain limitations. For instance, they may own voting shares in other commercial Danks and non-allied enterprises to the extent of 30 percent and 35 percQnt, respectively, of the total Voting shares (see, Annex A for the list of financial allied and non-financial allied undertakings). Others not included _ these categories may be fully owned by them.
Ordinary commercial banks and private development lbanks have more or less the same restrictions on equity investments as universal banks, except in two areas: they may own voting shares in financial allied undertakings but not to exceed 40 percent of the total voting shares and that they are not allowed to own shares in non-allied enterprises.
Rural banks are by far the most restricted banking system. They may invest in financial allied undertakings only upon prior approval by the Monetary Board. They cannot also own non-allied enterprises. However, they are permitted to go into non-financial a_lied undertakings.
The minimum networth to risk assets ratio is 8 percent for universal banks and i0 percent for other banks. The assumption here is that bigger and well-capitalized banks are more stable than smaller banks. The lower networth to risk assets ratio for universal banks is actually an invitation to banks to expand
their capital. To avoid undue concentration of wealth, universal banks are required to undertake a public offering of new shares to the extent of 10 percent of the required minimum capital.
While mergers/consolidations are being encouraged to reduce the number of banks to achieve their optimal size, branching has also been promoted. _ For ti_e first time, rural banks are permitted to open branches, although s,_lll_ ' limited to the region where the ma in branch is 1 oca ted. There is, however, a regulation that might frustrate the _.ffort te encourage branch banking. That is, the •entire country is divided into five service • areas, and commercial and thrift banks opening up a branch in any of these areas are required to buy five-year
special government or Central Bank securities according to the following schedule:
a) Service Area I (Heavily overbranched areas) F 20M
b) Service Area II (Overbranched areas) _ 15M
c) Service Area III (Idealy branched areas) _ 10M
d) Service Area IV (Underbranched areas) _ 5M
e) Service Area V (Encouraged) 0
Rural banks are required to purchase special five-year
government/[_entral Bank securities worth _500,000 for each branch opened. The idea that the Central Bank is able to know whether there is undercompetition or overcompeticion in one area is indeed questionable. The market is in a better position to know
it. •However, the recent collapse of a significant number of banks has merely reinforced the Central Bank's view on this issue. In fact', it has for the time being imposed a moratorium
on the granting of license to open a new bank or branch since the onset of the financial crisis. Many of! those banks collapsed due to their over-dependence on the Central Ban_ rediscounting
facilities and poor supervision, not due to cutthroat
competition.
Aside from this, the deposit retention scheme may also work against branching. Under this scheme, at least 50 percent of the total deposits mobilized by branches of banks in the area where they are given permission to operate should be lent to the same area. This limits banks to manage their portfolio across branches. While such scheme tries to ensure the flow _f funds to the rural areas, which still remains a questionable fact, it reduces the profitability of banks.
The reserve requirement has already been made uniform across different types of short-term deposit liabilities (i.e., deposits
with maturities of 730 days of less), but not across different types of banks. The present reserve requirement is 21 percent for universal and comfaercial banks and 14 percent for thrift and rural banks, even if they are subsidiaries/affiliates of universal o_ colnmercial banks. The intention of the differential reserve requirement across different types of banks is to offset the cost advantages enjoyed by bigger banks. However, the recent experience shows that bigger banks bought thrift and rural banks. Thus, they also enjoy such privilege.
The deregulation of the bank interest rates was part and parcel of the 1980 financial reforms. But while banks interest
rates were deregulated, the cheap red iscounting policy 0f the Central Bank which tended to favor certain economic activities continued. It was only in November 1!985 that the Central Bank
shifted its emphasis from credit allocation to • stabilization i functions. Since then, all rediscountaDle papers are treated
i uniformly in terms of r ediscoui1t rate and loan value. Since the rediscount rate has been aligned with the marke t •rate while at
the same time, ceilings on re-len-ding rates _Dr rediscounting funds have been removed, cred it subsidies to previously considered high priority sectors have virtually been eliminated. The experience in the past was that credit subsidies only led to • ••.-.misallocation of resources, • disint_rmediation and inflation, not to mention the fact that they were highly regressive (see Lamberte and Lim [1987]).
While credit subsidies are being phased out, risk-reducing schemes are being introduced. Today, there are four guarantee schemes in addition to the crop insurance scheme for rice and corn. Their features are summarized in Table 2. CALF is the latest addition to the _uarantee schemes. Its funds came from the various credit programs managed by government agencies. Unlike the <_previous special credit programs whose funds came directly from the government and/or Central Bank, funds for
on-lending under these guarantee schemes have to come from the • financial institutions. Thus, these guarantee schemes support and facilitate private initiatives in financing economic activities. Except for CALF which is just newly established, the
TabLe 2
SELECTED SPECIALCREDITPRDGRI_MS
Creoi_ Pro§rail Elm_LoieProjects • EligibleBorrowers Loan Purposes Na_imum Loanab[e Interest Maturity Mooe of .
...
,...
_...
_R_ouoL
...
_Ra
t.e_
...
_P
_e
r_
i.
_d_
...
_P_X_,e,!
....
i. Indu.str!al... Those involvedin the A. Cottaoe_entsrprise- A. Purchase of A. For Cot(;age Jg_(oer R. FiNed asset ac- E_ua! euar-Guarantee and estab_ish_,_ntor expan- total assets over factory site Industries- annum Quisition - _2
tp.r_yaT_or-Loan Fund sion of an induz(;ria]: P50,@ON__u% _Ot more ,or new and [email protected]. inclusive years inclusive tiza_ionof (IGLF) agro-ir,dustrialor ¢,;i- than PS@@:E,_'_"befh'6e'" expansion of all of a _,laxir_ur_of orinc.{aoa]
nine enterorisesinclu- financing, projec(;s, B, Sraall-5cal_ charoes, 3 y_ars grace 8 interest.
. _=nu,a,._rih_-con- peric,d on
prin-Corns and _,hoseservzce B. _._aii-Sca'..__Enter- B. Construction1 pal 9ay._lent. ir,dustries supoortiv 5e - (;oral assets of factory
of manufac_uric,_acti more than PF_,@@_ .- buildiY B. _,},__rk;.ngcapital
vities. '" "or e_cee'_ PSM 7 years
inclu-for a co ._e fir_ar_ C, Purcha_. sire of a
naxi-eligible _s, ) rqachin_ _.,a_ oF 2 years
C. ,_aium-Scale ;_- eq_ipme _rac__oeriod or,
prises - tot :(;s fixturesano principal pay-.
'Iof more (;ha )5.0M" ,._en(;.
but not e ._ding
P2@N :fore
financing.
2. f_gricultural Agrl al and agro T l.ndividuals, sin[_le _)pm " A, _ - 18 _ A. Short-t_n'_a l?lq_ ""-"f_t_'l_y,_
Loan Fund processi j projects: _ rietorhips, par(;ner....ps_ ar ._rannum to e_ce_d )?.
_,tarterly,j..
(ALF) corporations'andcoopera- exciudin_ :loatin_ ,'.,..r,t_% except <.._"-__'n,_-,f_. Short-tone seaso- tires. _and. _nter_s_ for s_ar and e,._ar_ew'ly.
hal production rate) banana
_"roduc-credit prelects. B, Worki_ tion.
_. ,_ediu_and lc,n_- _. _,_di,.,.r,and
teru credit: pou]- Lon_-terr._
try orodu_tion, Loans - based
swine oroduction, on _rv,ec__ _'
cattle oroduction, cash flow b'It
f_sheries develc,_- ::9".:to
_.___--_:er,t, plantation |5 y_ars
inc!u-prcLject% aoro- _ive of a _rac'e"
OVc,cessiF,g and .I)os(; e_.ri,_r,.J-"
harvest facili(;ies_ e__reedin¢ 7
and far[L:mechanize- years.
Cr•ect Proorafa Elioible Projects Eligible Borrowers Loan Purposes _axim_mLoanable Interest )lat,.irity v_:.deof
_mount
...
Rate. _p_r
i..qd_
...
o__,_t....
3. Guarantee Projects involved irr A. S:nall Scale Projeots- R. Fi_ed asset_ • R, Small-Scale 15Y,per n, Work_na Capital Eeu_l
Fund for the direct production i als or enter- acquisition.- Loan - annum - f,_a.imua of - monthly,or
S_lal i and and /or prc,cessina of p P3@@,_,¢_ to fixed for 5 ,/_ars, inclu- euarterly
Medium food inter, deal for bie- B. Construction P_2.@M, term of 5ire of the one ar,_c,
rtiza-Enterprises logical consumption; B. Vedium Sca[e•,_rojects.,.. of plant • loan a_p- },ear trace tic, n,
(GFSY_E) those w_directlyinvol- - Filipino stock cot- facilities. B. M.edium-Scale roved for oeriod on
_rin-vL,d in food produ_ti_r, porations, Loan -more Euarantee ci_-ai fJayi,l_nt.
an_ other agri-oro_-_ct ; C. Working than P2_ to by
the-ma.jorityof its ._roduee capital. PB_. GFS,_. B. _c_uisitEon of
ts intendedfor e_por_, fixed _ssets
O. Ref£nancino r:laxilm*,u,_1of IC
A. 5n_all Scale - iota of existing year%ine!usive
project assets o loans with of the t_..,.--),ear
r_:k less tha other linen- craoe peric,o on
P62,5@_. but r,o cial ins_i- prir,cipal
oay-more than P2.5; h_tions that _,_ent.
after f inaneino, are current
it, statu_i
B. _ediu_ Scale not to exceed
total projec 55X of the
assetsof r_lorethal of the total
PP.5M but not loan aoprov_d
e_ceeding Plk_ after'financing.
4. D_P-SSS Industrial,a0rieultural Individuals,single prop- Working capital, PSi_'_e,per- 17)¢_er Ti],'e_.Veers' _-,_.v_.nl.,," Fir,ar,cir,9 or agro- ind,strial rietorships,partnerships borrower.• annum _.a,'terly,
Proraram projects. (See Annex B and coroorations oiue set-
s_r_i-for a partial !ist of vice fee a_ml-,,_a;.[y.
eli§ibleprojects, of 4._oF?
ducted i5
advance.
5. Co'norehensive Any agricultural oro- Individual_,cor_rations _ny a_ricultural P5@¢,_ Fiwed ter_ _, Working capital E_,Lal A_oricultural jacks provided total and cooperatives_ loan, for _orkin.o to be - 8 years, wnn_h!yor
Loan Fund orojects assets must capital oracoui- determined D,T.'i_.-tmr]y.
(CALF) not e_c'eedPS_k_. simeon of fi_ed by the B. Fi_ed _sse_
assets, CPLFat the O._quisition
be_innin_o 12 years. of the
track record of those schemes in terms of repayment rate has so far been quite impressive.
Recently, however, loan availments th_-ough these schemes have reached an all-time low. In the case of IGLF, the remaining unutilized funds were returned to IBRD. There are reasons for this. First, these g uarant6e programs are not known by other banks. Hence, only few are really pushing for this prograia. Second, the procedures for access-ing these facilities are very cumbersome and processing usually takes about. 2 to 3 months. Third, the interest rate is still fixed at a high ra_e despite the fact that the general interest rate .has been going down. Thus, this program appears to be very expensive to borrowers. In fact, a lot of prepayments occurred recently in these programs. And lastly, the margin offered to banks under these schemes is very low, considering the fact that their transactions costs for originating such loans and processing papers are quite high.
There is therefore a need to redesign these programs in order to make them responsive to the credit needs especially of
those who are currently _.rationed out of the credit market. Processing procedures have to be simplified and processing time shortened SQ:_that loans can be released on the time they are most needed by borrowers.
There are still a few special credit programs, however, which are primarily aimed at supplementing the funds of banking system. Examples are the DBP-SSS Financing Program and the ALF Program (see Table 2 for their features). Unlike the previous
special credit programs, _these credit programs cover a wider range of economic activities and the interest rates are market oriented, The utilization rate of these funds is however ver$' slow mainly due to their poor or unpopular design° In the case of the ALF for instance, the documentation procedure is so complex, not to mention the fact that the interest rate is way above the current market rate. Moreover, the •floating rate applied during the term of the loan approved is not well understood by less sophisticated bor_owerls. It is also less popular to those who understand it in view of the general expectation that the interest rate is going to rise is the near future.
There are certain regulations that impinge on the
intermediation cost. The currently high reserve requirement, the 25 percent agri/agra loan requirement and the 5 percent gross receipts tax (GRT) are taxes imposed on intermediation. Under a competitive environment, all these taxes are supposed to be absorbed by financial intermediaries. Unfortunately, however, such environment does not exist in the Philippine setting. So,
%
banks fully pass on this tax burden to borrowers, who are paying a rate higher than when such intermediation taxes are absent. There seems to be a policy inconsistency here. While efforts are made to stimulate investment by keeping the interest rate low and affordable to investors, intermediation taxes are imposed that jack up the interest rate.
One of the recent changes in monetary policy was the reduction in the reserve requirement for short-term deposit
liabilities from 24 percent to 21 percent. But this ra_io is still 3 percentage points above the ratio before the onset of the crisis. Thus, there is still some room for further reduction in reserve requirement. The Central Bank should not stop at 18 percent, but should aim at a much lower reserve requirement, say 10 percent. In this case, more deposit: funds can be released for on-lending at relatively lower rates.
The purpose of the agri/agra loan requirement is to increase the flow of loans going to the agriculturalsector. This is especially addressed to commercial banks whose _oans were oriented towards the urban commercial sector .... However, this policy has never accomplished its objective. Table 3 shows that the share of agricultural loans in net loanabie funds as well as in total loans outstanding of banks even declined after the implementation of the agri/agra requirement policy as compared to the previous years. What did it accomplish then? Since the government securities eligible for the agri/agra requirement carried a rate much lower than the market rate most of the time, intermediaries were in effect being taxed. Since this tax were passed on to non-agricultural sector in terms of higher interest
rate, the c_]atter were in effect being penalized. This is one cross-sectoral subsidy program whose costs were borne by one sector but without clear bet_efits enjoyed by society as a whole. Thus, there . is a need to re-examine this loan portfolio requirement.
size of the banking system that reinvests funds, in potentially t
new directions, from old loans as they mature (Mckinnon [1981]).
In 1965, Korea's ratio was about one-half of that of the Philippines. It means that the Philippine financial systera performed better than the Korean financial system in terms of generating financial resources to support the economy. Five years later, Korea's ratio surpassed that of the Philippines by a wide margin. Since then, the Philippines was nct able to catch up with Korea. One of the reasons for Korea's tremendous success was the financial reforms it initiated in 1965 which were primarily aimed at mobilizing domesticfinancial savings. The Philippines undertook a major financial reform only in 1980. Its effects on the ratio was positive, but more modest compared to that realized by Korea. Towards the latter part of 1983, Korea and the Philippines encountered financial difficulties. However, their impact on the ratio was more severe in the Philippines than in Korea, suggesting that the latter has a more solid financial system.
The performance of Thailand's financial system has been very impressive._ The financial ratio has been steadily increasing unlike those of the Philippines and Korea which have been fluctuating.
Another £ndicator of the performance of the financial system is the efficiency with which it raises and allocates funds. This is determined by the interest rate it gives to deposits, the lending rate it charges to loans, and the spread between lending
and deposit rates. Indeed, one of the intentions of the 1980 I
financial reforms was to mobilize financial savings so that more loanable funds would be made available to industries by assuring depositors a positive real interest rate on their deposits. This
I
was to be accomplished by improving competition among banks. The increased competitionamong banks was expected to result in the narrowing of the spread between lending and deposit rates, since banks would be more willing to absorb the increased deposit rate by not raising the lending rate. Thus, both depositors and borrowers stand to benefit from such development, hnlike the
previous repressive policy regime when only financial
intermediaries benefitted.
Table 6 presents the evolution of the nominal and real interest rates and the bank spread. The latter refers to gross bank spread since intermediation cost arising fr01a regulation, e.g., reserve requirement, and administrative cost are not yet netted out. The real deposit rates were positive for the period
1981 to 1982. However, the banks spread also widened, implying that borrowers were paying _more when interest rates started to be deregulated. It seems that there is a lack of _ompetition among
banks in t_[_ credit market, and the in£erest rate deregulation only succeeded in hurting the borrowers more.
The financial crisis felt by the financial system in 1984 resulted in severely negative bank spread. Although, the lending rate for new loans went to as high as 45 percent, loans which were contracte_ in the previous period with a fixed _ate could
_T ab ]_e__6
NOMINALAND REALINTEREST_qTES
• I_I_QTIONRATE L_DIN6 QQTE DEPOSIT"EQ[E* RE._ :!
(6DP) hO_ RERL" _ REAL. SPR_D :
1381 10.98 17. lt9 6.1_ 15;60 ,,.62 1,_13 : 1982 8. 43 18._19 9, 7? .4, _1 5. 78 4. _09 • 1%3 11.74 _19,331 1.7.59 i4,34 ?-6_ 4._39 : !984 •48.93 26.743 --_; 18 r_'_ -_.6,45 -5,737 : 1985 17.71 28,234 10,5_. 1_,52 • ._.1c_. _2.7i_-: 1986 1.49 17,348, i5._6 ,_8,._ 8.•98,* 6._4 : =e
_o_e:Lenoinora_erefers$o securealoansfor all maturi¢ies, •TimeOeoosit- 36_ Days
•*TimeDeposit(4inQuarter)- R!! _turities
not be recalled by banks (see also Remolona and Lambertel [1986] for a related study). Thus, the weighted average ,-ending rate for secured loans increased only to 27 percent in 1984. On the other hand, many depositors pre-terminated their deposits and bought new deposit instruments which had very high nominal yields, thus, sending the nominal weighted average rate for time deposits up to 33 percent. Banks tried to recou_e their losses
in the subsequent years by maintaining a wide spread even as the
interest rates were going down. _ne worst thing in this
situation is that strong and profitable firms which survived the crisis were made to pay the losses incurred by banks with the loanS they gave to weak and unprofitable firms. Today, the interest rate on time deposit hovers around 6 percent while the prime rate is about 12 percent. The spread, which is about 100 percent of the deposit rate, is still very high.
It is noteworthy that while the nominal lending rate has been coming down starting in 1985, the real lending rate has been moving in the opposite direction. In fact, the Current real lending rates are unusually high by any standard. Even today when the inflation rate is practically zero, the 12 percent prime rate is c_nsidered abnormally high. This is One factor that
L_"
could weaken the ability of the economy to recover itself from the slump. But this is not all. Learning from their experience in 1984, banks are now charging floating or adjustable rates on almost all the'ir loans. Indeed, this only adds more uncertainty in the market, a development most unwelcomed by businessmen.
The total resources oftthe banking system could give _s more b
or less an indication of its capability to finanhe the economic recovery. Between 1981 to 1983, the real resources of the banking system had been increasing quite moderately (see Table
7). But the crisis which took place towards the latter part of 1983 reversed this trend. Several medium-size commercial banks, thrift banks and rural banks became insolvent andwere later on closed. In two years time, the real resources of the banking
/
system shrunk by 34 percent. There was a sharper drop in the real loans outstanding since banks substantially redpced their
lending in favor of risk-free, high yieldin_ Central
Bank/government securities.
Banks have historically been focusing on short-term loans. The 1980 financial reforms that encouraged banks, particularly commercial banks, to lend long made some headway as the share of medium- and long-term loans in the total loan portfolio of commercial banks increased quite significantly (see Table 8). But the recent financial crisis have made banks more cautious. In fact, they have alread_ started reducing the share of their long-term loans in their total portfolio. Development banks which are_!_pposed to take care of the l_ng-term 'requirements of
industries could not meet the large demand for long-term funds, not to mention the fact that many of them, including DSP, are presently in financial distress. In fact, recently the biggest private development with substantial exposure to foreign multilateral loans folded up.
.._-a--_ie 7
_E S _,T_ BF&_I_W_BYSTE)n,N(]_,IINAL(!nBillion_=s_
RESOURCES _C OF TOT_.LOANS _3 BOP )318DP :
MON SYS Du.TSTPJ_DIN__ .(.%_) (._Ce_) :
!98! _._ 115,77 _,51 &?.._ 3_o_ .2_9233 : !982 339.17 141.49 98,24 95.27 34_, 60 .27971IB : 1983 430.93 ,171.40, i 11.39 i 1z'.% 384..69.• ,2936_8 : 1984 487.24 167:01 116. 38 121.22 539.41" .22471a2. : 1985 502=50 156.75 87.57 132;8a 6_5,5?. ,2!8k)i_ : '.986 528,00 14_,47 87.60* [email protected]_2 619,_@ ._4_19 : • _r:UN__RRTER
RESDURCE,S OF THE BAN_INBSYSTEm,_ (InBillior,Pesos)
RESI_E£$. NDCOF TOT_.Lb-"A,_ M3 BDP _.R/BDP :
"" MOWSYS OUTST_DIN6
-; 1_I 94.03 ,36.49 27,_ 2'5.87 96.21 .L--_9233 : 1982 98,58 .41.13 _B._ 27.69 99,00 ,_797]18 : 1983 112,10 44.58 28.97 29,_ !_0,07 .2%&4_ : 1984 _. 10 L_. 17 20, 33 21. !7 _4.?_2 .2247182 : 1985 74.56 23._ 12,99 19.72 9e.44 .2:_:25 .' 1986 77.20 _0.54 12.81 21._ 9@,61 .240B019 : 26
Table 8
COMMERCIAL BANK DEPOSITS AND LOANS (_B, 1978 PRICES _)
1980 1981 1982 1983 1984 1985
Total Deposits 30.4 34.4 38 40.1 30.8 28.4
Share demand 29 22 16 17 13 12
Share time & 71 78 84 83 87 88
savings
Loan Outstanding 55.6 55.1 56.7 58.7 40_6 27.1
Share short term 78 73 69 70 61 61
Share medium & 22 27 31 39 39 39
long term
* Deflated by the CPI
Source: World Bank Report (1986).
The movements of key economic and financial indicatolrs in
I
1986 seemed to be encouraging. GNP growth rate t_irned positive after a negative growt h rate for two successive years. Inflation was practically negligible. The flow of loanable funds and the financial resources of the banking system (in real terms) Started
to pick up. Outstand _ng loans of banks and Central Bank rediscounting to banks im_J_.ed moderately. The M3/GDP ratio rose slightly to 24 percent from 21 percent the previous year. With these bright prospects for the economy in the near future,
the financial system is expected to play a more positive role.
IV. COMPARATIVE PERFORMANCE OF KBs, PDBs, AND RBS AT THE REGIONAL LEVEL
This section compares the performance of KBs (including both universal and ordinary commercial banks), PDBs and RBs at the regional level. All head offices of KBs are located in the National Capital Region (i.e. Region IV), but their branches are spread all over the othe_ 12 regions (see Table 9). Although most of their branches are situated in provinci=l capitals and/or prime cities and towns, however, thei_ banking opera$ions extend to all over the province and region. Wihh regard to PDBs, a significant number of their head offices are located outside the
I
National Capital Region (NCR). Specifically, 20 out of 45 head offices of PDBs operate outside NCR as of December 1985. They have very few branches compared to commercial banks. Usually, their branches are located in provinces or regions close to the province or region where their head offices are situated.
Originally, RBs were supposed to be unit banks only. But after the 1980 financial reforms they are already allowed to open up branches in other towo_ s/cities within a certain region subject to the branching regulations discussed in Section II. Even then, very few of them have opened up branches. Lately, quite a number of them became subsidiaries of commercial banks.
Essentially, we will be comparing the performance of branches of KBs with either head offices or branches of PDBs and head offices of rural banks operating at a certain region. The reason why the _omparison is done at the regional level is that
Table
9
Table
9
(cont'd.)
Table
9
(cont'd.)
Table
9
(cont'd.)
the most d isaggregative data published by the Central Bank regarding the financial performance of branches of banks s!top at the regional level. Specifically, balance sheets and income statements of branches and/or head offices of banks belonging to the same type of bank are aggregated at the regional ]level. Note, however, that there are no PDBs operating in Regions II, IX and XII. In some regions, very few PDBs are operating.
The performance of branches of KBs, PDBs and RBs will be evaluated on the basis of the following indicators: (a) strength
in deposit mobilization; (b) bank stability; and (c)
profitability. The volume of deposits per brancn anQ the ratio of deposits to total resources are used as measures of the
strength in deposit mobilization. For bank stability the ratio of loan portfolio to deposit liabilities is utilized. Liquidity
ratio could not be used here since data on liquid assets are not available. A single measure of profitability is used here, i.e., the ratio of net operating income to operating income. The rate of return on equity could have been another good measure of bank profitability. However, it is very difficult to derive such measure because of the prob'lem involved in determining the equity
of branches of banks. Indeed, the number of performance indicators we are using for this study is very• limited because of the unavailability of some data.
The comparison will be done over a 3-year period, i.e., from 1983 to 1985 to see if the relative performance of the three types of banks is consistent over these years. Incidentally, the recent economic crisis started towards the second semester of
1983, and the economic downswing continued for two consecutive years. The economic conditions of the 13 regions also followed
this trend, as may be gleaned fro a the mow_ments of t}_e respective regional gross domestic products (GDPs) in real terms (see Table 9). Both the commercial and rural banks seemed to be adversely affected by the crisis as raay be gathered from the declining number of banking offices over the period 1983 to 1985.
The number of offices of PDBs have either remained the same or have slightly increased during the same period.
Strength in Deposit Mobi_lization
KBs' deposit mobilization is more extensive than PDBs and RBs'. The average deposit per branch of KBs in 1985 ranged from _28M to _52M in regions outside the NCR (see Table i0). This is about 3 to 5 times the average deposit per branch of PDBs.
Except for one region, rural banks rank the last among the three groups of banks in terms of the volume of deposits per branch. It should however be noted that branches of KBs and PDBs tend to locate in cities and towns where bigger deposit accounts can be found, whereas rural banks are sprea d all over the countryside_ including smaller towns. The ranking of the three
groups of banks over the 3-year period has been fairly
consistent.
The ratio of deposit liabilities to total resource indicates where most of the resources of banks come from. The higher the
ratio, the more successful the banks are in mobilizing deposits.
Table i0
Table
i0
(cont'd.)
Table
i0
(cont'd.)
Table i0 (cont_d.)
KBs have the highest ratio among the three groups o£ banks _in all the regions. Except for two regions, the ratios are quite high at between 75 to 91 percent in 1985.
One notable feature here is that the ratio of deposit: liabilities to total resources of KBs in the NCR has been very low at about 34 to 37 percent during the period 1983 to 1985. There are reasons for•this. One is that the head offices of KBs bear most of the physical resources such as, buildings, office • equipment, etc. for the entire bank_including branches. The other reason •is that the head offices haqe• ready access to the rediscount windows of the Central Bank which augment their resources. Still another reason is that they are the main users of funds mobilized by their branches outside the NCR.
with regard to the low ratio of deposit liabilities to total resources in Region VI, we surmise that this is due to the KBs'
inability to mobilize deposits.
The PDBs rank second in terms of the ratio of deposit liabilities to total resources, although very much far behind the KBs. However, they were outperformed by RBs in at least three
regions. ItI is noteworthy•that in regions close to the NCR, spe_i_idaYi_y Reglon III and Region IV-A, _ne ra_los are more than twice the ratios in other regions. Here, both supply and demand could have worked together. From the demand side, the two
regions have incomes relatively higher than the other regions, except the NCR as may be gathered from their GDP values. This is translated into higher demand for deposit instruments. On the
supply side, PDBs head offices and/or branches close to Metro
i
Manila are professionally managed and therefore tend to be more competitive. The same finding can be observed with regard to the rural banks located near the NCR.
It is noteworthy that the ratios of deposit liabilities to total resources of KB$, PDB_ and RBs had been increasing in almost all the regions during the period 1983-1985. In some regions, like Region X, the increase in the ratio of KBs has been
phenomenal. During this period:, monetary policy was
contractionary and the Central Bank practically blosed its
t
rediscounting window, except for export pa@ers. With cheap money already unavailable, and the interest rates on CB bills and Treasury bills very high, banks responded by offering high-yielding deposit instruments in order to stay competitive.
Stability
The loan to deposit ratio "indicates the extent which a bank overstretches its resources to provide loans" (World Bank Report
[1986]). The higher the ratio, the more unstable the bank is. Normally, the ratio should not exceed 100 percent because banks have still _o provide reserves for their deposits. In addition,
a portion of the deposits is usually invested in equities and/or securities as part of the portfolio diversification of banks. Accordingly, Japanese banks are required to keeQ the ratio below
80 percent.
In 1985, KBs' loan to deposit ratios ranged between 20 to 45 percent in almost all regions, except in the NCR and Region VI.
t
While below i00 percent, these ratios are surprisingly low. It should be pointed out that branches o[ KBs are cow-_red by the deposit retention scheme and therefore, the ratios should have not gone below 50 percent. However, w:ith the results, _t appears
that this regulation is not being strictly followed and enforced, Most of the deposit funds of branches of commercial banks could have gone to the NCR since the loan to deposit ratio in this
=
region exceeds 100 percent. This tends to show that KBs regard their branches located in areas outside Metro Manila as mainly
4
deposit taking institutions. It is highly possible then that their branches have greater discretionarypower with ,regard to raising deposits but have very limited decision making power with regard to originating loans. Moreover, head offices may have
i
regarded commercial and industrial loans in the NCR more profitable and less risky than agricultural loans in the countryside. This is an issue worthwhile watching in the
forthcoming survey.
PDBs' and RBs' loan to deposit ratios greatly exceed i00 percent in almost all regions and in almost all the years.
Indeed, a significant proportion of their loans were supported not by depo_its but by borrowings from the Central Bank and other government agencies having special credit programs. As such, they acted merely as conduits or brokers of Central Bank and government funds, rather than real banks. They are more exposed to risk since a sudden change in policy could immediately put
them in a difficult situation. Indeed, this happened in the
recent past when the _entra! Bank tightened its rediscountiing L policy.
It is interesting to note that PDBs located near Metro Manila have loan to deposit ratios lower than i00 percent. In the case
I of Region III-A, the ratio more or less falls within the normal range except in the las_t, year. It seems that the_e PDBs in this region operate like a real bank whose loans mostly come from deposits they have mobilized. In Reaion III_ however, PDBs behave like branches of KBs. They'-have lower loan to deposit ratio, suggesting that most of their deposits were _rans_erred to their respective head offices in the NCR.
Note that the loan to deposit ratio of all groups of banks had been declining in almost all regions during the period 1983-1984. This was the result of two factors. One is that loans outstanding of banks declined due to general economic crisis. A
significant proportion of their funds were instead invested in government securities. The other factor is that they were able
to raise more deposits by offering higher interest rates. As already pointed out above,° banks offered very high interest on deposits to compete with government securities.
The overall picture that can be drawn from the findings is that in regions outside Metro Manila, KBs are specializing in deposit mobilization to support the lending activity of their head offices located in Metro Manila, whereas PDBs and RBs are specializing in lending with most of the funds coming from special credit programs of the government. The implications of
this to our study comparing:the performance of KBs, PDBs and_RBs is clear. It means that we; have to exercise .extra carei in comparing the performance of different types of banks usin_ standard ratios. A branch may be pursuing an objective different; from that of a unit bank. This has to be sorted out first before drawing any conclusion. For example, we found that the loan to deposit ratios of branches of commercial banks are below !00
i
percent, "but the very low ratio made us to suspect that they are only performing one function of banking. 'However, it should be noted that their function is dictated by tha Overall objective of
the mother bank.
Profitability
As mentioned above, our measure of profitability is the ratio of net operating income to total operating income. It indicates to what extent banks were able to control their operational costs. The higher these ratio, the more profitable
the bank is due to mangement's ability to control costs.
There is a peculiar pattern that we observe here regarding the profits realized by banks. Branches of commercial banks in a l__aost--_-li-_--r-e-g_o-_-.4-incurrednegative net profits (see Table 9).
-\,_2
This could be the result of two factors. One is that branches of PNB which have been incurring huge losses have dominated the branches of KBs. In 1985 alone, total losses of the government-owfied Philippine National Bank (PNB) amounted to _7.2 billion. Unfortunately, however, we could not find a way of segregating PNB branches away from the rest of the branches of KBs given the
data available on hand. The other is that their volume of deposits was much larger than their loans, hence, their interest
; I
expense on deposits greatly exceeded their interest income on loans. AS we have pointed out earliel=, branches of commercial banks in the regions are mainly deposit taking institutions.
Note that it is only in the NCR and Region VI where KBs ,realized positive net profits. These are the only areas where KBs lending activity _was concentrated as indicated by their loan to deposit ratios that exceeded i00 percent. Consequently, their interest income was more than their interest expense in these two regions.
The case of PDBs is somewhat similar to that Of KBs. For instance, PDBs in Region III incurred negative net profits mainly due to the fact that their interest expense exceeded their
interest income. In other words, they have lower volume of loans as compared to their volume of deposits. However, in regions where PDBs lending activity is quite substantial, positive net profits were realized.
Among the three groups of banks, only RBs in all regions have consistently earned positive profits during the period 1983-85. This seems to be surprising considering the fact that RBs suffered mQ_t from the recent economic crisis'. It should, however, be noted that the data we are using are based on the unaudited reports of the RBs submitted to the Central Bank. Most banks did not .incorporate in their reports the valuation reserves required by the CB examiners.
On the basis of these findings, it is then very hard_• to compare profitability of branches of KBs and PDBs with that of unit banks using the ratio of net ope:_ating income to operating
income as the measure of profitability. In the first place, branches of cormaercial banks could afford losses •so long as the consolidated profits of the bank as a whole are positive (see Section VI for an analysis of individual bank's profits) . Secondly, _ the data available on ha_nd cannot be used for the said purpose. The true picture of the financial, statements especially RBs must be obtain'ed in the first place. Secondly, other
i
measures of profitability that would take into account the varying characteristics of the three groups of ban_s can be
i
devised. For example, the contribution of branches of KBs to the overall profits of the bank even if they are not the ones directly lending providing that the funds come from them must be
estimated. We suspect that the data on which our present analysis is based do not reflect this simply because they were compiled by branches of banks usin_ the standard accounting procedure. This should be taken into consideration in the forthcoming comparative batik study.
V. THE INTEREST RATE ELASTICITY AND INSTITUTION ELASTICITY HYPOTHESES
The potential for mobilizing savings has !on_ been
recognized. But it is only recently when the Country is facinc_ severe foreign exchange crisis that policies are finetune_Z _to tap
the saving potentials o_f. the dc_nestic economy.
The _project: "Comparative Bank Stu_y" will address the extent of banks' success in mobilizin(_ financial savinas. In
" ,i
looking at the issue_of savings mobilization, _ two variables are always given more importance. One is interest rate, and it is hypothesized that financial savings respond positively to
4
interest rate. The other is the availability of financial !
institutions, and the hypothesis here is that savers are induced to save in financial forms if they have easy access to financial
institutions. Lamberte (1987) reviewed the studies which directly or indirectly tested these hypotheses. The results were
found to be mixed and no definitive conclusion could be reached.
In view of the importance of the issues involved, this background paper attempts to examine again the interest rate elasticity _and the institution elasticity hypotheses. It does not, of course, intend to settle the debate, but we nerely want to provide an alternative way of verifying the hypotheses that could perhaps be useful to the comparative bank study.
The model is as follows:
FD = f (i , BANKS, GDP) (i)
o
FD stands for financial deposits with banks. Data are obtained not from the households but from the banks. Bank deposits then are used as the proxy for household financial savings. The weakenes of this proxy is, of •course, obvious. First of all, it excludes cash, insurance claims, bondsI as
instruments of financial savings. Cash is one of the most important forms of financial savings in the rural areas. Secondly, it includes•corporate, institutional households and government deposits.
The variable, i , refers to the effective iDterest on
D i•
deposits. This is derived by dividing the actual interest expense on•deposihs by the Outstanding deposits of ban_s. This
is one aspect that makes our study different frora the previous studies which used either the statutory or reported actual interest rates on savings or time deposits or the weighted average of both.
BANKS refers to the number of bank offices of each _ype of banks in a region, while GDP stands for gross domestic product of a region.
This _tudy makes use of a combination of cross-section and time series data. This is another aspect that makes our study different from the previous ones. Data on deposits, effective
interest rates, number of branches for KBs, PDBs and RBs are available for the 13 regions. The study covers the period 1983-85. Note that the interest rate policy regime is the same in all these years. 5ome of the previous studies tested the two
hypotheses mentioned above not knowing that the data unil£zed
L
included different interest rate policy regimes.
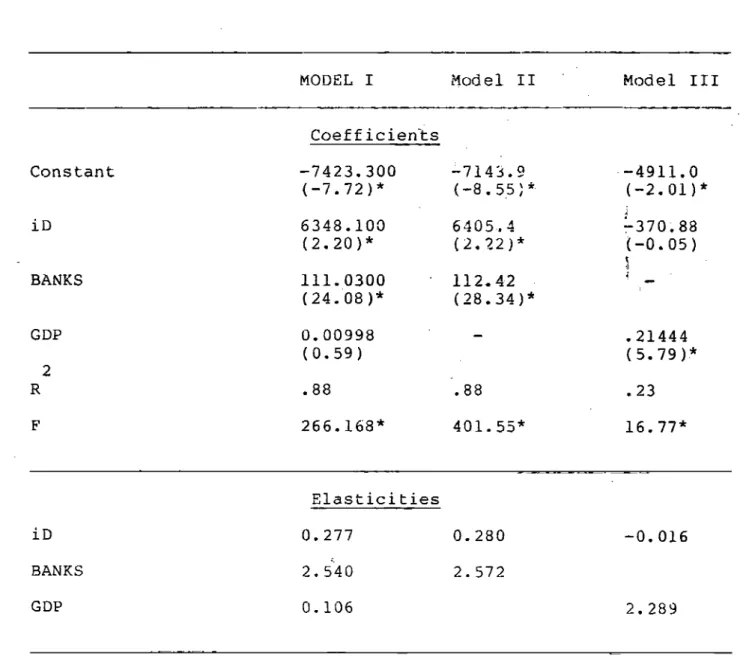
Equation (i) was estimated using OLS. The ti_r_e du$_y variables (i.e., DUMB3 for 1983 and DUMB4 for 1984) did not yield significant coefficients. So, they were dropped in the _ final runs. The results are sum_ar_'zed in Table ii. Model I includes all the identified independent variables. All nave the expected signs. However, the coefficient- of GDP is E_ot statistically significant. The equation seems reasonable on tlie basis of the
2
R and F-statistic. The elasticities computed at the means are also shown in the same table. It appears that the presence of
more banking institutions in the regions has:-greater impact on deposits than high interest rate in the regions. This seems reasonable since high interest rate does not mean anything to people in the provinces if financial institutions are not accessible to them.
Previous studies encountered severe coll inearity problem between GDP and BANKS. Specifically, increase in bank network was found to be strongly co.rrelated with income. Thus, B_{KS was
found to have no significant effect in previous studies. We have tried to c_,:gck whether this problem appears in our case. Model II reestimated equation (1 ) without GDP. The estimated cofficients and elasticities of i have virtually remaine_d <he
D
same. In Model III, we dropped BANKS from the equation. The result is that GDP has a significant effect on deposits while i
2 D
does not have. However, the R considerably drops to a very
Table Ii
RESULTS OF TESTING THE INTEREST RATE ELASTICITY AND INSTITUTION ELASTICITY HYPOTHESES
MODEL I Model II Model III
Coefficients Constant -7423. 300 -7143.9 -4911.0 (-7.72)* (-8.55) * (-2.01)* iD 6348. i00 6405.4 -370.88 (2.20)* (2.22)* (-0.05) BANKS iii. 0300 112.42 (24.08)* (28.34)* GDP 0. 00998 - .21444 (0.59) (5.79)* 2 R .88 .88 .23 F 266. 168" 401.55* 16.77* Elasticities iD 0.277 0.280 -0.016 BANKS 2.540 2.572 GDP 0.106 2.289
Note: Figures in parentheses are t-values. * - significant at 5 percent.
low level, suggesting that Model III is a mode] inferior compared to Models I and II.
The inescapable conclusion drawn fro_a the results is t|,at the interest and institution elasticity hypotheses cannot be rejected using the approach and data of this study.
We proceed further by examining the demand for deposit
instruments of KBs, PDBs and RBs. Equation (I) was run
separately for KBs, PDBs and RBs. The results are presented in Table l2.
Deposits with KBs are found to increase with an _ncrease in the interest rate on deposits. This is not however the icase with PDBs and RBs. In fact, the sign of the coefficients of interest rate is negative for both groups of banks. It should be noted
that during this period, there was a general nervousness in the financial system. Many depositors shifted their deposits from small to bigger banks and from thrift and rural banks to branches of commercial banks which were perceived to be relatively more
stable.
The number of offices has a significanh positive effect on deposits wi'_h KBs, PDBs and RBs. In the case of KBs, an additional branch openend brings about additional deposits of _127 million. In contrast, an additional branch or head office of KBs and PDBs attracts only _6 million and ?4 million, respectively.
Table 12
DEMAND FOR DEPOSIT INSTRUMENTS OF KBs, PDBs and RBs
KBs PDBs RBs Constant -16904.00 -119.44 -105.70 (-6.33)* (-3.68)* (-1.99)** iD 108640_00 -16.447 -520.11 (3.96)* (-0.30) (-1.64) BANKS 127.00 6.167 3.967 (19.14)* (6.55)* (16.16)* GDP -0.0695 51.6321 15.422 (-1.70)** (7.98)* :(4.19)*
2
i
R 0.98 0.93 40.88 F 596.81" 134.23" 97.45* _7_ rNote: * Significant at 5 percent level. • * significant at i0 percent level.
The effect of regiodal income on deposits with KBs _ is negative and statistically significant ._t 10 percent level. This is indeed surprising and difficult to explain. Perhaps, more analysis is needed in this regard.
]
With regard to PDBs and RBs, regional income is found to have a significant positive effect on deposits. It means that
improvement in regional income is important to PDBs and RBs in raising deposits.
VI. FOCUS ON INDIVIDUAL COMMERCIAL BANKS
In Section IV, we have obserw_d that branches of KBs obtained negative profits. We have pointed out that this is not
necessarily the case if the bank in its entirety is examined.1 This section focuses on the performance Of individual com_uercial banks using their consolidated financial statements. This should give us idea regarding comlnercial banks to be included in the comparative bank study and at the same time, help us analyze the primary data to be gathered later on from sample branches of
]
commercial banks.
Presently, there are 30 operatihg commercial banks. Nine of them are authorized to operate as universal banks. Ten banks have more than 50 branches (see Table 13). It can however be observed
that majority of the branches are concentrated in the National Capital Region.
The financial system underwent two crises since 1981. Both crises exposed the weaknesses of several commercial banks. In
the first crisis, six couuuercial banks encountered severe financial difficulties. For fear of a global bank run, the
?
government _:ttempted to rehabilitate all of them. The assistance came in the form of equity infusion, CB advances and government deposits (see Table 14). The government eventually took over
these banks in. view of its huge exposures. Recently, InterBank was able to sell 40 percent o_ government equity to a foreign financial institution.
.. ! , II III IV IV-A V VI 1, ALLIEI_ a 3 6 2(} 4 ' 3 B ], DA 6, CITIB_( = 7, ClTYTRi._T ! - - 19 5 _ . _. C_)ID_( - 7 l 7 -9, CO_X. IDATED - 2 _4 3 3 2
iO. EOU[IhBLE p. _ _
,. 11, FAREAST _ ! 3_ 3 3 " I - I 1 iJ,,N_JILhI.IA)I( 4 , _ 46 3 2 [} IETROB/V_( 6 " 6 J@ _ J4 3 6 ,,, ,_0.H j - !7 .... i ]7, PiI'.(.D_i)(l_ -I - i _ 3 - I lE, PCII] 9 [ B _| i 3 i| i9. p(_l] 16 J6 I6 35 p.(_ I! 9 P__t,(4tlLTl_flST t = t I6 -iJt, PlLIRfi'_S " " _, PR(I,_IEERS 5 3 _ _ - I :3-.P3, PIIIil)E_VfI _ 3 - 7 _ 4 1. _4, REPUBLIC _ 1 _ _ 5 _ 0 _. RCDC _. I R 1B 2 1 _6.SEC'tJRITY 4 1 1 _'_ " 5. _7, £1f_IO/IRO . . _ " 4 _:i_,Tr_,qDER,_ 5 - 5 19 2. 1 7. _9. isl/ll_,l 1 [ J 2 2,_,tJCPI_ _ 1 7 3_ 6 _. 4
-- TaNl-e--lJ (conF.-(3.)
VII
VII
I
II
){
II
Ill
FOREI_
TOTIW_ :
9
3
7
4
_
;3
4
93 z
I
-
J
.1
!
-
33 ,
... 1 I•_
_
J
_
8
-
-
187
:
i - '*l i | - " 22 •...
]6 r
t
t
3
3
1
-
_
i
1 _ " | | - - 33 :-
t
1
]
l
-
59 .
... I t3
-
I
|
-
;!
_
;
e
i
e
_
3
-
&3
1_
8
6
9
7
6
41
169
J
-
-
2
-
-
_-f
4,
I
_
3
3
2
-.
5I
._
3
1
{
-
l
-
-
40
:
2
1
"
I
i
-
-
3_ ,
2
_
i
B '
- I
-
._g
....
I
1
l
P
-
-
43
:
] -- :'l " " -- " | I3
l
I"
1
.I
-
.
23 :
Table 14
GOVERNMENT'S FINANCIAL ASSISTANCE TO ACQUIRED BANKS (As of December I@84)
(_ Million)
Government Government Parent CB
Bank Equity Deposits Advances Advances
Associated 407.D 16 24.9 297.4 COMBANK 322.0 97 174.0 154.8 Inter Bank 530.