Publisher: Routledge
Informa Ltd Registered in England and Wales Registered Number: 1072954 Registered office: 5 Howick Place, London, SW1P 1WG
Click for updates
Emerging Markets Finance and Trade
Publication details, including instructions for authors and subscription information:http://www.tandfonline.com/loi/mree20
Macroeconomic Impact of Bank
Regulation and Supervision: A
Cross-Country Investigation
Bilin Neyapti a & N. Nergiz Dincer b a
Department of Economics, Bilkent University, Ankara, Turkey b
Department of Economics, TED University, Ankara, Turkey Published online: 05 Dec 2014.
To cite this article: Bilin Neyapti & N. Nergiz Dincer (2014) Macroeconomic Impact of Bank Regulation
and Supervision: A Cross-Country Investigation, Emerging Markets Finance and Trade, 50:1, 52-70
To link to this article: http://dx.doi.org/10.2753/REE1540-496X500103
PLEASE SCROLL DOWN FOR ARTICLE
Taylor & Francis makes every effort to ensure the accuracy of all the information (the “Content”) contained in the publications on our platform. However, Taylor & Francis, our agents, and our licensors make no representations or warranties whatsoever as to the accuracy, completeness, or suitability for any purpose of the Content. Any opinions and views expressed in this publication are the opinions and views of the authors, and are not the views of or endorsed by Taylor & Francis. The accuracy of the Content should not be relied upon and should be independently verified with primary sources of information. Taylor and Francis shall not be liable for any losses, actions, claims, proceedings, demands, costs, expenses, damages, and other liabilities whatsoever or howsoever caused arising directly or indirectly in connection with, in relation to or arising out of the use of the Content.
This article may be used for research, teaching, and private study purposes. Any substantial or systematic reproduction, redistribution, reselling, loan, sub-licensing, systematic supply, or distribution in any form to anyone is expressly forbidden. Terms & Conditions of access and use can be found at http://www.tandfonline.com/page/terms-and-conditions
Emerging Markets Finance & Trade / January–February 2014, Vol. 50, No. 1, pp. 52–70. © 2014 M.E. Sharpe, Inc. All rights reserved. Permissions: www.copyright.com ISSN 1540–496X (print) /ISSN 1558–0938 (online)
DOI: 10.2753/REE1540-496X500103
Macroeconomic Impact of Bank Regulation and
Supervision: A Cross-Country Investigation
Bilin Neyapti and N. Nergiz Dincer
ABSTRACT: Bank regulation and supervision (RS) is a formal institutional mechanism that aims to reduce the adverse selection and moral hazard risks in the banking sector. This paper offers an empirical exploration of the relationship between banking-sector performance and RS using data on the legal quality of bank regulation and supervision. The main channels via which RS affects bank performance are considered to be depositor trust, investment mobilization, and borrower discipline. An event study of up to fifty-three countries provides robust evidence that RS has significant positive effects on bank deposits and investment rate and significant negative effects on nonperforming loans.
KEY WORDS: bank performance, bank regulation and supervision.
Legislation on bank regulation and supervision (RS) constitutes a key formal institution that serves to improve banking-sector performance by reducing the adverse selection and moral hazard risks that the sector faces. The positive interrelationships between economic growth and the legal framework of the banking sector, specifically regarding creditor rights and contract enforcement, have been widely discussed and documented (for a survey and evidence, see, e.g., Levine 1998).
In a theoretical model, Kilinc and Neyapti (2012) use a dynamic general equilibrium framework to show that RS leads to welfare gains. The authors argue that while the mar-ginal effect of RS on welfare decreases with the level of development, increasing RS up to a threshold level is associated with a positive relationship between bank monitoring and the real-sector quality. This paper provides an empirical investigation of Kilinc and Neyapti, who hypothesize that RS affects banking-sector performance through mainly three channels. First, by promoting depositors’ trust in the banking sector, RS increases the ratio of deposits to GDP (gross domestic product). Second, by promoting effective balance sheet management, background checks, and monitoring, RS facilitates banks’ ability to channel funds into efficient investment projects. Third, through effective supervision, RS increases the ratio of loans returned to banks or reduces the ratio of nonperforming loans.
We argue that RS contributes to financial market development by reducing the transaction costs and hence enhancing trust in the banking sector. The positive relation-ship between trust and financial market development has been evidenced in the works of Calderon et al. (2001) and Guiso et al. (2004).1 Several other studies have recently provided empirical investigations of the effects of bank regulation (specifically capital requirement) on bank deposits and loans (for advanced countries, see, e.g., Cosimano and Hakura 2011; and for Europe, see Schmitz 2005); the findings generally demonstrate
Bilin Neyapti (neyapti@bilkent.edu.tr) is an associate professor in the Department of Economics, Bilkent University, Ankara, Turkey. N. Nergiz Dincer (nergiz.dincer@tedu.edu.tr) is an associate professor in the Department of Economics, TED University, Ankara, Turkey.
that higher bank capital is associated positively with deposits and negatively with bank lending or riskiness of bank portfolios. Ag¬ca and Celasun (2012) show that the impact of credit market reforms on bank performance improves with institutional quality.
Using survey-based measures of bank regulation and supervision, Barth et al. (2005) conduct an extensive study wherein they argue that regulatory and supervisory intensity reduces banking efficiency except in countries with developed political institutions; they do not find a significant relationship between capital regulations and bank performance. Also using survey-based indicators, both Allen and Gale (2007) and de Haan and Shehzad (2009) argue, however, that regulatory intensity reduces banking crises. The negative correlation between RS and the magnitude of output losses from crises lends support to the latter view (see Appendix Figure A1).2
Several studies have also pointed to the significant role of macroeconomic stability in affecting the level of nonperforming loans (for country-level studies, see, e.g., Louzis et al. 2012 and Vogiazas and Nikolaidou 2011; for advanced economies, Nkusu 2011; and for the case of Europe, Rinaldi and Sanchis-Arellano 2006). In addition, Demirgüç-Kunt and Huizinga (1999) demonstrate that bank profitability is associated closely with a variety of structural and institutional elements besides macroeconomic indicators. Using a sample of emerging economies, Kutan et al. (2012) also show that not only macroeconomic factors but also institutions have a significant effect on bank profitability.
In view of the foregoing, it is possible to say that the evidence on the role of bank regulation and supervision on banking-sector performance has not been decisive. This is partly because, until recently, an objective and broad-based, or a holistic, measure of the legal quality of the bank regulatory and supervisory frameworks has not been avail-able on a comparative basis and partly because the existing studies have focused either on macroeconomic factors only or on macroeconomic factors in addition to a specific aspect of regulation, such as capital requirements.
Using an extensive set of criteria, Neyapti and Dincer (2005) provide an index of bank regulation and supervision called RS that measures the extent of transparency,
restrictiveness, and coverage of banking laws. The authors argue that, if bank laws
have been tailored to eliminate the transaction costs prevailing in a given economic and structural environment, legal-based measures can be regarded superior to survey-based measures as the former overcomes the various sources of subjectivity. Notwithstanding the different extent of adherence to law across countries, we use the legal indexes of RS to investigate the effects of RS on banking sector performance by testing the above-stated hypotheses empirically. In doing this, the foregoing literature sheds light on the selection of control variables.
Data and Methodology
Levine (1998) reports that banking-sector development (measured by the ratio of private credit to GDP) is positively related to legal creditor rights and contract enforcement. We take the inquiry into the relationship between legal frameworks and the banking sector performance further and explore the channels via which banking laws affect the various indicators of banking sector efficiency or effectiveness. To do this, we employ the Neyapti and Dincer (2005) index of the legal quality of bank regulation and super-vision: RS.RS is based on a list of ninety-nine criteria that cover legal provisions read from the banking laws. These measurement criteria can be summarized in eight main categories: (1) capital requirements, (2) lending, (3) ownership structure, (4) directors
and managers, (5) reporting/recording requirements, (6) corrective action, (7) supervi-sion, and (8) deposit insurance.3 The RS index is available for fifty-three (twenty-four transitional, eleven developed, and eighteen developing) countries and is the only legal measure of RS available to date. Appendix B reports the list of the countries and the years of the RS indexes used in the current analysis.
Our empirical analysis of the relationship between RS index and banking-sector per-formance focuses on three essential aspects of bank perper-formance: deposits, investments, and nonperforming loans. To test the relationship between RS and depositor trust, we use the ratio of deposits to GDP, denoted by DEPgdp. The dependent variables chosen to test the effects of RS on investment and borrower behavior are the ratios of investment to GDP
(INVgdp) and of nonperforming loans (NPL) to total credits (NPLcr), respectively.4
All the banking performance indicators are organized in five-year averages following the enactment years of banking laws. The enactment year of the banking laws, based on which RS has been coded, identify the events in our empirical analysis. Due to data limitations, however, the estimation of NPLcr is performed with the start date of 2000. Employing all the other explanatory variables in five-year lagged averages with respect to the event date (the start of RS) eliminates potential simultaneity problems. For twelve countries in the sample, the time dimension of data is two due to reenactment of banking laws. Hence, the resulting data set is in a panel format where, depending on the model estimated, the number of observations is between thirty-four and sixty-one.5 To control for possible cross-sectional heterogeneity, the White heteroskedasticity correction is applied to the error terms.
Table 1 reports the cross-sectional correlations between the eight main components of the RS index and the banking performance indicators (in averages over the following five years, where available). As expected, deposit insurance attracts deposits, as reflected in the positive correlation of 0.35 for DEPgdp. DEPgdp is positively correlated also with capital requirements (0.41), indicating that regulation improves depositor confidence in banks. Also as expected, regulations regarding reporting-recording requirements, supervision, and ownership are all highly negatively correlated with NPLcr (–0.50, –0.51, and –0.38, respectively). While regulatory provisions on bank lending are positively associated with investment (0.27), it is interesting that legal provisions on both capital requirements and director-manager qualifications are negatively associated with investment (–0.37 and –0.38, respectively). The negative relation is even more prevalent concerning deposit insurance (–0.62). The empirical investigation below indicates, however, that this obser-vation may pertain to specific structural circumstances.
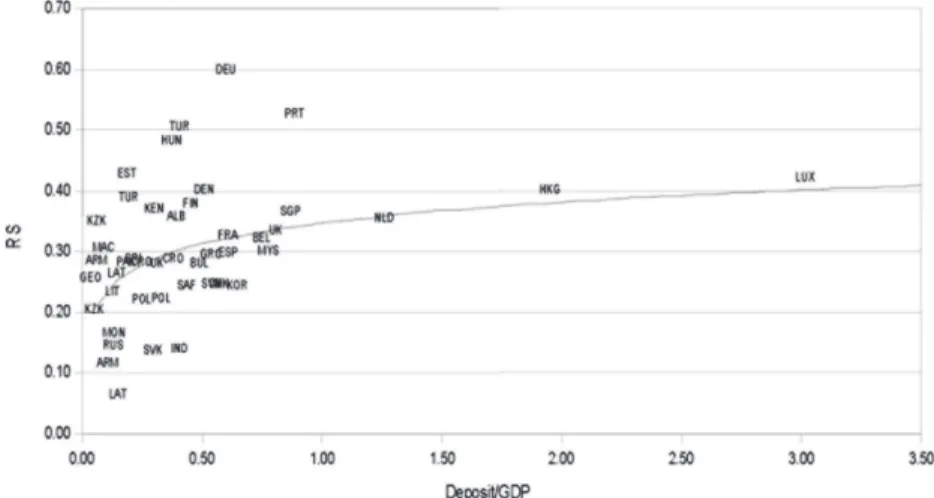
Appendix Figures A2–A4 in show the scatter plots of RS against the variables dis-cussed above, depicting associations in the expected directions. The following section presents a formal investigation of the significance of these observations via regression analyses.
Empirical Analysis
The benchmark regression models to investigate the relationships of deposits, invest-ments, and nonperforming loans with RS are given in Equations (1) to (3). Under each equation, the expected signs of coefficients are reported. Given that the event-study nature of the data implies a cross-sectional study as explained above, the regression models are constrained by the degrees of freedom problem; we therefore choose to report only the parsimonious models below.
Bank deposits are modeled to test the hypothesis that bank regulation increases bank deposits by improving depositors’ trust in the banking sector. While deposit insurance, a part of the RS index, may not itself be well designed to achieve depositors-induced market discipline, other features of the banking law may compensate for it, which is why we use a summary index RS. In testing this relationship, the usual control variables are chosen to be the return on deposits, savings, and the level of financial development.
DEPgdp = f
(
RS, rDep, Sgdp, CRgdp)
. (1)In Equation (1), DEPgdp stands for the GDP ratio of demand deposits in the banking sector. rDep is the real rate of interest on deposits; Sgdp and CRgdp stand for the ratios of savings and total bank credits to GDP (as a measure of financial market development), respectively.
Equation (2) presents an investment model as a function of real growth rate (GDPgr), which controls for the effects of business cycles, and the real lending rate (r), as the cost of investment. We add RS to this model to test the hypothesis that the quality of bank regulation and supervision increases investment by reducing transaction costs in the banking sector.
INVgdp = f
(
RS, GDPgr, r)
. (2)The regression model for nonperforming loans (as percent of credit) is given in Equa-tion (3). In this model, r is controlled for to proxy the moral hazard risk; the real value of borrowed funds decreases with inflation, which affects r positively. In addition, real GDP growth is expected to reduce moral hazard and hence NPLcr. Finally, RS is added to test the impact of the formal institutional framework on the realization of moral hazard.6
NPLcr = f
(
RS, GDPgr, r)
. (3)It can be argued that as much as RS may affect the banking performance, there may be socioeconomic factors that in turn affect both RS and the indicators of banking sector performance. Dincer and Neyapti (2008) provide evidence that variables such as past crises and EU membership have especially had a significant role in explaining the varia-tion in the extent of bank regulavaria-tion and supervision intensity across countries. These variables are not appropriate to instrument RS in the current analysis, however, because they are not fully exogenous to the estimated variables; one can argue that RS may also be affected by past banking performance.
Table 1. Correlations between the components of RS and bank performance
DEPgdp INVgdp NPLcr
RS (average) 0.30 –0.35 –0.33
Capital requirement 0.41 –0.37 –0.05
Lending 0.33 0.27 0.02
Ownership 0.17 –0.17 –0.38
Directors and managers 0.19 –0.38 –0.17
Reporting-recording –0.27 0.04 –0.50
Corrective action 0.28 0.12 0.24
Supervision –0.21 –0.20 –0.51
Deposit insurance 0.35 –0.62 –0.07
Hence, as common to many studies of this nature, we use dummies for legal-origin (see, e.g., Glaeser and Shleifer 2002; La Porta et al. 1999, 2002; Levine 2005) and the index of polity, which measures the extent of democracy (democ) and autocracy (autoc) as instruments of institutional variables, which in this case is RS. These instrumental variables reflect measurements of such factors that are slow to change, if they change at all, and can thus be taken as deeply exogenous to the variables of interest. Glaeser and Shleifer discuss the importance of legal-origin in explaining financial market develop-ment. In view of the foregoing discussion, the estimations of Equations (1)–(3) are performed using the generalized method of moments (GMM) estimation method, where RS is instrumented by legal-origin and polity variables.7
Appendix C reports the results of the first-stage regressions, which reveal the significant explanatory power of the instruments employed in the following analysis. In particular,
polity and democracy show positive and significant correlations with RS; autocracy has
a negative and significant coefficient as predicted. However, while UK legal origin has a positive significant relationship to RS, French legal origin appears insignificant, and German legal origin seems to have a negative relationship with RS. These observations are consistent with the discussions regarding the prevalence of the protestant ethics in the United Kingdom, which is often associated with greater potency for development, and the rather inflexible code of law that is of French origin versus the flexible nature of that of German origin, which may have made the need for formal reforms less necessary.
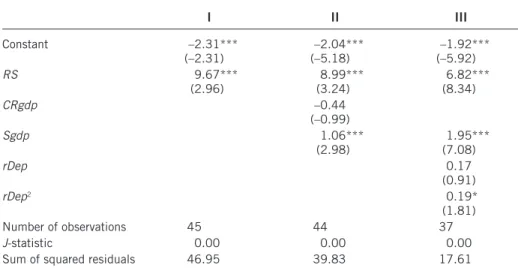
Table 2 reports the estimation results of Equation (1) in a stepwise fashion.8 Besides the positive effect of RS on deposits, which is a robust finding across the specifications, we observe that both savings (Sgdp) and real deposit interest rate (rDep) have the expected positive signs that are significant at the 1 percent level, the latter of which seems to have a nonlinear effect on deposits as observed in the significance of the squared term (rDep2 ). The proxy for financial market development (CRgdp) is not significant, however, and hence dropped from the regression in the last column. The high correlation between RS
Table 2. RS and depositor trust (dependent variable: DEPgdp)
I II III Constant –2.31*** (–2.31) (–5.18)–2.04*** (–5.92)–1.92*** RS 9.67*** (2.96) (3.24)8.99*** (8.34)6.82*** CRgdp –0.44 (–0.99) Sgdp 1.06*** (2.98) (7.08)1.95*** rDep 0.17 (0.91) rDep2 0.19* (1.81) Number of observations 45 44 37 J-statistic 0.00 0.00 0.00
Sum of squared residuals 46.95 39.83 17.61
Notes: GMM methodology is used. RS is instrumented with polity variables. t-ratios are in parenthe-ses. *** Statistical significance at the 1 percent level; ** statistical significance at the 5 percent level; * statistical significance at the 10 percent level.
and CRgdp may be leading this result.9 We also control for Standard & Poor’s global equity index as a measure of the return on alternative assets, but the coefficient on this variable is found insignificant. The above results are also observed to remain robust to the choice of instruments for RS. Hence, the findings support strongly that, in addition to the macroeconomic variables that the economic theory suggests to explain the level of deposits, RS has a significant role in mobilizing savings toward the banking sector.
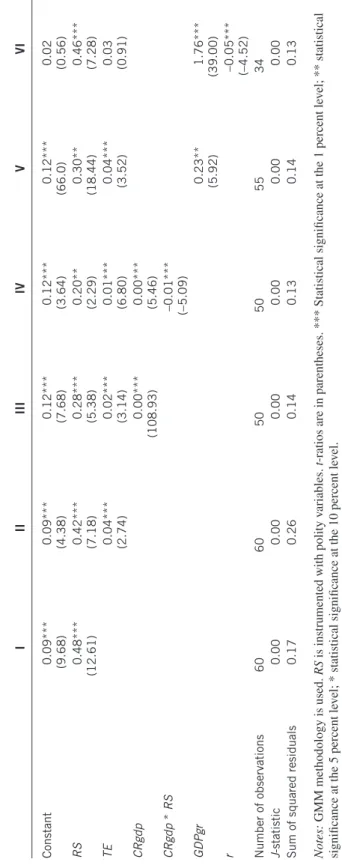
Table 3 shows that, in addition to the positive effect of GDPgr, RS is found to have a significant positive effect on investment. The effect of the real lending rate (r) is signifi-cantly negative, as expected. These findings remain robust after the addition of CRgdp, which controls for the level of financial market development; because CRgdp itselfis insignificant, however, that regression is not reported. We also use financial deepening (proxied by M2 over GDP) to control for financial market development; this variable turns out significant both alone and in interaction with RS, but loses its significance after the GDP growth and the interest rate are controlled for. In addition, we use a transition economies dummy (TE) considering that the pervasive market reforms those countries have undertaken may have led to a larger than average investment in the following period.10 While we find support for this hypothesis in regressions reported in the first two columns, we also observe that this variable loses its significance once the cost of investment is con-trolled for. We also control for the levels of economic development, proxied by per capita GDP, and financial openness. We observe that these variables do not exhibit additional explanatory power; hence, we do not report the regressions that include them.
In view of the varying samples across the reported regressions, we also run the regres-sions using only the sample of the estimation reported in column III of Table 3. This experiment (reported in Appendix E) reveals that while the coefficient of RS is found positive throughout, its significance emerges after controlling for the growth rate. These findings suggest that formal banking regulation plays a strong role in channeling banks’ asset composition toward investment.
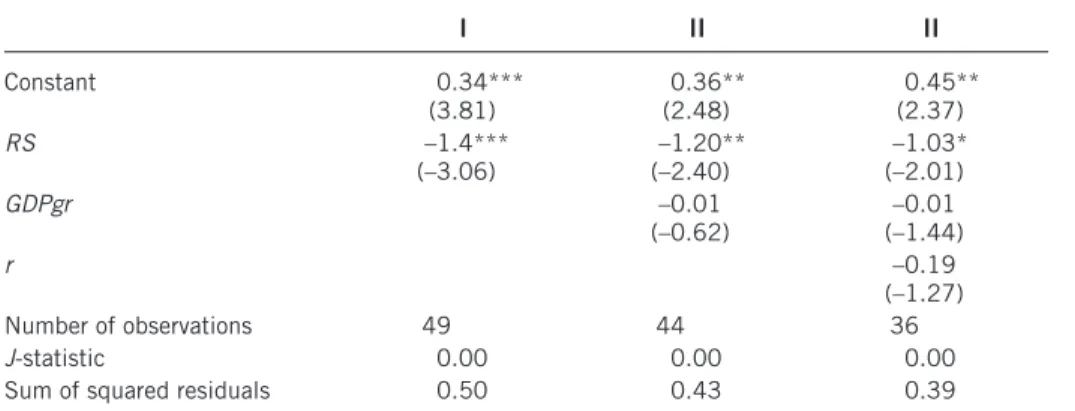
Our next set of regressions aims to address whether RS affects the ratio of credit not returned to banks. The answer to this question is strongly affirmative based on the evidence provided in Table 4; while RS is significantly negative, the rest of the control variables, GDPgr and r, are found insignificant. Including CRgdp to control for the level of financial market development does not change this result.
Several additional robustness checks can be reported as follows. In order to account for the possible shifts in deposit and investment behavior over time, we control for decade dummies for the 1990s and 2000s in the regression models reported above. If a bank law for a country observation is effective for most of the decade in question, the dummy takes the value of 1; otherwise, the dummy is 0. Although the time dimension of the data is limited due to the event-study nature of the current analysis, including these dummies helps control for the time trend in the explained variables. Focusing on the broadest specifications reported in the last columns of Tables 3 and 4, the following additional observations can be noted: Leaving the results reported above virtually unchanged, the 1990s dummy is positive and significant for deposits, whereas the dummy for the 2000s seems to have an insignificant effect. Both dummies are found insignificant in explaining investment and nonperforming loans.11
There is an ongoing debate in the literature with regard to the diminishing marginal benefit of RS; the argument may suggest that too much regulation may deter banking-sector efficiency. We test this claim by exploring the additional effects on banking-banking-sector performance of the high values of RS (RSh) measured either as above the median or
Table 3. RS and investment (dependent variable: INVgdp ) I II III IV V VI Constant 0.09*** (9.68) 0.09*** (4.38) 0.12*** (7.68) 0.12*** (3.64) 0.12*** (66.0) 0.02 (0.56) RS 0.48*** (12.61) 0.42*** (7.18) 0.28*** (5.38) 0.20** (2.29) 0.30** (18.44) 0.46*** (7.28) TE 0.04*** (2.74) 0.02*** (3.14) 0.01*** (6.80) 0.04*** (3.52) 0.03 (0.91) CRgdp 0.00*** (108.93) 0.00*** (5.46) CRgdp * RS –0.01*** (–5.09) GDPgr 0.23** (5.92) 1.76*** (39.00) r –0.05*** (–4.52) Number of observations 60 60 50 50 55 34 J -statistic 0.00 0.00 0.00 0.00 0.00 0.00
Sum of squared residuals
0.17 0.26 0.14 0.13 0.14 0.13 Notes: GMM methodology is used. RS
is instrumented with polity v
ariables.
t
-ratios are in parentheses. ***
Statistical significance at the 1
percent le vel; ** statistical significance at the 5 percent le vel; *
statistical significance at the 10 percent le
vel.
mean value or as above the “mean plus one standard deviation.” Measured either way, it is observed that the coefficient of RSh turns negative for both deposits and investment, but is significant only for the latter.12 It should be noted, however, that this finding is not robust across various specifications reported above. However, as testing for an optimal level of regulation is beyond the scope of the current study, we conclude that the evi-dence in the current paper indicates that increasing RS seems to deliver better banking performance on average.
Conclusion
Banking laws aim to reduce the vast amount of transaction costs, in the form of adverse selection and moral hazard problems, in the banking sector. Employing an index of the legal quality of bank regulation and supervision that measures the intensity of the for-mal mechanisms to address the numerous aspects of the potential transaction costs in the banking sector, we empirically test the hypothesis that RS improves banking-sector performance by affecting both depositor trust and borrower discipline.
The evidence presented in this paper, based on an event study of up to fifty-three countries, supports this hypothesis strongly: Deposits and investments exhibit positive and significant association with RS, whereas the association between nonperforming loansand RS is significantly negative. The results remain robust to the addition of control variables such as the possible nonlinearity in the effect of RS or the indicators of financial market development and decade dummies. The current study thus provides additional empirical justification for the focus on reforming the banking regulatory frameworks around the world in order to achieve efficient resource allocation and effective mobilization of sav-ings into investment as essential tenets of sustainable development.
Notes
1. Guiso et al. (2004) and Zak and Knack (2001) argue that both social capital and legal en-forcement are important in building trust.
Table 4. RS and nonperforming loans (dependent variable: NPLcr)
I II II Constant 0.34*** (3.81) (2.48)0.36** (2.37)0.45** RS –1.4*** (–3.06) (–2.40)–1.20** (–2.01)–1.03* GDPgr –0.01 (–0.62) –0.01 (–1.44) r –0.19 (–1.27) Number of observations 49 44 36 J-statistic 0.00 0.00 0.00
Sum of squared residuals 0.50 0.43 0.39
Source: Compiled by the authors based on the indicators in Kaufmann et al. (2008).
Notes: GMM methodology is used. RS is instrumented with governance, legal origin, and polity variables. t-ratios are in parentheses. *** Statistical significance at the 1 percent level; ** statistical significance at the 5 percent level; * statistical significance at the 10 percent level.
2. Output losses are measured by cumulative percent deviation from trend GDP (Laeven and Valencia 2008).
3. The quantification method for the list of the ninety-nine criteria, summarized above in the eight main categories, has been detailed in Neyapti and Dincer (2005) and is not repeated here for the sake of space.
4. All the macroeconomic indicators are obtained from the World Bank and the International Monetary Fund.
5. Because there are at most two observations per country, the data can be regarded as cross-sectional. In accordance with Hausman (1978), the fixed effects model is rejected; the short and unbalanced time dimension does not allow the use of random effects.
6. The negative effect of regulationon NPLs is also reported by Guiso et al. (2007) for the case of Italy.
7. The results of the ordinary least squares (OLS) estimations are reported in Appendix D; the findings are in line with the GMM results reported in Tables 2 through 4 although the significance of RS is weaker for the cases of both INVgdp and NPLcr.
8. J-statistics provide the test of overidentifying restrictions in a GMM context, and a small number, in general, indicates model (or instrument) validity (the critical value is given by the chi-squared distribution with [p – q] degrees of freedom, where q is the moment conditions and p is the number of parameters to be estimated).
9. Regressions in Table 2 are repeated using time deposits as the dependent variable; the results remain virtually the same as above and hence are not reported given the relatively limited observations on this variable.
10. We report the TE dummy only in the INVgdp model because it is found insignificant in
DEPgdp and NPLcr data cover only the 2000s, when those economies are considered no longer to be in transition.
11. However, in the restricted versions of these models, decade dummies are observed to pick up some of the variation, turning out significant.
12. These results are available from the authors upon request.
References
Ag¬ca, S*., and O. Celasun. 2012. “Banking Sector Reforms and Corporate Borrowing Costs in Emerging Markets.” Emerging Markets Finance & Trade 48, supp. 4: 71–95.
Allen, F., and D. Gale. 2007. Understanding Financial Crises. New York: Oxford University Press.
Barth, J.R.; G. Caprio; and R. Levine. 2005. Rethinking Bank Regulation: Till Angels Govern.
New York: Cambridge University Press.
Calderon, C.; A. Chong; and A. Galindo. 2001. “Structure and Development of Financial Institu-tions and Links with Trust: Cross-Country Evidence.” Working Paper no. 444, Research Department Inter-American Development Bank, Washington, DC.
Cosimano, T.F., and D. Hakura. 2011. “Bank Behavior in Response to Basel III: A Cross-Country Analysis.” Working Paper no. 11/119, International Monetary Fund, Washington, DC.
De Haan, J., and C.T. Shehzad. 2009. “Financial Reform and Banking Crises.” Working Paper no. 2870, CESifo, Munich.
Demirgüç-Kunt, A., and H. Huizinga. 1999. “Determinants of Commercial Bank Interest Margins and Profitability: Some International Evidence.” World Bank Economic Review 13, no. 2: 379–408.
Dincer, N., and B. Neyapti. 2008. “What Determines the ‘Legal’ Quality of Bank Regulation and Supervision?” Contemporary Economic Policy 26, no. 4: 607–622.
Glaeser, E., and A. Shleifer. 2002. “Legal Origins.” Quarterly Journal of Economics 117, no. 4: 1193–1229.
Guiso, L.; P. Sapienza; and L. Zingales. 2004. “The Role of Social Capital in Financial Develop-ment.” American Economic Review 94, no. 3: 526–556.
———. 2007. “The Cost of Banking Regulation.” Working Paper no. ECO 2007/43, European University Institute, Fiesole, Italy.
Hausman, J. 1978. “Specification Tests in Econometrics.” Econometrica 46, no. 6: 1251–1271.
Kaufmann, D.; A. Kraay; and M. Mastruzzi. 2008. “Governance Matters VII: Aggregate and Individual Governance Indicators for 1996–2007.” Policy Research Working Paper no. 4654, World Bank, Washington, DC.
Kilinc, M., and B. Neyapti. 2012. “Bank Regulation and Supervision and Its Welfare Implica-tions.” Economic Modelling 29, no. 2: 132–141.
Kutan, A.M.; E. Ozsoz; and E.W. Rengifo. 2012. “Cross-Sectional Determinants of Bank Per-formance Under Deposit-Dollarization in Emerging Markets.” Emerging Markets Review 13, no. 4: 478–492.
La Porta, R.; F. Lopez-de-Silanes; and A. Shleifer. 1999. “Corporate Ownership Around the World.” Journal of Finance 54, no. 2: 471–517.
———. 2002. “Government Ownership of Banks.” Journal of Finance 57, no. 1: 265–301. Laeven, L., and F. Valencia. 2008. “Systemic Banking Crises: A New Database.” Working Paper
no. 08/224, International Monetary Fund, Washington, DC.
Levine, R. 1998. “The Legal Environment, Banks, and Long-Run Economic Growth.” Journal of Money, Credit, and Banking 30, no. 3: 596–613.
———. 2005. “Finance and Growth: Theory and Evidence.” In Handbook of Economic Growth, vol. 1, ed. P. Aghion and S. Durlauf, pp. 865–934. Amsterdam: Elsevier.
Louzis, D.P.; A.T. Vouldis; and V.L. Metaxas. 2012. “Macroeconomic and Bank-Specific Deter-minants of Non-Performing Loans in Greece: A Comparative Study of Mortgage, Business and Consumer Loan Portfolios.” Journal of Banking and Finance 36, no. 4: 1012–1027. Neyapti, B., and N. Dincer. 2005. “Measuring the Quality of Bank Regulation and Supervision
with an Application to Transition Economies.” Economic Inquiry43, no. 1: 79–99. Nkusu, M. 2011. “Nonperforming Loans and Macrofinancial Vulnerabilities in Advanced
Economies.” Working Paper no. 11/161, International Monetary Fund, Washington, DC. Rinaldi, L., and A. Sanchis-Arellano. 2006. “Household Debt Sustainability: What Explains
Household Non-Performing Loans? An Empirical Analysis.” Working Paper no. 0570, Euro-pean Central Bank, Frankfurt.
Schmitz, B. 2005. “The Impact of Basel I Capital Regulation on Bank Deposits and Loans: Empirical Evidence for Europe.” IIW Institute for International Economics and ZEI Center for European International Studies, University of Bonn.
Vogiazas, S.D., and E. Nikolaidou. 2011. “Investigating the Determinants of Nonperforming Loans in the Romanian Banking System: An Empirical Study with Reference to the Greek Crisis.” Economics Research International: article 214689, 1–13.
Zak, P., and S. Knack. 2001. “Trust and Growth.” Economic Journal 111, no. 470: 295–321.
Appendix A. Scatter Plots of RS and Financial Performance
Figure A1. Scatter plot of RS versus output loss from crises
Figure A2. Scatter plot of RS versus deposits-to-GDP ratio
Figure A3. Scatter plot of RS and investment-to-GDP ratio
Figure A4. Scatter plot of RS versus the ratio of nonperforming loans
Appendix B. RS and its components (based on Dincer and Neyapti 2008 and Neyapti and Dincer 2005) Country RS A B C D E F G H Argentina 1977 0.24 0.00 0.00 0.08 0.20 0.15 0.67 0.13 0.69 — — — — — — — — — Belgium 1993 0.31 0.33 0.00 0.35 0.40 0.48 0.00 0.44 0.46 — — — — — — — — — Brazil 1964 0.17 0.17 0.28 0.00 0.40 0.24 0.00 0.25 0.00 Brazil 1974 0.21 0.17 0.28 0.00 0.00 0.24 0.75 0.25 0.00 Denmark 1996 0.39 0.72 0.00 0.24 0.20 0.65 0.67 0.63 0.00 — — — — — — — — — Egypt 1957 0.35 0.47 0.17 0.08 0.20 0.60 0.67 0.38 0.27 — — — — — — — — — England 1979 0.27 0.44 0.06 0.00 0.20 0.27 0.50 0.13 0.54 England 1987 0.32 0.44 0.00 0.00 0.60 0.27 0.33 0.31 0.62 Finland 1997 0.37 0.63 0.20 0.21 0.00 0.65 0.33 0.38 0.54 — — — — — — — — — France 1984 0.31 0.17 0.00 0.13 0.40 0.53 0.67 0.44 0.19 — — — — — — — — — Germany 1993 0.59 0.63 0.39 0.54 0.33 0.62 0.75 0.81 0.62 — — — — — — — — — Greece 1993 0.28 0.40 0.00 0.53 0.20 0.37 0.33 0.31 0.12 — — — — — — — — — Hong Kong 1997 0.39 0.63 0.38 0.44 0.20 0.43 0.67 0.38 0.00 — — — — — — — — — Indonesia 1967 0.13 0.33 0.06 0.00 0.00 0.36 0.17 0.13 0.00 Indonesia 1992 0.13 0.17 0.04 0.00 0.00 0.18 0.50 0.06 0.08 Kenya 1995 0.36 0.67 0.19 0.06 0.20 0.27 0.67 0.44 0.35 — — — — — — — — —
Korea 1998 0.23 0.47 0.22 0.08 0.20 0.25 0.50 0.13 0.00 — — — — — — — — — Kuwait 1968 0.22 0.38 0.17 0.00 0.20 0.26 0.67 0.13 0.00 — — — — — — — — — Lebanon 1963 0.33 0.50 0.20 0.00 0.20 0.27 0.67 0.19 0.62 — — — — — — — — — Luxemburg 1993 0.41 0.40 0.11 0.21 0.20 0.43 0.67 0.56 0.69 — — — — — — — — — Malaysia 1989 0.29 0.11 0.22 0.46 0.20 0.38 0.50 0.44 0.00 — — — — — — — — — Netherlands 1992 0.34 0.22 0.00 0.29 0.20 0.60 0.67 0.69 0.08 — — — — — — — — — Pakistan 1962 0.27 0.47 0.11 0.00 0.00 0.52 0.67 0.38 0.00 — — — — — — — — — Philippines 1948 0.31 0.58 0.15 0.04 0.20 0.20 0.67 0.00 0.65 — — — — — — — — — Portugal 1992 0.51 0.35 0.22 0.40 0.40 0.76 0.67 0.63 0.69 — — — — — — — — — Singapore 1994 0.35 0.58 0.30 0.08 0.20 0.55 0.67 0.44 0.00 — — — — — — — — — South Africa 1990 0.23 0.53 0.00 0.14 0.20 0.40 0.33 0.25 0.00 — — — — — — — — — Spain 1988 0.28 0.17 0.00 0.25 0.00 0.33 0.33 0.50 0.69 — — — — — — — — — Sri Lanka 1988 0.27 0.28 0.06 0.08 0.20 0.47 0.67 0.44 0.00 — — — — — — — — — Switzerland 1934 0.24 0.35 0.00 0.21 0.00 0.50 0.58 0.31 0.00 — — — — — — — — — (continues)
Country RS A B C D E F G H Tunisia 1967 0.20 0.39 0.00 0.08 0.20 0.22 0.50 0.25 0.00 — — — — — — — — — Turkey 1985 0.38 0.60 0.31 0.29 0.20 0.33 0.67 0.19 0.42 Turkey 1999 0.49 0.68 0.34 0.44 0.40 0.37 0.67 0.44 0.62 Albania 1996 0.34 0.35 0.01 0.24 0.40 0.85 0.67 0.20 0.00 Armenia 1992 0.07 0.28 0.00 0.08 0.00 0.08 0.00 0.08 0.00 Armenia 1996 0.26 0.37 0.00 0.21 0.20 0.69 0.33 0.26 0.00 Azerbaijan 1992 0.08 0.17 0.00 0.10 0.00 0.26 0.00 0.08 0.00 Azerbaijan 1996 0.24 0.45 0.03 0.22 0.33 0.59 0.17 0.14 0.00 Belarus 1992 0.12 0.28 0.25 0.00 0.00 0.14 0.17 0.08 0.07 — — — — — — — — — Bulgaria 1992 0.25 0.47 0.17 0.08 0.40 0.38 0.17 0.32 0.00 — — — — — — — — — Croatia 1993 0.25 0.63 0.08 0.06 0.33 0.41 0.17 0.20 0.14 Croatia 1996 0.26 0.69 0.11 0.15 0.20 0.42 0.17 0.20 0.14
Czech Republic and Slovakia 1992
0.26 0.28 0.02 0.08 0.00 0.13 0.75 0.32 0.50 — — — — — — — — — Estonia 1994 0.42 0.63 0.13 0.26 0.53 0.62 0.67 0.49 0.00 — — — — — — — — — Georgia 1991 0.12 0.17 0.00 0.08 0.00 0.27 0.17 0.02 0.25 Georgia 1996 0.22 0.38 0.00 0.19 0.20 0.45 0.50 0.08 0.00 Hungary 1994 0.48 0.71 0.10 0.44 0.53 0.75 0.50 0.58 0.21 — — — — — — — — — Kazakhstan 1993 0.17 0.17 0.00 0.13 0.20 0.51 0.17 0.08 0.07 Kazakhstan 1995 0.33 0.44 0.00 0.17 0.40 0.73 0.50 0.32 0.07 Appendix B. Continued
Kyrgyzstan 1991 0.20 0.18 0.50 0.00 0.00 0.30 0.17 0.02 0.46 — — — — — — — — — Latvia 1992 0.03 0.11 0.00 0.00 0.00 0.13 0.00 0.02 0.00 Latvia 1995 0.23 0.63 0.12 0.17 0.00 0.48 0.33 0.14 0.00 Lithuania 1992 0.20 0.28 0.06 0.31 0.00 0.46 0.33 0.08 0.07 — — — — — — — — — Macedonia 1994 0.30 0.58 0.05 0.15 0.00 0.24 0.83 0.20 0.39 — — — — — — — — — Moldova 1991 0.05 0.17 0.00 0.08 0.00 0.11 0.00 0.02 0.00 — — — — — — — — — Mongolia 1991 0.12 0.44 0.00 0.00 0.00 0.11 0.33 0.08 0.00 — — — — — — — — — Poland 1993 0.24 0.23 0.03 0.19 0.00 0.43 0.75 0.26 0.00 Poland 1997 0.35 0.68 0.10 0.00 0.00 0.72 0.67 0.64 0.00 Russia 1996 0.10 0.28 0.00 0.04 0.27 0.17 0.00 0.02 0.00 — — — — — — — — — Slovakia 1996 0.21 0.28 0.04 0.13 0.00 0.27 0.67 0.26 0.00 — — — — — — — — — Slovenia 1992 0.14 0.35 0.06 0.13 0.13 0.24 0.00 0.07 0.14 — — — — — — — — — Tajikistan 1991 0.07 0.17 0.00 0.04 0.00 0.20 0.17 0.02 0.00 — — — — — — — — — Ukraine 1993 0.12 0.36 0.00 0.08 0.00 0.30 0.17 0.02 0.00 — — — — — — — — — Uzbekistan 1991 0.14 0.28 0.00 0.08 0.00 0.24 0.17 0.02 0.32 Uzbekistan 1994 0.16 0.44 0.00 0.08 0.00 0.24 0.17 0.02 0.32
Appendix C. First-Stage Regressions—Estimating RS I II III IV V VI VII VIII IX Constant 0.24*** (29.10) 0.28*** (29.85) 0.19*** (18.40) 0.25*** (69.38) 0.29*** (118.96) 0.20*** (38.16) 0.25*** (33.58) 0.29*** (25.91) 0.20*** (30.86) Legal origin: UK 0.04*** (3.66) 0.03*** (4.91) 0.05*** (3.43)
Legal origin: Fra
–0.01 (–0.76) –0.02 (–1.05) –0.00 (–0.20)
Legal origin: Ger
–0.02*** (–5.60) –0.01*** (–2.96) –0.04*** (–29.68) Polity 0.01*** (40.57) 0.01*** (7.84) 0.01*** (16.13) Autocracy –0.01*** (–13.64) –0.01*** (–5.78) –0.01*** (–9.79) Democracy 0.01*** (33.04) 0.01*** (9.42) 0.01*** (35.47) Number of observations 59 59 61 59 59 61 59 59 61
Sum of squared residuals
0.64 0.66 0.69 0.65 0.66 0.70 0.64 0.66 0.68 Notes: t
-ratios are in parentheses. ***
Statistical significance at the 1
percent le
vel; **
statistical significance at the 5
percent le
vel; *
statistical significance at the 10
per
-cent le
vel.
Table D1. RS and depositor trust (dependent variable: DEPgdp) I II III Constant –0.02 (–1.21) (–5.17)–0.29*** (–2.67)–0.46** RS 1.75*** (7.02) (5.60)0.67*** (11.50)1.43*** CRgdp 0.51*** (9.23) Sgdp 1.43*** (4.54) (4.42)2.70*** rDep 0.07* (1.73) rDep2 0.08** (2.32) Number of observations 45 44 37
Sum of squared residuals 10.29 6.49 6.82
Notes:t-ratios are in parentheses. *** Statistical significance at the 1 percent level; ** statistical significance at the 5 percent level; * statistical significance at the 10 percent level.
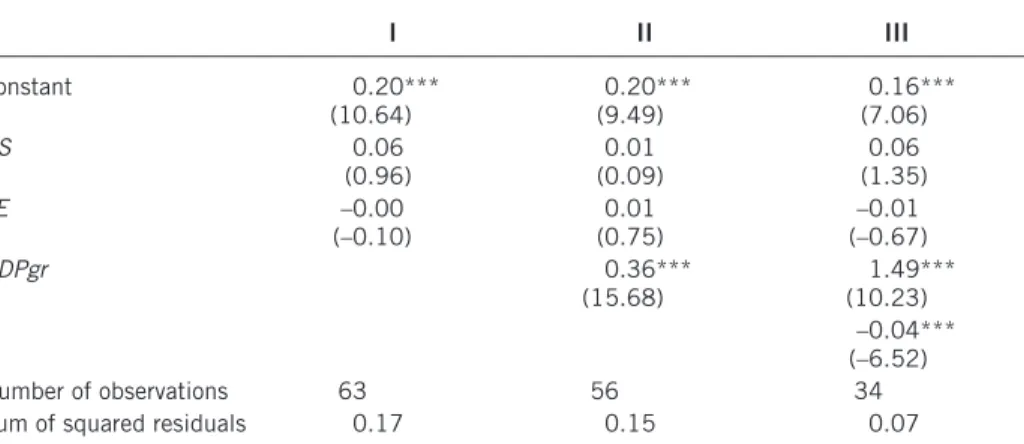
Appendix D. OLS Regressions
Table D2. RS and investment (dependent variable: INVgdp)
I II III Constant 0.20*** (10.64) (9.49)0.20*** (7.06)0.16*** RS 0.06 (0.96) (0.09)0.01 (1.35)0.06 TE –0.00 (–0.10) 0.01 (0.75) –0.01 (–0.67) GDPgr 0.36*** (15.68) (10.23)1.49*** r –0.04*** (–6.52) Number of observations 63 56 34
Sum of squared residuals 0.17 0.15 0.07
Notes:t-ratios are in parentheses. *** Statistical significance at the 1 percent level; ** statistical significance at the 5 percent level; * statistical significance at the 10 percent level.
Appendix E. Adjusting the sample in Table 3 (dependent variable: INVgdp) I II III Constant –0.03 (–0.15) (0.42)0.02*** (0.56)0.02 RS 0.78 (1.33) (6.41)0.49*** (7.28)0.46*** TE 0.06 (0.74) 0.03 (1.06) 0.03 (0.91) GDPgr 1.38*** (9.26) (39.00)1.76*** r –0.05*** (–4.52) Number of observations 34 34 34 J-statistic 0.00 0.00 0.00
Sum of squared residuals 0.30 0.14 0.13
Notes:t-ratios are in parentheses. *** Statistical significance at the 1 percent level; ** statistical significance at the 5 percent level; * statistical significance at the 10 percent level.
Table D3. RS and nonperforming loans (dependent variable: NPLcr)
I II II Constant 0.13*** (4.93) (2.86)0.10*** (0.68)0.09 RS –1.17*** (–2.02) (–1.36)–0.12 (–1.03)–0.11 GDPgr 0.00 (0.75) –0.00 (–0.11) r 0.02 (0.20) Number of observations 49 44 36
Sum of squared residuals 0.20 0.15 0.12
Notes:t-ratios are in parentheses. *** Statistical significance at the 1 percent level; ** statistical significance at the 5 percent level; * statistical significance at the 10 percent level.
To order reprints, call 1-800-352-2210; outside the United States, call 717-632-3535.