LibGaze: Real-time gaze-tracking of freely moving observers
for wall-sized displays
Vision, Modeling, and Visualization
Proceedings
Sebastian Herholz, Lewis L. Chuang, Thomas G. Tanner, Heinrich H. B¨ulthoff and Roland W. Fleming Max-Planck-Institut f¨ur biologische Kybernetik
Email:{sebastian.herholz,lewis.chuang}@tuebingen.mpg.de
Abstract
We present a mobile system for tracking the gaze of an observer in real-time as they move around freely and interact with a wall-sized display. The system combines a head-mounted eye tracker with a mo-tion capture system for tracking markers attached to the eye tracker. Our open-source software library
libGaze provides routines for calibrating the
sys-tem and computing the viewer’s position and gaze direction in real-time. The modular architecture of our system supports simple replacement of each of the main components with alternative technology.
We use the system to perform a psychophysical user-study, designed to measure how users visually explore large displays. We find that observers use head move- ments during gaze shifts, even when these are well within the range that can be com-fortably reached by eye movements alone. This suggests that free movement is important in nor-mal gaze behaviour,motivating further applications in which the tracked user is free to move.
1
Introduction
Applications in many domains can benefit from knowledge of the user’s eye movements. For ex-ample, in market research or user interface design, fixation patterns can be used to assess how effec-tively items attract the user’s attention, and in train-ing contexts, eye-movement data can be used to as-sess the user’s performance. If gaze is tracked in real-time, the displayed data—whether medical vi-sualization or a computer game—can adapt to the current interests of the user or exploit known lim-itations of human vision while avoiding noticeable artifacts.
Figure 1: The gaze-tracking system in use. In this demonstration scenario, the observer is viewing a gaze-contingent multi-resolution display, with high resolution surrounding the point of fixation and low-resolution in the periphery.
Many eye-tracking systems require the ob-server’s head to move as little as possible during tracking, which considerably reduces the range of potential applications, and may also lead to unnatu-ral eye-movements if the field of view is large.
To overcome these limitations, we present a sys-tem for tracking the gaze of freely-moving ob-servers in real-time as they walk around, gesture and interact with large (wall-sized) display screens (see Figure 1). Our goal is to achieve a system that is stable, accurate and fast enough to enable gaze-contingent changes to the displayed images in
real-time as the user views and interacts with data on
the screen. This implementation is based on free software and off-the-shelf hardware components, and should be flexible enough to be widely adopted by other researchers.
This system was developed as part of a col-laboration (BW-FIT grant) between researchers in
computer graphics, visualization, HCI, and psy-chophysics, on the design and effective use of large, high-resolution display screens. In this context, ob-servers typically need to move eye, head, and body in order to view all portions of the screen. Conse-quently, the methods presented here are tailored to gaze tracking while interacting with large screens. However, the system can readily be extended for users acting in real physical space of comparable size, such as CAVEs, offices or laboratories.
After the description of the implementation and use of the system, we report the application of this system in a behavioral study which measured how observers co-ordinate eye- and head-movements when performing a variety of tasks. Summary statistics are reported on the patterns of eye and head movements that control gaze in natural view-ing behavior.
1.1 Motivation: some potential applica-tions
A system that can accurately track both the posi-tion and gaze of an observer has many potential ap-plications. For example, data about where an ob-server looks, and how they move to seek informa-tion, can be useful for evaluating large-scale data visualizations, which are used to explore and under-stand complex data sets such as national telephone networks or protein pathways. As the quantity of data to be visualized increases, it becomes increas-ingly difficult for the user to attend to all of the data presented. By relating gaze patterns to task perfor-mance, it may be possible to identify weaknesses of a particular visualization method, and to establish general guidelines for improving the intelligibility of very large data visualizations.
In behavioural experiments for psychology, neu-roscience or medical research, the system can be used to study natural viewing behaviours during complex tasks that typically involve coordinated eye- head- and body-movements. Data can be used to understand the planning and execution of gaze actions, to diagnose disorders, or to infer which stimulus features are relevant for perform-ing a given task. In the second half of this paper, we use the system to perform experiments showing that subjects naturally use head movements in a va-riety of tasks, even when there is no physiological requirement to do so.
A system that operates in real-time has fur-ther potential applications, because the content pre-sented on the display can be modified in response to the observers gaze and movements. Probably the best known gaze-contingent systems are multi-resolution displays that exploit the limitations of vi-sual acuity and sensitivity outside the fovea [1, 2, 3]. Typical systems present a high-resolution rendition of the image in the neighbourhood surrounding the center of gaze and a severely reduced rendition in the periphery to save computing resources without the observer noticing artefacts.
Gaze data can also be used to increase interac-tivity. For example, in the context of virtual reality simulations and visualization of 3D data (e.g., auto-mobile prototypes), the virtual camera frustrum can be yoked to the continuously changing head posi-tion of the observer. This results in moposi-tion paral-lax cues that yield a vivid impression of 3D space and concomitant improvements in ‘presence’ (the subjective impression of ‘immersion’ in the simu-lated environment). Gaze-contingent modifications are also applicable to 2D or abstract data tions. For example, dense regions of the visualiza-tion can be magnified to reveal details in response to user approach, or recently fixated locations can be highlighted to aid the user return to the ‘nee-dle in the haystack’. Indeed, once the stimulus and task factors that govern gaze movements are bet-ter understood, it may also be possible to use this knowledge to attract the user’s attention to regions of the display on demand [4]. Finally, HCI can also benefit from real-time tracking: at small computa-tional cost it is possible to track addicomputa-tional markers attached to fingers or other objects for gesture based interactions with the data.
1.2 Previous work
Recently, some systems for camera-based eye-trackers have been developed that allow for the cal-ibration of eye-orientations in a head-unrestrained environment (e.g., [5, 6]). Here, we extend this work by providing a fully-implemented open source software library, with an emphasis on (i) real-time tracking and (ii) easy adoption. Due to the modular architecture, the system is not dependent on specific brands of eye- and body-tracking hardware, and can be used with a wide range of display types.
2
System Implementation
The system combines a video-based eye-tracker with a motion capture (MoCap) system for tracking the observer’s head movements. The output of the combined system is gaze data defined in 3D space, as shown in Figure 1. The 3D coordinates normally correspond to the real world, although they could also be used to specify gaze in a virtual environ-ment. The gaze data consists of two parts:
• view point,~vW CS
g : origin of gaze-ray • gaze vector,~dW CS
g : direction of gaze-ray In combination with a large projection screen or tiled display wall, the gaze position,~pW CS
g of the observer (i.e. the point on the display at which the observer is currently looking) is the intersec-tion point of the gaze-ray and the display-plane, as shown in figure 1.
A head-mounted video-based eye-tracker uses cameras to image the observer’s eyes and record pupil movements. The system returns the(x, y) co-ordinates of the pupil’s centroid in the camera im-ages. The system we have developed at the MPI uses an Eyelink II eye-tracker.
The MoCap system tracks a rigid body that is attached to the observer’s head or to the frame of the head-mounted eye-tracker. This system uses 4 Vicon infra-red cameras tracking 5 retro-reflective markers.
2.1 Coordinate systems
When combining data from the two tracking sys-tems to estimate gaze in real world coordinates, three different coordinate systems have to be taken into account (see Figure 2). In this paper, coordinate systems are denoted by superscripts; objects of in-terest are specified by subscripts (g=gaze, h=head, e=eye and he=head to eye relation).
The world coordinate system (WCS) represents the environment within which the output gaze esti-mates are framed. This may be the physical room in which the system is installed, or a virtual world that is presented to the observer. Every surface for which gaze position is to be estimated (e.g. the pro-jection screen, or objects in the scene) should have a representation in the WCS, so that the intersection of the gaze ray with the surface can be calculated.
The head coordinate system (HCS) describes the head of the observer and the location of all the elements relative to the head. A 3D vector within
the HCS points to a location of one of its elements (e.g. position of the eyes). The origin of the HCS is specified by the tracked object (e.g. markers), which are attached to the observers head.
The eye coordinate system (ECS) is a local de-scription of the observer’s eye. The origin is the centre of the eyeball. A vector in the ECS repre-sents the viewing direction of the eye. The ECS is oriented such that the X-axis points to the center of the field of view.
Figure 2:The head of the observer and the locations and orientations of the three different coordinate systems.
2.2 Combining eye and head data to esti-mate gaze
The motion capturing system returns (i) a 3D vector,
~ pW CS
h , which specifies the position of the tracked object attached to the observer’s head in the WCS, and (ii) a 3x3 matrix,OW CS
h , describing the orien-tation of the tracked object in WCS. The relation-ship between the tracked object and the observer’s eyes consists of a translation vector, ~vHCS
he and a rotation matrix, RHCS
he that together represent the transformation from HCS to ECS. As the position of the eye relative to the head is assumed to be con-stant, this mapping is measured only once, in the calibration procedure (see 2.3 and 2.3).
~vW CS g =~p W CS h +O W CS h ∗~v HCS he (1)
The eye-tracking system returns the 2D position (x, y) of the pupil’s centroid in the camera images. Depending on the number of cameras, the eye-tracker can return the pupil positions for one or both eyes. By using a mapping functionM(x, y)as de-scribed by [7] the 2D image position can be mapped
to a 3D viewing direction vector for the eye~dECS
e in the ECS. This mapping function is estimated from the calibration procedure, described below.
~ dECS
e =M(x, y) (2)
To translate~dECS
e into the gaze direction~d
W CS
g in WCS, we first translate it into the HCS. From there it can be easily translated into the WCS using the orientation matrixOW CS
h of the head tracked ob-ject. To translate~dECS
e to the HCS,~d
ECS
e has to be multiplied with the inverse of the rotation matrix relating HCS to ECS. ~ dW CSg =O W CS h ∗R HCS he −1 ∗~dECSe (3) Given~vW CS g and~d W CS g , it is possible to compute the intersection of the gaze ray with the screen plane (or any other known surface in the WCS).
2.3 Calibration procedure
Recall that, in addition to the raw data returned by the eye tracker and motion capturing system, we require: (i) the relationship between the HCS and the ECS (~vHCS
he ,R
HCS
he ), and (ii) a mapping func-tionM(x, y)that maps from the eyetracker’s im-age coordinates to the view direction vector~vECS
e in ECS. These relationships vary between observers and even between different sessions with the same observer, due to variations in head shape and the placement of the head tracking object. The po-sitions of the eyetracker cameras generally vary across sessions too. Consequently, a three stage cal-ibration procedure is required at the start of each session. The first two stages are for calculating the relationships between the three coordinate systems, and the third stage is a standard eye-tracker calibra-tion for mapping from pixel posicalibra-tion in the camera image to a 3D viewing vector in ECS.
Estimating eye position relative to head: The
relationship between the tracked head position and the observer’s eyes is measured with the aid of an additional tracked object. Taking minimal errors into account, the position of both eyes is assumed to be at the nasal bridge. The observer is instructed to place the tip of a tracked wand on the nasal bridge. On key-press, the relationship between the head ob-ject~pW CS
h and the wand~p
W CS
e is recorded. Be-cause both points are represented in the WCS, the
translation vector has to be transformed into the HCS: ~ vHCShe =O W CS h −1 ∗(~pW CSe −~p W CS h ) (4)
Estimating orientation of ECS relative to HCS:
The relationship between the orientations of the HCS and the ECS is represented by the rotation ma-trixRHCS
he , which is estimated using the following calibration procedure.
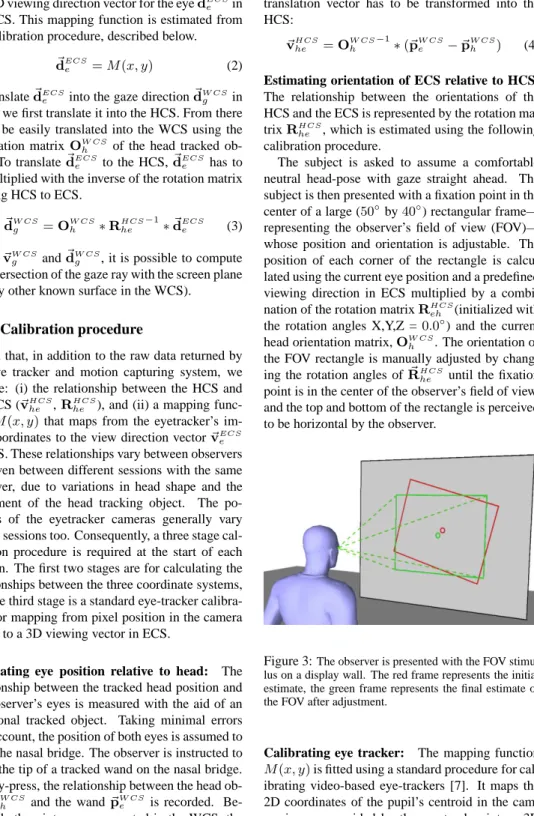
The subject is asked to assume a comfortable neutral head-pose with gaze straight ahead. The subject is then presented with a fixation point in the center of a large (50◦by40◦) rectangular frame—
representing the observer’s field of view (FOV)— whose position and orientation is adjustable. The position of each corner of the rectangle is calcu-lated using the current eye position and a predefined viewing direction in ECS multiplied by a combi-nation of the rotation matrixRHCS
eh (initialized with the rotation angles X,Y,Z =0.0◦) and the current head orientation matrix,OW CS
h . The orientation of the FOV rectangle is manually adjusted by chang-ing the rotation angles ofR~HCS
he until the fixation point is in the center of the observer’s field of view, and the top and bottom of the rectangle is perceived to be horizontal by the observer.
Figure 3:The observer is presented with the FOV stimu-lus on a display wall. The red frame represents the initial estimate, the green frame represents the final estimate of the FOV after adjustment.
Calibrating eye tracker: The mapping function
M(x, y)is fitted using a standard procedure for cal-ibrating video-based eye-trackers [7]. It maps the 2D coordinates of the pupil’s centroid in the cam-era images provided by the eye-tracker into a 3D
viewing vector in ECS, represented with two angles using spherical coordinates. The observer is pre-sented with a sequence of fixation points from a grid of predefined positions in random order. The posi-tion on the display of a fixaposi-tion point is calculated using the desired location in the observer’s field of view and the current postion and orientation of the observer. The fixation point is displayed until a sac-cadic eye movement was followed by a stable fixa-tion. After the data for the entire grid has been col-lected the mapping function is fit to the data. This fit is then validated by repeating the fixation grid sequence, and measuring the angular error between the estimated gaze position and the true position of the fixation points. If the mean error is below a user defined threshold (e.g. 1.5◦) the calibration is accepted, otherwise the calibration procedure is repeated.
Drift Correction: Drift Correction is an
addi-tional procedure to check that the calibration of the eye-tracker is still valid and to correct for small drifts that accumulate over time. This is especially important for our mobile system as free head and body movements can cause larger errors to accrue than in standard eye-tracking with a fixed head posi-tion. A single fixation point is presented at the cen-ter of FOV. Afcen-ter the observer fixated the target the calculated gaze position is compared to the actual position of the fixation point. If the error is below a certain threshold (typically<= 2.0◦) the collected
data can be used to adjust the eyetracker mapping function. If the difference is above the threshold a recalibration is advised.
2.4 Software Implementation (libGaze)
The software for the combined gaze-tracking is implemented in a platform independent C library, called libGaze (tested on Linux, MacOSX and Windows XP). It is freely available as an open source project fromhttp://www.sourceforge. net/projects/libgaze. We have implemented APIs for: Java (JGaze), Python (PyGaze), c# (csGaze) and C++ (libGaze++).
To be independent of the specific hardware sys-tems used for tracking eye or head movements libGaze uses a modular system to wrap its under-lying hardware components. LibGaze uses four dif-ferent module types, each module has a difdif-ferent
task and contributes specified set of functions to libGaze. A module is implemented as a dynamic C library, loaded at run-time.
Figure 4: The diagram shows all modules (left) needed by libGaze (center) to calculate the gaze data and the ap-plication (right) which uses libGaze without needing to now which hardware is used by the modules.
Eye-/Head-tracker module: An eye- or
head-tracker module acts as driver for the tracking sys-tem, used to track the eye- or head movements. The driver must implement functions for: opening a connection; disconnect; starting and stopping the tracking process; and getting the current tracking data from the tracker.
Display module: The content can be presented to
the observer on a range of display types, including large planar projection walls; tiled displays; curved screens or display cubes. This flexibility is achieved by out-sourcing the calculation of gaze-position for each display type to a display module. Each display module offers libGaze a set of function for calcu-lating 2D display coordinates from gaze-rays and returns the 3D position related to the WCS of a 2D display coordinate.
Calibration module: The mapping from 2D
pupil position to a 3D viewing vector can be per-formed by many different algorithms, which differ in accuracy and stability. The calibration module makes it easy to flexibly swap algorithms. These modules offer functions to calculate the mapping function; to map 2D pupil positions in viewing vec-tors in real-time; and to apply a drift correction to the calculated mapping function.
EyeHeadTracker: All modules are combined by
re-quired modules and integrates the data received by the modules and libGaze. The “eyeheadtracker” ob-ject also allows the operator to call the functions needed for the calibration procedure described in 2.3.
2.5 System Evaluation
The system was designed to give real-time access to the current gaze of the observer for interactive applications. This requires high accuracy and low latency. We have performed several tests to measure the accuracy of the gaze estimate, and to test the latency of the system. The tracking systems we use are an SR-Research Eyelink 2 eye tracker (500Hz) and a ViconMx MoCap system (120-180Hz).
Latency: In gaze-contingent applications, latency
must be kept as short as possible, otherwise notice-able artifacts occur. Latency can be separated into a hardware-related component and a computational component, as depicted in Figure 5. The hardware latency is introduced by the delays involved in mea-suring, encoding and transmitting data from the two tracking systems. This can vary substantially be-tween different tracking systems. Because the two tracking systems run in parallel, the combined hard-ware latency is simply the larger latency of the two. The computational latency is the time needed by libGaze to combine the data from the trackers and calculate the current gaze data, which is typically much shorter than the hardware latency.
Figure 5: A box and arrow diagram indicating the main components of the system as well as associated latencies.
Accuracy: Accuracy is extremely important in
both HCI applications and psychophysical experi-ments, for which precise knowledge of the position of gaze is of interest. The overall accuracy of the system depends on the accuracy of the tracking de-vices and the algorithms used to map from the cam-era image to the eye viewing direction, and to esti-mate gaze in 3D.
To evaluate the accuracy of our system, 6 subjects were tested with the following procedure. First, they performed the calibration procedure, with their heads aligned to the screen. They were then asked to reorient their head to a range of different posi-tions. For each head position, a grid of fixation points was presented. Their task was to fixate each point while holding their head still. This procedures was repeated for half an hour. To calculate the ac-curacy and stability of the system, the calibration data from the beginning of the test was used to cal-culate the angular error between each fixation point and its calculated gaze-position on the screen. We found that the median error across subjects was 1.12 degrees.
2.6 Applications
The real-time capability of the system makes it useful other research areas, such as HCI and VR. One example of such an application is the proof-of-concept demo “GazePic” developed in collabora-tion with colleagues at Konstanz. It allows the users to use gaze to move images presented on the display wall (see Figure 6). The user selects an image by looking at it and pressing the buttons of a wireless mouse. With their gaze, they are then able to drag the image at high speed across the screen. This ap-plication is only feasible if the display is constantly updated with a latency of at most 20ms using an ac-curate calculation of the users current gaze position.
3
Human Behavior in the System
In this section, we report a behavioral study that was conducted with the use of our system. This study was designed to measure the contribution of head movements to gaze across three tasks that differed in complexity. The goal is twofold. First, it pro-vides an example of the system’s effectiveness in collecting gaze data that are comparable to previ-ous studies on natural gaze behavior. Second, the
Figure 6:GazePic demo. The user can move the images by using his/her gaze.
results suggest that it is important to permit (and measure) free head movements during normal in-teractions with large screens.
Studies on natural gaze behavior typically re-strict head-movements so that eye-movements can be treated as the equivalent of gaze. However, gaze often involves both eye- and head-movements in natural settings [8]. While the typical range of human eye-movement is about110◦[9], a mobile
head can greatly extend the effective oculomotor range to 260◦ laterally and 225◦ vertically [10].
Furthermore, the amount of head movement in gaze control varies across individuals [11]. Hence, artifi-cially restraining the head may lead to errors in ex-periments that compare between subjects. The cur-rent system provides an opportunity to study natural gaze behavior without these previous constraints.
3.1 Experimental method
Seven undergraduates (ages: 23-34yrs) were paid to take part in nine sessions, which were conducted over the course of three days. Each session con-sisted of eight blocks of trials, alternating between a gaze shift task and a natural image task (see Sec-tions 3.1.1 and 3.1.2).
Participants were seated 95cm from a large wall display that subtended a maximum of±46.5◦ to
the observer so that all regions of the display could be fixated without necessitating head-movements [9]. Nonetheless, the customary oculomotor range has been shown to be much narrower in head unre-strained situations and we investigated whether our participants move their heads to reduce eye-in-head eccentricity [12].
Some procedures were performed repeatedly across the test sessions. First, a head calibration was conducted at the beginning of each session, and the eyetracker was recalibrated before each block of tri-als. In addition, a full eye-tracking calibration was performed whenever the measured drift exceeded 2.0◦. Drift verifications were performed after
ev-ery nine trials.
At the beginning of each trial, participants were required to align their heads to one of three start positions (i.e.,0◦, ±15◦). The start position was
indicated by a blue circle (≈2.5◦radius), and a red
circle (≈ 1.25◦radius) was also displayed, which tracked their head orientation. Hence, participants moved their heads until the red circle was within the blue circle.
3.1.1 Gaze shift
In this task, two fixation crosses were presented in succession and the participant was instructed sim-ply to fixate the cross that was currently on dis-play. The purpose of this task was to obtain a base-line measure of eye-head coordination during gaze re-orientation, in the absence of cognitive task de-mands.
The first fixation cross (F1) was always pre-sented in one of three possible positions (0◦,±15◦).
The second fixation cross (F2) was presented after F1 had been fixated for a variable period of 600– 1500ms. F2 could be positioned at three possible horizontal eccentricities on either side of the first cross, in fixed steps of 15◦. Hence, there were six possible onscreen positions for F2 when F1 was presented at0◦and five possible F2 positions when F1 was presented at±15◦. An additional catch trial
was also included for each of the F1 positions, dur-ing which no F2 was presented. This resulted in a total of nineteen trials, which were presented in randomized order within each experimental block. Each trial ended after F2 had been fixated for 500ms or 6500ms after F2’s onset, whichever came first.
3.1.2 Natural image tasks
In these tasks, participants were requested to make judgements on images of natural scenes. These im-ages were from an image database depicting out-door scenes [13], and were presented in blocks of eighteen trials that alternated with the blocks of gaze saccade trials.
Participants were required to perform one of two possible tasks on a given block of such trials. They were either instructed to rate each image for their aesthestic appeal or to count the number of animals that each image contained. These two tasks were designed to respectively capture the different de-mands required by free viewing and visual search; behavior that has been extensively studied under head-restrained environments [14]. During presen-tation, each image subtended a region of approxi-mately93◦by62◦and were displayed for 4s. Par-ticipants responded using the three arrow keys on a keyboard, which were marked as ‘1’, ‘2’ and ‘3’. Responses were collected between the presentation onset of the image until 1s after its offset.
For the aesthestics rating task, the three response keys corresponded to a 3-point scale, in increasing order of perceived attractiveness. When required to
count animals, participants searched the image and
responded as soon as an animal(s) was detected. In this task, the same three keypresses corresponded to the detection of 1, 2 or 3 animals. Participants were allowed to respond repeatedly and were informed that their responses would be tallied at the end of the trial to indicate the total number of animals detected in the image.
3.2 Behavioral findings
For each trial, we obtain a time-series of the ob-server’s eye-, head- and combined (i.e. eye + head) gaze rotations. These data were smoothed to re-move impulse noise before analysis [7]. Saccade detection was performed on the gaze data, based on the following fixed thresholds. Saccades were defined as gaze movements that involved a deflec-tion of0.1◦, a minimum velocity of35◦/sand an acceleration of9500◦/s2. Finally, remaining
non-saccadic periods that were shorter than 50ms were also treated as saccades.
When F2 is presented and a gaze shift is executed towards it, an eye movement is produced first (me-dian latency = 241ms), followed by a slower head movement (median latency = 583ms) in the same direction. The extent to which the head contributes to the gaze movement varies across individuals, as can be seen in the example data in Figure 7. Here, participant CG generated a larger head movement than participant AS to achieve a gaze shift of simi-lar magnitude, on a given trial.
To assess the contribution of head movement to
4.5 5 5.5 6 F2=4 .17 se cs −5 5 15 25 35 −5 5 15 25 35 F2=4 .15 se cs Gaze= 28.70 Eye= 28.15 Head= 3.30 Head Gain= 0.02 E:H Latency =508ms Accuracy = 96% Participant AS Gaze= 28.18 Eye= 14.44 Head= 13.75 Head Gain= 0.49 E:H Latency =449ms Accuracy = 94% Participant CG Time (secs) An g ula r mo ve m en t (deg) Head Gaze Eye
Figure 7:Individual differences are apparent in how eye (green) and head (red) movements are coordinated to di-rect gaze (blue) from the center of the screen (0◦) to the right (30◦) in the gaze shift task
a gaze shift, head gain was computed using H~
||G~||·
~ G
||G~|| , whereH~ represented the vector of the head
movement between the onset of the gaze shift (G~) and 500ms before the end of the trial. The overall distribution of head gain across all the gaze shift tri-als is illustrated in the top panel of Figure 8. Clearly, the contribution of head movement to gaze shifts is significant even though a full re-orientation of the head to the final target position is rarely observed. This is true, even to targets that fall within the reach-able range of eye movements. Mean head gain dif-fered across individuals and ranged between 0.27– 0.54. In other words, the propensity of head move-ments varied across different observers. Nonethe-less, this variance in head gain did not affect the accuracy of gaze shifts. The same figure shows that the mean accuracy of fixating a presented target was 0.95, when calculated as a proportion of gaze mag-nitude to the distance between fixation targets. The bottom panel of Figure 8 also highlight an impor-tant difference between the eye and head compo-nents of gaze shifts. After a gaze shift has been ini-tiated towards a target of interest, the median peak head velocity is30.4◦/s) while the median peak eye
velocity is435.4◦/s). This supports the
character-istic pattern of eye-head coordination in gaze shifts wherein a fast eye saccade is made to a visual target before a slower head movement is made in the same direction (see Figure 7, bottom panel).
−0.2 0.0 0.2 0.4 0.6 0.8 1.0 1.2 1.4 0 0.02 0.04 0.06 0.08 0.10 0.12 0.14 Proportion of trials Head Gain Accuracy 0 0.05 0.10 0.15 0.20 0.25 Gain
Peak Velocity (deg/sec)
Head Eye
0 100 200 300 400 500 600 700
Figure 8:Histograms of head gain and accuracy on gaze
shift trials [top]. Histograms of the peak velocity of eye
and head movements towards F2 target [bottom].
In contrast to the gaze shift trials, participants made self-determined gaze movements on the nat-ural image trials. Figure 9 illustrates the gaze and head positions of a participant on a natural image task (i.e., count animals). From this, it can been seen that gaze (green crosses) consist of fast move-ments between clusters of fixation positions while head (red crosses) movement is smooth and contin-uous.
Figure 9:Example of an image presented on a count
an-imals trial and the projected gaze (green) and head (red)
positions, sampled at 250Hz.
A horizontal bias was found when we consid-ered all of the gaze and head positions held by the participants on the natural image tasks. This is il-lustrated by the polar histograms found in Figure 10 (see insets). This bias is more pronounced in the count animals than in the aesthetic ratings task.
In addition, participants moved their gaze to larger distances from the centre on the count animals tri-als, relative to the aesthetic ratings trials (see Figure 10). This was expected, as the count animals task required participants to search the entire image to locate animals while the aesthetic ratings task made no such demands. Most importantly, there is an accompanying increase in head movements on the
count animals trials compared to the aesthetic rat-ings trials. From this, it could be inferred that head
movements were employed to increase the range of gaze movements. 0 10 20 30 40 50 0 0.01 0.02 0.03 0.04 0.05 0.06 0.07 0.08 0.09 0.10 0 10 20 30 40 50 0 0.01 0.02 0.03 0.04 0.05 0.06 0.07 0.08 0.09 0.10 Prop ort ion of trials
Distance to center (deg)
Aesthetic Ratings Count Animals
30 210 240 60 90 270 120 300 150 330 180 0 30 210 240 60 90 270 120 300 150 330 180 0
Figure 10: Histograms of head (red) and gaze (blue) position to the center, across all the aesthetic rating and
count animals tasks. Inset polar plots illustrate the
fre-quency of angular position of head and gaze positions, rel-ative to the center.
In total, 30461 gaze shifts were produced on the aesthetic rating trials and 32130 gaze shifts on count animals trials. On average, fewer gaze shifts were produced on an aesthetic rating trial (mean=13.4; standard deviation=1.02) than on a
count animals trial (mean=14.2; standard
devia-tion = 1.02). A paired samples t-test showed this difference to be statistically significant (t(6)=3.48, p<0.05). Finally, the number of saccades pro-duced by each participant significantly correlated across both natural image tasks (Pearson’s R=0.84, p<0.01). In other words, participants were consis-tent in their propensity for producing gaze shifts.
Altogether, these behavioral findings show that head movements play a significant role across dif-ferent visual tasks. In consideration of this, behav-ioral studies in visual cognition and usability issues should be conducted in a head-unrestrained envi-ronment. The eyetracking system presented here is a solution that can be easily implemented, that al-lows for accurate eye and head tracking.
4
Conclusions
We have presented a novel system for real-time gaze tracking for a moving observer, and a psychophysi-cal experiment in which we used the system to mea-sure the coordination of eye- and head-movements in three tasks. The primary contribution is a flexi-ble system that can be easily adopted by other re-searchers. libGaze is publicly available, and is al-ready in use by other research groups in Germany. There are two main shortcomings of the current im-plementation. First, the origin of the ECS is ap-proximated by the bridge of the nose, instead of the true location of the eye, leading to small but sys-tematic errors in the gaze ray estimate. This can be corrected by estimating the true position of the eye center. Second, the calibration procedure could be improved by measuring and compensating for the small head movements made by the observer to en-sure that the maximum possible area is calibrated. In future work, we intend to use the system in a range of psychophysical tasks aimed at developing a predictive model of gaze movements. We also intend to deploy the system in the gaze-contingent display of high data-rate video streams and interac-tive systems with high resolution and high dynamic range. Finally, we are also currently exploring the use of gaze data in HCI.
References
[1] M. F. Deering. The Limits of Human Vi-sion. In 2nd International Immersive
Projec-tion Technology Workshop,, 1998.
[2] W. S. Geisler and J. S. Perry. Variable-Resolution Displays for Visual Communica-tion and SimulaCommunica-tion. Society for InformaCommunica-tion
Display, 30:420–423, 1999.
[3] A. T. Duchowski, N. Cournia and H. Murphy. Gaze-Contingent Displays: A Review. In
Cy-berPsychology and Behavior, 7(6), 621–634,
2004.
[4] E. Barth, M. Dorr, M. B¨ohme, K. Gegenfurt-ner and T. Martinetz. Guiding the mind’s eye: improving communication and vision by ex-ternal control of the scanpath. In Bernice E Rogowitz, Thrasyvoulos N Pappas, and Scott J Daly, (Ed.), Human Vision and Electronic
Imaging, 6057, 116-123, 2006.
[5] R. Ronsse, O. White and P. Lef`evre. Compu-tation of gaze orienCompu-tation under unrestrained head movements. Journal of Neuroscience
Methods, 159, 158–169, 2007.
[6] J. S. Johnson, L. Liu, G. Thomas and J. P. Spencer. Calibration algorithm for eyetrack-ing with unrestriced head movement.
Behav-ior Research Methods,Instruments & Comput-ers, 39, 123–32, 2007.
[7] D. M. Stampe. Heuristic filtering and reliable calibration methods for video-based pupil-tracking systems. Behavior Research
Meth-ods,Instruments & Computers, 25, 137–142,
1993.
[8] M. F. Land. Eye movements and the control of actions in everyday life. Progress in Retinal
and Eye Research, 25, 296–324, 2006.
[9] D. Guitton and M. Volle. Gaze control in hu-mans: eye-head coordination during orienting movements to targets within and beyond the oculomotor range. Journal of
Neurophysiol-ogy, 58, 427–459, 1987.
[10] J. Chen, A.B. Solinger, J.F. Poncet and C.A. Lantz. Meta-analysis of normative cervical motion. Spine, 24, 1571–1578, 1999. [11] J. H. Fuller. Head movement propensity.
Ex-perimental Brain Research, 92, 152–164,
1993.
[12] J. S. Stahl . Amplitude of human head move-ments associated with horizontal saccades.
Experimental Brain Research, 126, 41–54,
1999.
[13] Labelled and calibrated natural image database, Max-Planck Institute for Biological Cybernetics, Tuebingen, Germany. URL: http://images.kyb.tuebingen.mpg.de/
[14] B. W. Tatler, R. J. Baddeley and B. T. Vincent. The long and the short of it: Spatial statistics at fixation vary with saccade amplitude and task. Vision Research, 46, 1857–1862, 2006.