This is a repository copy of
Walking Activity Recognition with sEMG Sensor Array on Thigh
Circumference using Convolutional Neural Network
.
White Rose Research Online URL for this paper:
http://eprints.whiterose.ac.uk/128463/
Version: Accepted Version
Proceedings Paper:
Md Alias, MF, Needham, A, Dehghani-Sanij, AA et al. (3 more authors) (Accepted: 2018)
Walking Activity Recognition with sEMG Sensor Array on Thigh Circumference using
Convolutional Neural Network. In: 2018 International Conference on Intelligent Systems
Engineering (ICISE). 2nd International Conference on Intelligent Systems Engineering,
20-21 Mar 2018, Kuala Lumpur, Malaysia. IEEE . ISBN 978-1-5386-2597-2 (In Press)
© 2018 IEEE. This is an author produced version of a paper accepted for publication in
2018 International Conference on Intelligent Systems Engineering (ICISE). Personal use
of this material is permitted. Permission from IEEE must be obtained for all other uses, in
any current or future media, including reprinting/republishing this material for advertising or
promotional purposes, creating new collective works, for resale or redistribution to servers
or lists, or reuse of any copyrighted component of this work in other works. Uploaded in
accordance with the publisher's self-archiving policy.
[email protected] https://eprints.whiterose.ac.uk/
Reuse
Unless indicated otherwise, fulltext items are protected by copyright with all rights reserved. The copyright exception in section 29 of the Copyright, Designs and Patents Act 1988 allows the making of a single copy solely for the purpose of non-commercial research or private study within the limits of fair dealing. The publisher or other rights-holder may allow further reproduction and re-use of this version - refer to the White Rose Research Online record for this item. Where records identify the publisher as the copyright holder, users can verify any specific terms of use on the publisher’s website.
Takedown
If you consider content in White Rose Research Online to be in breach of UK law, please notify us by
Walking Activity Recognition with sEMG Sensor
Array on Thigh Circumference using Convolutional
Neural Network
Mohd Farid Md Alias
∗, Ashwin Needham
†, Abbas A. Dehghani-Sanij
∗,
Ravi Vaidyanathan
†, Uriel Martinez-Hernandez
∗, Charles Weston
∗∗Institute of Design, Robotics and Optimisation, University of Leeds, UK
{mnmfma, a.a.dehghani-sanij, u.martinez, mn14cw}@leeds.ac.uk
†Biomechatronics Laboratory, Imperial College London, UK
{a.needham15, r.vaidyanathan}@imperial.ac.uk
Abstract—In recognition of walking gait modes using surface electromyography (sEMG), the use of sEMG sensor array can provide sensor redundancy and less rigorous identification of sEMG electrode placements as compared to the conventional sEMG electrode placements right in the middle of muscle bellies. However, the potentially lesser discriminative and noisier sEMG signals from the sEMG sensor array pose the challenge in developing accurate and robust machine learning classifier for walking activity recognition. In this paper, we explore the use of convolution neural network (CNN) classifier with frequency gradient feature derived from EMG signal spectrogram for detecting different walking activities using an sEMG sensor array on thigh circumference. EMG dataset from five healthy subjects and an amputee for five walking activities namely walking at slow, normal and fast speed, ramp ascending and ramp descending are used to train and test the CNN-based classifier. Our preliminary findings suggest that frequency gradient feature can improve the CNN-based classifier performance for walking activity recogni-tion using EMG sensor array on thigh circumference.
Index Terms—electromyography, sensor array, walking gait intent recognition, convolutional neural networks, frequency gradient feature
I. INTRODUCTION
Myoelectric control is a control approach which utilises electromyography (EMG) signals as its control input to recog-nise muscle activities and subsequently derive the actuator output commands. Myoelectric control has been widely ap-plied in many assistive robotics devices such as exoskeletons [1] and prosthesis [2]. Surface electromyography (sEMG) is a commonly preferred way of acquiring the EMG signals due to its non-invasive nature and ease of use [3]. The sEMG electrodes are typically attached onto the skin areas of the middle of the subject muscle bellies where highest motor unit activations can be detected. However, such approach requires proper palpation procedure to locate the exact locations of those muscles [4]. This can be time consuming and at some point impractical for everyday wearing of any lower-limb as-sistive robotic devices. To alleviate this problem, alternatively the EMG sensors can be arranged in the form of a sensor array and then be worn based on certain body parts made
as landmarks. For example, an array of EMG sensor can be placed along the circumference of a subject’s thigh at a certain distance from the patella. This setting however would need to cope with the crosstalks between muscles and even potentially very low signals due to electrodes being placed on the skin areas of illotibial tracts or tendons. Hence, pattern recognition strategies used to recognise human activities associated with the EMG signals from these skin areas would need to be robust to such challenge.
An interesting popular artificial neural network architectures for pattern recognition problem is the convolutional neural network (CNN) [5]. This type of artificial neural network has been successfully applied in the field of image recognition [6], [7]. In such application, the red-green-blue (RGB) image data have been typically used as the inputs to the network models. To extend the use of CNN for sequential data such as the EMG signals, the CNN needs to be able to detect the temporal patterns within its input data structure.
To fit the spatio-temporal information of the EMG signals analogous to the standard CNN image input representation, the EMG spectrogram can be used as the image input to the CNN in which the time lapse and frequency axes of the graph represent the horizontal and vertical axes of the image input respectively. With such setting, the convolution filters would be able to scan for any temporal patterns as they stride along the horizontal axes of the input matrices.
Here we suggest that the temporal information has the po-tential to be augmented by the use of frequency gradient along the frequency axis of the EMG spectrogram. We hypothesise that the frequency gradient can have more discriminative and consistent characteristics over time compared to frequency amplitude. Hence the use of frequency gradient can potentially improve a CNN-based classifier to become more robust toward EMG noise and produce more consistent output over time. In this paper, we propose the use of a classifier based on a CNN with frequency gradient feature from the EMG spectrogram to recognise human walking activities based on sEMG measured along the thigh circumference using a sEMG sensor array.
Two contributions are presented in this paper. First, we introduce the procedure of applying an array of sEMG sensors along the subject’s thigh circumference to acquire sEMG signals from the thigh for activity recognition and potentially to control assistive robotic devices. This procedure involves the identification of electrode locations based on patella as the landmark, which can alleviate the need of rigorous muscle palpation procedure and help to establish more consistent electrode locations for repeated wearings of EMG sensors. The second contribution is on the development of a CNN-based classifier which utilises the frequency gradient feature derived from the EMG spectrograms as the image inputs to the CNN. We compare its performance to another CNN-based classifier which uses EMG spectrogram only as the image inputs and a standard support vector machines-based (SVM-based) classifier as the baseline.
This paper is divided into six sections. Section II briefly explains related works. Section III explains about our EMG data acquisition and feature extraction procedures. Section IV describes our classification approach. Section V presents our results and discussions. Finally Section VI provides the conclusions of this paper.
II. RELATEDWORKS
Biosignal-based sensor arrays have been widely applied in the recognition of human upper limb movements. In [8], three sets of 128-channel EMG sensor arrays placed on the triceps, biceps and forearm areas were used to obtain high density EMG signals for forearm movement recognition. [9] used MMG sensor array on the wrist for identification of finger movements. A hybrid EMG-MMG sensor array was utilised to characterise hand muscle activities during object manipulation tasks in [10]. The introduction of Myo Armband in 2014, a commercial EMG sensor array by Thalmic Inc. [11], has sparked numerous research efforts on EMG-based hand movement recognition [12], [13], [17].
Applications of sensor array for human activity recognition based on lower-limb movements has been less explored as compared to upper-limb movements. In [14], input signals from an array of eight mechanomyography (MMG) sensors and two inertial measurement units (IMUs) were used as classifier inputs to identify three different walking activities namely level ground walking, stair ascending and stair de-scending. Whereas [15] used a neoprene cuff consisting of four piezoresistive force sensors and silicone balloon actuators as a haptic feedback system based on the ground reaction forces. CNN has been used for classification of hand movements using EMG as input signals based on standard muscle lo-cations [16] and sensor array [17]. The latter utilised EMG spectrogram as the input feature to their CNN-based classi-fier. Meanwhile in [18], spectrograms of EMG signals from standard thigh muscle locations were used to classify three walking modes namely level ground walking, stair ascending and their transition based on matching scores and majority voting schemes. To the best of our knowledge, our work is the first to use the frequency gradient feature derived from
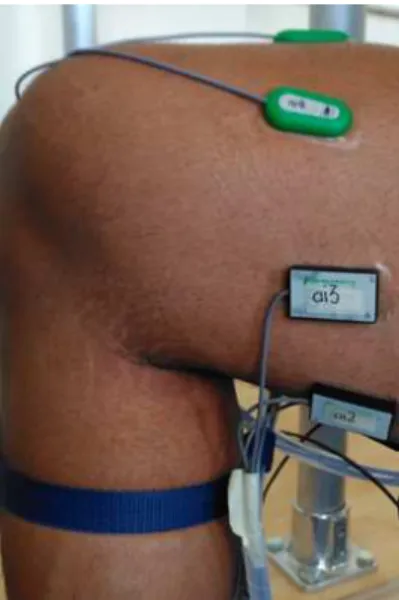
Fig. 1. Electrode placements along the thigh circumference.
the EMG spectrograms as the inputs to the CNN classifier for walking activity recognition using EMG sensor array.
III. EMG DATACOLLECTION
A. Experiment Setup
To evaluate the feasibility of EMG sensor array for walking gait recognition based on thigh muscle activities, we conducted EMG data collection sessions for five different walking activ-ities namely level ground walking at slow, normal and fast speeds, ramp ascending and ramp descending. The data were obtained from six male subjects of which five were healthy individuals and one was a transfemoral amputee. The subjects’ ages ranged between 19 and 77 years old with average heights of 177.5±7.3 cm and average weights of 74.8±10.6 kg. This study was approved by the University of Leeds Research Ethics Committee and all the subjects had signed their written informed consents before participating in this experiment.
For our EMG sensor array, we used eight Biometrics SCX-1000 EMG sensors. Each sensor can be attached to the skin area with a transparent medical grade tape. It also has a built-in gabuilt-in of 1000 with bi-polar electrode distance of 15 cm. The EMG sensors were connected to the National Instruments NI-USB 6212 data acquisition (DAQ) device which was con-nected to a Windows 10 laptop with a 5 m USB cable. The EMG data stream was recorded using a LabVIEW program in the laptop with a sampling frequency of 1 kHz per channel. Two mechanical switches were also connected to the DAQ hardware to be used by the experiment investigator. One was a latching used to remote control the start and stop of each data logging session and another was a non-latching one to indicate the start and stop of each trial or set.
During each data collection session with a subject, we first identified the thigh circumference location to place the EMG sensor array which was 10 cm from the farthest surface of the subject’s patella during sitting position. We then shaved and cleaned skin area along the thigh circumference to improve the
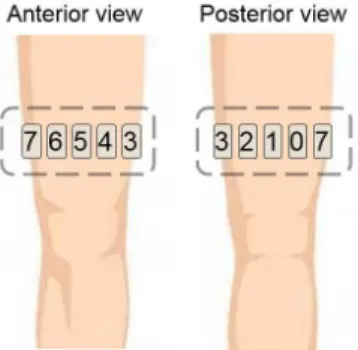
Fig. 2. Electrode IDs on single thigh.
EMG signal detection. After that eight Biometrics SCX-1000 EMG sensors were attached along the thigh circumference using medical grade tape at 45° from each other with respect to the centre of the thigh circumference cross-section as shown in Figure 1. The EMG sensors were assigned identification labels from 0 to 7 as in Figure 2. Sensor 0 basically represented biceps femoris, sensor 1 (semitendinosus), 2 (semimembra-nosus), 3 (gracilis), 4 (vastus medialis), 5 (rectus femoris), 6 (vastus lateralis) and 7 (illotibial tract).
Another main equipment in this experiment was a 5-meter long ramp with 5° inclination from the ground. The ramp was installed with aluminium parallel bars as a safety feature for subjects to hold onto during ramp usage. The walking distances were set at 2.5 meters and 3 meters for ramp and level ground walking activities respectively. Both distances would allow the subjects to walk for at least two full strides based on men’s average stride length of 88.5 cm [19].
B. Experiment Protocol
Each subject was first instructed to perform two preliminary activities to obtain his maximum voluntary contraction (MVC) values. The first activity was the isometric knee extension in seating position by having the subject’s ankle tied to the chair leg with a strap. In the second activity, the subject tried to perform knee flexion in standing position while his ankle was tied to a stationery vertical rod in front of him. The subject would perform each activity in three sets with two minutes of rest between sets. For each set, the subject would first relax at the starting position for ten seconds to reduce baseline offset followed by performing the movements for six repetitions with ten seconds of rest between each repetition.
The subject then performed six trials of slow level ground walking activity by walking to the other end of the walking distance and back to the starting position for three times. This procedure was repeated for another two speeds namely normal and fast speeds. Two and five minutes of rest were allowed between each trial and activity respectively. Finally the subject was instructed to walk up and down the ramp for six trials with two minutes of rest between the activities.
C. Data Preprocessing
We first filtered our raw EMG signals using high pass filter at 20 Hz to eliminate motion artifacts, bandpass filtered
Fig. 3. Sample of EMG signals from the sensor array for two consecutive level ground walking trials at slow speed.
them with a fourth order Butterworth filter with the cut-off frequencies of 20 and 450 Hz to obtain EMG frequency band with high energy density and then applied notch filter between 59 to 61 Hz to minimise power line interference. A sample set of EMG envelopes from the eight EMG electrodes of a subject for two consecutive walking trials are as shown in Figure 3.
D. Feature Extraction
For the CNN-based classifier, we used EMG spectrogram feature and frequency gradient feature derived from the same EMG spectrogram to design two separate CNN-based classi-fiers. While such feature selection seems to be very minimal as compared to other EMG-related works [2], it was intended to train our classifier with minimal computational load for future real-time control of assistive robotics devices. We chose 50 ms and 200 ms respectively as our time window overlap size and main time window size for the frequency gradient and spectrogram features based on earlier works [17], [20], [21].
The EMG spectrogram of each sensor for a single time step was obtained using short-time Fourier transform (STFT) based on Matlab implementation. With 20 samples in each time segment and 10 samples of segment overlap, each time window was divided into 19 time bins. Using 128 discrete Fourier transform (DFT) points, 128 frequency bins were obtained to produce an EMG spectrogram of the size128×19 for each EMG input signal.
To derive the frequency gradient feature from the EMG spectrogram, only the real part of the spectrogram was in-volved for the computation to minimise computation complex-ity. Four gradient computation methods have been considered, namely Sobel operator, Prewitt operator, central difference and intermediate difference methods. For our main classifier training of each subject, we have selected Sobel operator based on [22] due to its edge enhancement effects which may enhance the discriminative characteristic of frequency gradient image. Other gradient operators have also been applied on
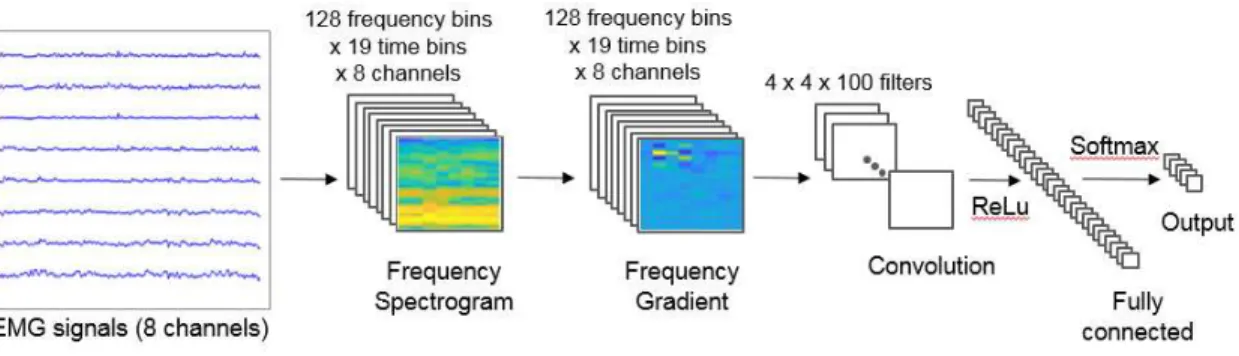
Fig. 4. CNN-based classification approach for walking gait recognition.
a single subject’s data to compare their computation times. Similar data were used to measure the computation time for STFT and continuous wavelet transform (CWT) to obtain the EMG spectrogram.
Sobel gradient operator along the vertical direction,TS y is defined as follows [22]: TS y= −1 −2 −1 0 0 0 +1 +2 +1 (1)
The vertical gradient Gy can be computed from an image inputI with Sobel operator using the following formula:
Gy=TS y∗I (2)
where * refers to convolution operation.
Figure 5 illustrates transformation effect from EMG spec-trogram to frequency gradient using Sobel operator along the frequency band axis. Through visual observation, the transformation seems to uncover latent temporal pattern of the EMG spectrogram. The EMG spectrogram image displays more noticeable colour gradient along the frequency band but colour changes along the time axis would be more useful for feature separability.
IV. CLASSIFICATIONAPPROACH
A. Convolution Neural Network Architecture
Figure 4 shows our classification approach using a simple CNN architecture. The CNN consists of an eight-dimensional input layer for the eight EMG inputs, a convolutional layer, a rectified linear unit (ReLU) activation layer, a fully-connected layer, a softmax activation layer and the output layer. Each input dimension corresponds to a 128×19 matrix of EMG spectrogram or frequency input. The kernel size and the stride size of the convolution filter are4×4 and4×1 respectively. The CNN hyperparameters are set as follows; batch size as 20, number of epoch at 100 and learning rate at 0.005.
B. Classifier Evaluation
The data analysis was conducted in Matlab R2017a on a 64-bit Windows PC with Intel Xeon 3.2 GHz processor and 8 GB RAM. To evaluate our classifier performance, we stratified our
(a) EMG spectrogram (b) Frequency gradient
Fig. 5. Feature transformation from (a) EMG spectrogram to (b) frequency gradient.
data into three sets, namely training set (80%), validation set (5%) and test set (15%). We then reran the classifier training for each subject to obtain the subject-specific classification accuracy. Finally we calculated the average classification ac-curacy by adding the classification accuracies for all subjects and divide the sum with the number of subjects.
V. RESULTS ANDDISCUSSIONS
A. Classification Accuracy
Table I shows the classification results between different classifiers namely CNN-based with frequency gradient fea-tures, CNN with spectrogram feature and SVM-based classifier at 200 ms time window. CNN-based classifier with feature gradient performed better than CNN-based classifier with spectrogram feature and SVM-based classifier. The use of frequency gradient as the classifier feature helps to increase the classification accuracy by about 5.32% from spectro-gram feature. These findings support our assumption that the temporal information in EMG frequency gradient feature can be more discriminative and consistent as compared to EMG spectrogram feature. However, with bigger time window size of the input frame, the frequency gradient advantage gradually diminishes as the CNN-based classifier achieved better classification accuracies as in Figure 6. This probably
TABLE I
CLASSIFIERCLASSIFICATIONACCURACIES AT200MSTIMEWINDOW Classifier Accuracy
CNN with frequency gradient feature 77.95% CNN with spectrogram feature 72.63% Support Vector Machines (SVM) 67.8%
can be explained by higher abundance of temporal information in bigger time windows in either features which can be used to derive more feature maps by the convolution filter. Yet smaller time window size is more attractive for myoelectric control application to produce faster responses. For the purpose of offline training, the use of longer time windows is useful for better classification performance since more temporal patterns can be detected by the classifier. But question remains as whether the longer time windows can be practical for real-time myoelectric control of assistive robotic devices and further investigation is needed on this issue.
The high classification accuracy results at 400 ms time window and above are comparable to other previously reported accuracies on EMG-based human activity recognition with numerous machine learning techniques [23] including SVM [24] and Bayesian network [25]. However, with time windows below 400 ms, our classification accuracies degrade at higher rates as compared to those reported results. [24] achieved more than 90% accuracies with 150 ms time window and four EMG time-domain features, whereas [25] reported transitional and steady-state error ranges of 12 to 32% and 1 to 12% respectively by varying the EMG time windows from 450 ms to 50 ms and utilising six time-domain features.
On the other hand, our 78% classification accuracy at 200 ms time window for CNN-based classifier with frequency gra-dient feature closely trails 81% average classification accuracy without prior knowledge in Joshi’s work [18] which applied standard EMG electrode placements, used EMG spectrogram as the feature input and assigned 265 ms time window. Such marginal difference indicates that our result can be considered as acceptable in the context of single feature usage.
B. Factors Affecting Classification Accuracy
We attribute our relatively lower classification results to two factors namely number of features used and hardware limitation. We used a single feature only namely EMG spectro-gram or frequency gradient to feed our CNN-based classifier in contrast to most of existing works which utilised more than one feature. Hence their approaches would benefit from combined discriminative effects of different features to achieve better classification performances. However the use of more features may subsequently require more computational power and memory allocation from the processing units.
Secondly, the EMG electrode tapes that we tested could not continuously attach the EMG electrodes firmly to some subjects’ skin areas due to changes in the shapes of the lower third of their thighs during walking movements. Furthermore,
Fig. 6. Effect of time window size toward classification accuracy.
the thigh volume changes have also caused some skin ten-sions on the electrodes and hence movement artifacts to the EMG signals. Better EMG measurements could potentially be achieved with firmer attachments of the EMG sensor array at different saggital heights along the thigh.
By measuring the EMG signals on implicit muscle locations as we performed, the acquired EMG signals might also be more prone to crosstalks between muscles. However, even with the existing noisy measurements, the results suggest that the inputs from EMG sensor array could help the classifier to leverage those effects to a certain extent rather than behaving as a random classifier. In addition, with more data samples, the CNN-based classifier can be further trained and tested for improved classification accuracy.
C. Computational Costs
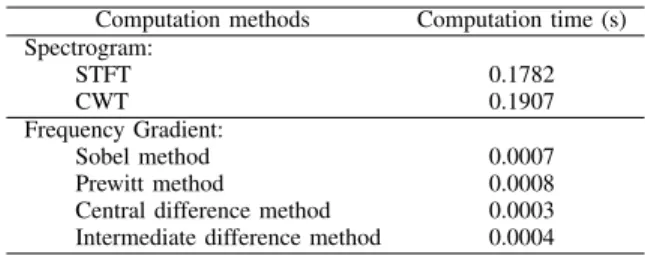
Table II shows the computational times of different image gradient methods, spectrogram and CWT for single input sam-ple with Matlab imsam-plementation. Spectrogram computation using either STFT or CWT was found to be substantially longer than the subsequent frequency gradient computation.
Computation time for the Sobel method is comparable to the Prewitt method but both are slightly longer than central and intermediate difference methods. The differences can be considered trivial in offline training. However, if computational efficiency remains crucial, then the latter two methods can be considered for gradient computation.
Spectrogram computation times depend on computational implementation, processor speed and memory size. Joshi et al. [18] reported 53.5 ms as its spectrogram computation time on a PC with Intel Core i7 3.40 Ghz processor and 8 GB RAM, which was less than a third of our STFT spectrogram computation time obtained from a PC with a slower processor namely Intel Xeon 3.2 GHz.
D. Limitations and Future Works
Our current CNN-based classifier development here is mainly intended as a proof of concept particularly with regards to the use of sEMG sensor array on thigh and frequency gradient feature. Hence the classifier only consists of a vanilla
TABLE II
AVERAGECOMPUTATIONTIMES OFFREQUENCYGRADIENT AND SPECTROGRAMFEATURES FOR ASINGLEONE-DIMENSIONALINPUT
SAMPLE.
Computation methods Computation time (s) Spectrogram: STFT 0.1782 CWT 0.1907 Frequency Gradient: Sobel method 0.0007 Prewitt method 0.0008
Central difference method 0.0003 Intermediate difference method 0.0004
CNN architecture without additional optimisation steps such as dropout, batch normalisation or momentum. More complex CNN architecture may be developed in the future.
The final goal of this research is to develop a novel ANN-based myoelectric control scheme of an assistive robotic device. The developed classifier will be used as part of the high-level control scheme that can be connected to the middle and low-level controllers. Our future works will also include improvement of the classifier for subject-independent setting and experimentation with different EMG sensor array locations namely the higher parts of the thigh. Higher number of subjects and evaluation of classifier performance over time will also be considered in future experiments.
VI. CONCLUSIONS
As the conclusion, sEMG sensor array application on thigh circumference can potentially be used as an alternative approach to standard EMG electrode placement procedure. However, the inherent crosstalks and weaker signals on certain locations need to be addressed with the use of more robust classifier and discriminative features. Frequency gradient of EMG spectrogram is one promising feature to serve as the image input to a CNN-based classifier for activity recognition.
ACKNOWLEDGEMENT
The first author would like to thank International Islamic University Malaysia (IIUM) for sponsoring his PhD fellowship for this research. The team also wish to thank Affective Engineering Lab of the University of Leeds as our experiment venue and Biomechatronics Lab of Imperial College London for the collaboration work.
REFERENCES
[1] H. Kawamoto, S. Lee, S. Kanbe, and Y. Sankai, “Power assist method for HAL-3 using EMG-based feedback controller,” inSyst., Man Cybern., 2003 IEEE Int. Conf., vol. 2. IEEE, 2003, pp. 1648–1653.
[2] M. A. Oskoei and H. Hu, “Myoelectric control systems – A survey,” Biomed. Signal Proc. Control, vol. 2, no. 4, pp. 275–294, 2007. [3] P. Konrad, “The ABC of EMG,”Practical Intro. Kinesiol.
Electromyo-graphy, vol. 1, pp. 30–35, 2005.
[4] H. J. Hermens, B. Freriks, R. Merletti, D. Stegeman, J. Blok, G. Rau, C. Disselhorst-Klug, and G. H¨agg, “European recommendations for surface electromyography,”Roessingh Res. Develop., vol. 8, no. 2, pp. 13–54, 1999.
[5] A. Krizhevsky, I. Sutskever, and G. E. Hinton, “ImageNet classification with deep convolutional neural networks,” inAdv. Neural Inf. Process. Syst., 2012, pp. 1097–1105.
[6] K. Simonyan and A. Zisserman, “Very deep convolutional networks for large-scale image recognition,” Comput. Res. Repo. (CoRR), vol. abs/1409.1556, 2014.
[7] K. He, X. Zhang, S. Ren, and J. Sun, “Deep residual learning for image recognition,”Comput. Res. Repo. (CoRR), vol. abs/1512.03385, 2015. [Online]. Available: http://arxiv.org/abs/1512.03385
[8] M. Jordanic, M. Rojas-Martinez, M. A. Mananas, J. F. Alonso, and H. R. Marateb, “A novel spatial feature for the identification of motor tasks using high-density electromyography,”Sensors, vol. 17, no. 7, p. 1597, 2017.
[9] R. Booth and P. Goldsmith, “Validation of a piezoelectric sensor array for a wrist-worn muscle-computer interface,”Canadian Med. Biol. Eng. Soc. (CMBES) Proc., vol. 39, no. 1, 2016.
[10] M. Kurzynski, M. Krysmann, P. Trajdos, and A. Wolczowski, “Multi-classifier system with hybrid learning applied to the control of biopros-thetic hand,”Comp. Biol. Med., vol. 69, pp. 286–297, 2016.
[11] Thalmic Labs Inc. (2016) Myo Gesture Control Armband – Wearable Technology by Thalmic Labs. [Online]. Available: https: //www.myo.com. [Accessed: 31-Jan- 2018]. [Online]. Available: https://www.myo.com/
[12] M. Montoya, O. Henao, and J. Mu˜noz, “Muscle fatigue detection through wearable sensors: a comparative study using the Myo Armband,” inProc. 18th Int. Conf. Human Comp. Interact. ACM, 2017, p. 30. [13] M. Tavakoli, C. Benussi, and J. L. Lourenco, “Single channel surface
EMG control of advanced prosthetic hands: A simple, low cost and efficient approach,”Expert Syst. Appl., vol. 79, pp. 322–332, 2017. [14] A. Needham and R. Vaidyanathan, “Classifying the gait intent of a user
using mechanomygraphic muscle activation sensors,” 2017, unpublished. [15] R. E. Fan, M. O. Culjat, C. H. King, M. L. Franco, R. Boryk, J. W. Bisley, E. Dutson, and W. S. Grundfest, “A haptic feedback system for lower-limb prostheses,”IEEE Trans. Neural Syst. Rehabil. Eng., vol. 16, no. 3, pp. 270–277, June 2008.
[16] M. Atzori, M. Cognolato, and H. M¨uller, “Deep learning with convo-lutional neural networks applied to electromyography data: a resource for the classification of movements for prosthetic hands,” Frontiers Neurorobotics, vol. 10, p. 9, 2016.
[17] U. Cˆot´e-Allard, C. L. Fall, A. Campeau-Lecours, C. Gosselin, F. Lavi-olette, and B. Gosselin, “Transfer learning for semg hand gestures recognition using convolutional neural networks,” inSyst., Man Cybern. (SMC), 2017 IEEE Int. Conf. IEEE, 2017, pp. 1663–1668.
[18] D. Joshi, B. H. Nakamura, and M. E. Hahn, “High energy spectrogram with integrated prior knowledge for EMG-based locomotion classifica-tion,”Med. Eng. Phys., vol. 37, no. 5, pp. 518 – 524, 2015.
[19] P. E. Martin and R. C. Nelson, “The effect of carried loads on the walking patterns of men and women,”Ergonomics, vol. 29, no. 10, pp. 1191–1202, 1986.
[20] M. Zardoshti-Kermani, B. C. Wheeler, K. Badie, and R. M. Hashemi, “EMG feature evaluation for movement control of upper extremity prostheses,”IEEE Trans. Rehabil. Eng., vol. 3, no. 4, pp. 324–333, 1995. [21] L. H. Smith, L. J. Hargrove, B. A. Lock, and T. A. Kuiken, “Determining the optimal window length for pattern recognition-based myoelectric control: balancing the competing effects of classification error and controller delay,”IEEE Trans. Neural Syst. Rehabil. Eng., vol. 19, no. 2, pp. 186–192, 2011.
[22] W. Gao, X. Zhang, L. Yang, and H. Liu, “An improved sobel edge detection,” in Comp. Sc. Inf. Technol. (ICCSIT), 2010 3rd IEEE Int. Conf., vol. 5. IEEE, 2010, pp. 67–71.
[23] J. Yousefi and A. Hamilton-Wright, “Characterizing EMG data using machine-learning tools,”Comp. Biol. Med., vol. 51, pp. 1–13, 2014. [24] H. Huang, F. Zhang, L. J. Hargrove, Z. Dou, D. R. Rogers, and K. B.
Englehart, “Continuous locomotion-mode identification for prosthetic legs based on neuromuscular-mechanical fusion,”IEEE Trans. Biomed. Eng., vol. 58, no. 10, pp. 2867–2875, Oct 2011.
[25] A. Young, T. Kuiken, and L. Hargrove, “Analysis of using EMG and mechanical sensors to enhance intent recognition in powered lower limb prostheses,”J. Neural Eng., vol. 11, no. 5, p. 056021, 2014.