Loyola University Chicago Loyola University Chicago
Loyola eCommons
Loyola eCommons
Master's Theses Theses and Dissertations
2018
Toddler Activity Recognition Using Machine Learning
Toddler Activity Recognition Using Machine Learning
Pinky Sindhu
Loyola University Chicago
Follow this and additional works at: https://ecommons.luc.edu/luc_theses
Part of the Computer Sciences Commons Recommended Citation
Recommended Citation
Sindhu, Pinky, "Toddler Activity Recognition Using Machine Learning" (2018). Master's Theses. 3755.
https://ecommons.luc.edu/luc_theses/3755
This Thesis is brought to you for free and open access by the Theses and Dissertations at Loyola eCommons. It has been accepted for inclusion in Master's Theses by an authorized administrator of Loyola eCommons. For more information, please contact [email protected].
This work is licensed under a Creative Commons Attribution-Noncommercial-No Derivative Works 3.0 License. Copyright © 2018 Pinky Sindhu
LOYOLA UNIVERSITY CHICAGO
TODDLER ACTIVITY RECOGNITION USING MACHINE LEARNING
A THESIS SUBMITTED TO
THE FACULTY OF THE GRADUATE SCHOOL IN CANDIDACY FOR THE DEGREE OF
MASTER OF SCIENCE
PROGRAM IN COMPUTER SCIENCE
BY
PINKY SINDHU CHICAGO, IL AUGUST 2018
Copyright by Pinky Sindhu, 2018 All rights reserved.
iii
ACKNOWLEDGEMENTS
I would like to begin this note by acknowledging my committee director and mentor Dr. Mark V. Albert for providing me an opportunity to pursue research on activity recognition using machine learning. The continuous encouragement and thoughtful technical advice of Dr. Albert positively motivated me to pursue and complete this research project. I sincerely appreciate all his effort and time spent in advising me through the course of this study.
I am grateful to Dr. Soyang Kwon, Dr. Dmitriy Dligach and Dr. Ting Xiao for agreeing to be my committee members and reviewing all my efforts and research
findings. I would like to thank Loyola University Chicago and the Ann & Robert H. Lurie Children's Hospital of Chicago for providing me with the resources and information required for my research.
I especially want to express my thanks to the research staff at Ann & Robert H. Lurie Children's Hospital of Chicago who work under the guidance of Dr. Kwon for their relentless effort in providing me with the research data. This project is a joint effort of several people and contribution from each person was equally important to the study. I extend my thanks to them through this acknowledgment note.
I cannot complete my salutation without mentioning how invaluable my family and friends are to me. They were an integral part of my journey and this
iv TABLE OF CONTENTS ACKNOWLEDGEMENTS iii LIST OF TABLES v LIST OF FIGURES vi ABSTRACT vii
CHAPTER I: INTRODUCTION TO WEARABLE BASED ACTIVITY RECOGNITION
USING MACHINE LEARNING 1
Introduction to Activity Recognition 1
Wearable Devices and Accelerometer 2
Machine Learning 3
Accelerometer based Activity Recognition 4
CHAPTER II: THE TODDLER ACTIVITY RECOGNITION EXPERIMENT 9
Background and Motivation 9
Data Preparation for the Pilot Study 10
Toddler Activities 11
Creation of Activity Recognition Model 13
Results 17
Discussion 18
CHAPTER III: ACTIVITY LEVEL CLASSIFICATION 23
3-level classification: sedentary, light, and moderate 23
2-level classification (inactive and active) 26
CHAPTER IV: DISCUSSION: LIMITATIONS AND FUTURE WORK 29
Limitations 29
Future Work 31
REFERENCE LIST 35
v
LIST OF TABLES
TABLE 1: The list of physical activities toddlers performed along with their numeric
annotation codes 12
TABLE 2: Time domain features extracted from the signal 14
TABLE 3: Frequency domain features extracted from the signal 15 TABLE 4: Hyperparameter grid searched values and (bold) values chosen for the final
model 16
TABLE 5: Overall accuracy of the activity recognition classification with 20 activities 17 TABLE 6: List of activities under each intensity category 23
TABLE 7: 3-level activity level classification accuracy 25
TABLE 8: 2-level classification and the activities under each level 26
vi
LIST OF FIGURES
FIGURE 1. ActiGraph GT3X accelerometer used in the study 5
FIGURE 2. Steps involved in generating an activity recognition model 8 FIGURE 3: Line graph showing the growth in obesity in young children and adults
over the years 9
FIGURE 4: Distribution of participants by race and sex 10
FIGURE 5: Activity annotation hierarchy 11
FIGURE 6: Annotation sheet for mapping the accelerometer signal data with the
activity 12
FIGURE 7: Confusion matrix generated from the random forest classifier for the
waist worn accelerometer 18
FIGURE 8: The distinct activities plotted against time 19
FIGURE 9: The distinct activities highlighting similar (2 purple and 7 gray)
2-second clips 20
FIGURE 10: Confusion matrix derived from random forest classifier highlighting
how "stand move" is misclassified 21
FIGURE 11: Hierarchical clustering dendrogram from the feature values (mean) of
the twenty activities 22
FIGURE 12: Activity level accelerometer signal examples for 3 levels – Sedentary,
LPA, and MVPA 24
FIGURE 13: Confusion matrix for the 3-level activity level classification 25 FIGURE 14: 3-level activity level examples highlighting similarity 26 FIGURE 15: 2-level activity level examples highlighting similarity 27 FIGURE 16: Confusion matrix for the 2-level activity level classification 28
vii
ABSTRACT
Wearable devices enable us to objectively measure the activities of people. However, wearables are commonly designed for adult subjects. Toddlers behave
differently than adults, to say the least. It is valuable to accurately measure the specific types and amount of physical activity (PA) in toddlers; such information can be analyzed to inform, predict, and affect future health prospects in relation to conditions like
obesity that are associated with differing amounts of activity.
In this study, we attached ActiGraph accelerometers to the wrist and waist of 24 toddlers and recorded PAs with minimal guidance. Freely behaving toddlers present unique challenges for activity recognition due to quick, spontaneous transitions between activities and a greater variety of movements. Toddlers were videotaped, and their movements were later annotated as 20 specific activities including "run", "walk",
"crawl", "stand", "sit", "lie", "carried", "climb up and down", "stand still", "stand move", and "transit to stand". These activities were further classified into a set of summary activity intensities including sedentary, light intensity PA (LPA), and moderate to vigorous intensity PA (MVPA).
Automated activity recognition proceeded through a series of standard machine learning signal processing stages. The video-based activity annotation log was synced to the wearable accelerometer values; two second clips of sensor data were extracted and associated with the annotated activities the toddlers were performing in that interval.
viii
To train the activity classifier 81 standard signal processing features were extracted for each clip. The following classifiers were trained: Random Forest (RF), Logistic
Regression, Support Vector Machine (SVM), Decision Tree, and K Nearest Neighbors. When training directly on these 20 activities, the overall accuracy was 63.8%. When the activities were grouped into 3 intensity levels, the highest accuracy was 73.6%, also using the RF classifier. Notably, the precision of the original annotations had a dramatic impact on accuracy; for example, by simply removing one mixed activity class (e.g. "stand-move") the accuracy jumps to 83.7%. Such data-driven observations have led to suggestions for further refinement of the activity annotation.
This work is done to improve activity recognition in order to provide better objective measures of toddler activity; this will help us to better understand the link between the lifestyle and behavior of toddlers and their future health outcomes.
1
CHAPTER I
INTRODUCTION TO WEARABLE BASED ACTIVITY RECOGNITION USING
MACHINE LEARNING
Introduction to Activity Recognition
A system capable of identifying the activities performed by human subjects is applicable to a wide variety of domains including individual healthcare, healthcare research, and personal consumer fitness. The information obtained from activity
recognition is valuable in the long-term assessments of physiological states like obesity, diabetes, or heart disease [1]. This has appealing value in healthcare especially in
eldercare for monitoring daily activities to assess current health and the impact of interventions [2]. Technology driven healthcare in assisting independent living is another area where activity recognition is heavily applied [3].
Activity recognition systems are built to detect the physical activities carried out by the person given collected sensor data. These sensor values are captured by wearable devices attached to the subject's body. The challenge of activity recognition is to
translate complex, continuous sensor signals into human interpretable activities that are useful for personal or clinical understanding. Additionally, accurate recognition of real time activities is further complicated by the unique ways in which people move and the ill-defined nature of what movements fall under an activity label.
2
Wearable Devices and Accelerometer
Wearable devices, such as pedometers and activity trackers, are comprised of electronic sensors which track motions of the body and additional elements for analytics and storage. Advances in microelectronics have shrunk sensors and computing elements and improved analytics in data science have dramatically improved the usability of wearable devices. Wearable devices are now an integral part of digital health monitoring systems. Long term health monitoring using wearable devices is an active area of
research [5].
Wearable devices rely on a variety of motion tracking sensors. Accelerometers, gyroscopes, magnetometers, and global positioning systems (GPS) are examples of motion tracking sensors. As these sensors can be made small and relatively cheaply, they are popular for tracking activities [6]. Additionally, low power requirements and wireless technology make these devices more widely used. Wearable sensors are available as dedicated devices but are also found in smartphones and mobile applications [7].
Accelerometers
Accelerometers are used to detect the linear acceleration – the change in velocity over time. They are electromechanical devices which measure these changes which occur during movement, vibration, or from forces due to gravity. Accelerometers
measure acceleration in meters per second squared (m/s2) or in G forces (g) where 1 g =
3
tracking altered motion, accelerometers also allow measuring the orientation of the device relative to gravity.
Accelerometers are commonly used in both research and consumer platforms. ActiGraph (ActiGraph Inc FL), Xsens (Xsens North America Inc CA), and Shimmer (Shimmer Research MA) are common research grade accelerometers used in activity recognition studies. Popular consumer grade accelerometers such as Fitbit are also used for physical activity measurements, but are limited in precision, battery, or memory. Accelerometers were originally used in smartphones to provide image orientation on screens but have found a use in everything from video games to fitness tracking on the phone itself.
Machine Learning
Machine learning is a branch in computer science where machines analyze data and make inferences without being explicitly programmed. These results can assist in decision making by a person, or sometimes can lead to decisions being made by the machine directly from the data. Machine learning has existed for quite some time but the ability to perform complex mathematical calculations with large amounts of data is a relatively recent development which has led to the rapid increase in the applications of machine learning in various fields. Data mining, predictive analytics, big data, artificial intelligence, and statistical analytics are all related and overlapping concepts to machine learning.
Supervised and Unsupervised Learning
Supervised and Unsupervised learning algorithms are the two common categorizations of problems in machine learning. In supervised learning a machine
4
learns by mapping an input (e.g. a picture) with its output (e.g. what is in the picture) based on example input-output pairs called training data. The machine learning model analyses the training data so that any given input in the right form can be mapped to a desired output. The model is further generalized so that output can be predicted from any input data. Often additional input data is provided to the model and the predicted output is compared with what is known of the input – this is referred to as test data and is commonly used to validate a model. The data engineer or analyst determines which features of the input should be used for the learning in mapping input-output pairs. Many supervised learning algorithms are readily available, and each has its own applications and strengths (e.g. random forest, decision tree, k-nearest neighbor, support vector machine, and logistic regression are just a few) [4].
Unsupervised learning occurs by inferring patterns in the data without any knowledge of the expected outcomes. The inferred patterns and associations from unsupervised learning are often very useful to improve inferences, including supervised learning scenarios. Though unsupervised learning is often less thoroughly studied, substantial knowledge can be gathered this way. Clustering and dimensionality reduction are two general means of "making sense" of high dimensional data.
Accelerometer based Activity Recognition
Accelerometers detect the magnitude and direction of acceleration and record the values. Most accelerometers estimate acceleration in x, y, and z axes. These
accelerometers are incorporated into electronic devices and can be worn on the waist or wrist. The ActiGraph accelerometer is a research grade wearable device commonly used
5
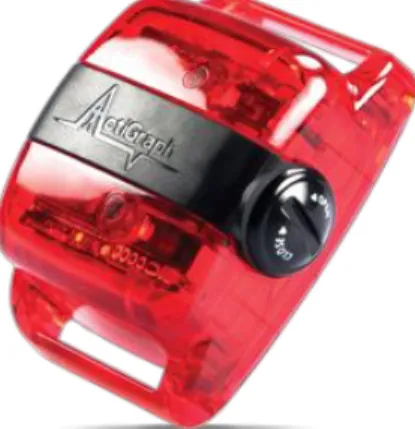
to monitor subject movements and has been validated for a variety of clinical uses [8]. Figure 1 shows the GT3X ActiGraph accelerometer used in this study
FIGURE 1. ActiGraph GT3X accelerometer used in the study. (ActiGraph, Pensacola, FL, USA)
There are several strategies to infer human activities from accelerometer signals, and here we will briefly outline the general machine learning-based approach, assuming we are only training and testing a single model.
Signal data from an accelerometer is collected when the subject is performing the known activities (e.g. running, walking, standing, sitting). At the same time, the activity the subject is performing is annotated along with a start time, an end time, and any other relevant information of the activity. The sensor data is later mapped to the annotation for each activity.
Training and Test Data.
The accelerometer signal is split into data clips of equal width to generate separate data samples for model training. In the simplest case, these samples are divided into two sets – training and test. The training set is used by the classifiers to construct the model, whereas the test set is used to evaluate the model performance.
6
Feature Extraction.
The raw sensor data from the accelerometer is usually not applied directly to machine learning classifiers. Classifiers generally perform best when features that are likely to aid classification are extracted from raw sensor data. During this step, the raw signal for each clip of sensor data is converted into a feature vector for later learning.
Minimally, basic statistical features (e.g. mean, standard deviation, maximum, and minimum values) can be extracted from the linear acceleration value for each axis. Such features can be computed both in the time domain and in the frequency domain. Additional features can be computed from the magnitude of the signal. Depending upon the complexity of the activities, it may be necessary to engineer many different features from the original signal to improve classification performance.
Model Training.
The classifiers are trained with the training data features and activity labels and follow a standard supervised learning approach. Random forest, decision tree, support vector machine, and logistic regression are some of the classifiers shown to work well with large amounts of data, including with activity recognition studies. The model learns to infer the activity label for any given clip of sensor data.
Hyperparameters Tuning.
Most machine learning models are altered at a basic level by a handful of so-called hyperparameters. In general, most hyperparameters alter the complexity of a model (e.g. the "degree" hyperparameter in polynomial regression varies from values n = 1 – linear, to n = 20 – highly complex and irregular). Models with too much
7
can't fit the complex nature of the learning problem at hand. Good hyperparameter choice finds the optimal point between these two sources of error for a model. Model evaluation.
A list of candidate values for the hyperparameters of the classifiers are tested. This is often done using cross validation on the training set. There are various cross validation techniques available and k-fold cross validation is popular among them.In k-fold cross validation, the original samples are partitioned into k subsamples. A single subsample is retained for testing the model, and the remaining subsamples are used for training the model. The cross validation process is then repeated k times, with each of the k subsamples used exactly once as the test data. The results are averaged to produce a single estimate [14]. There are other cross validation techniques (e.g. subject-wise cross validation, block-wise cross validation) which become more important depending on the intended application of the model.
Model Selection.
Evaluations of trained models are based on the performance metrics – accuracy, precision, recall and F1-score. A confusion matrix is a tabular description of the
performance of the classification model on test data where the true classes are along one axis and the predicted classes are along the other axis – e.g. ideally confusion matrices should then be diagonal matrices. Many performance metrics can be derived based on the numbers in a confusion matrix.
Accuracy is the number of correct predictions over all the predictions made by the model. Accuracy is a good measurement for selecting the model when the data are balanced across all the classes. When imbalanced, F1 score is a good alternative
8
measurement. It is a computed score from the precision and recall values. Recall is a measurement of correct predictions of a single class divided by the number of true
instances of that class. Alternately, precision is the number of correct predictions of a single class divided by the number of predicted instances of that class.
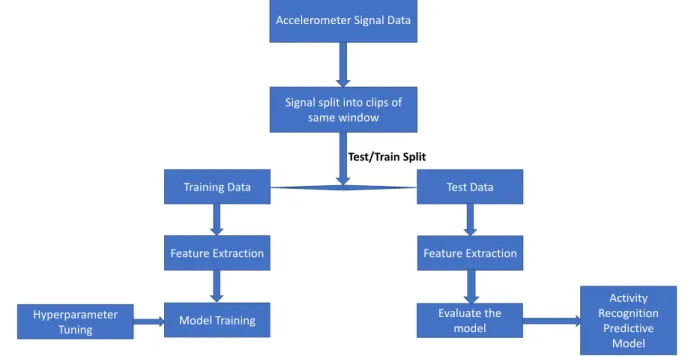
The activity classifier model is then selected based on the chosen performance metrics. Figure 2 shows the processes involved in creating an activity recognition model.
FIGURE 2. Steps involved in generating an activity recognition model
Accelerometer Signal Data
Training Data
Hyperparameter
Tuning Model Training
Evaluate the model Activity Recognition Predictive Model Feature Extraction
Signal split into clips of same window
Feature Extraction Test Data Test/Train Split
9
CHAPTER II
THE TODDLER ACTIVITY RECOGNITION EXPERIMENT Background and Motivation
Obesity is a major health risk affecting a substantial proportion of people in the Unites States. Obesity among children is a bigger concern, since studies have proven that childhood obesity leads to increased health risk in adolescence. Figure 3 shows the growth of obesity over the years in the United Stated among young children and adults.
FIGURE 3: Line graph showing the growth in obesity in young children and adults over the years (National Health and Nutritional Examination Survey)
Physical inactivity contributes to obesity [9]. Studies conducted with children 5 years of age showed that physically inactive children tend to follow the same physically inactive trajectory later in life. Hence it is imperative to measure, understand, and affect physical inactivity during childhood [10, 11]
10
Physical activity (PA) for children under 3 years of age is rarely studied. The objective of this project is to describe the development of PA behavior during toddlerhood by means of machine learning on wearable sensor signals. Machine
learning-based activity recognition tends to show higher accuracy in activity recognition compared to more traditional techniques.
Data Preparation for the Pilot Study
Data was collected from 24 toddlers aged between 13 to 35 months. They were recruited among the users of a private indoor kid playroom located in Chicago. The age (13 to 35 months) and the ability to walk independently were the two criterion used while recruiting the toddlers. Data collection was conducted by the research staff of Ann & Robert H. Lurie Children's Hospital of Chicago.
Toddlers were recruited with the intention of a representative sample of different sexes and races (Figure 4).
FIGURE 4: Distribution of participants by race and sex
Participants were fitted with two ActiGraph GT3X-BT accelerometers (30 Hz), one on the waist and the other on a wrist. Participants were encouraged by their caregivers to engage 10 different activities at least three times per activity, however 20 different activities were annotated based on the observed behaviors. These activities included "lying down", "sitting", "standing", "crawling", "riding a ride-on toy car",
11
"walking", "climbing up and down", "running", "being carried by an adult", and "riding a stroller/wagon". The activities were video-recorded for later annotation.
Accelerometer Data Collection
Toddlers wore the accelerometers on the waist and the wrist. Data from wrist worn and waist worn accelerometers were extracted and processed separately for final comparison. The accelerometer sensor captured acceleration at a rate of 30 Hz along 3 axes.
Toddler Activities
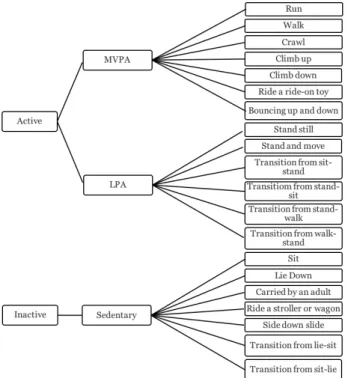
20 distinct activities (Table 1) were recorded. These activity types were grouped into three activity intensity categories – sedentary, light physical activity (LPA), and moderate to vigorous physical activity (MVPA) based on the anticipated intensity of the activity given the specific activity label. These three intensity levels are further grouped into active and inactive. Figure 5 shows the activity annotation hierarchy followed.
12
Annotation of toddler activities
The physical activities of the toddlers were videotaped for later annotation by human observers. Each prescribed activity is annotated in the annotation file as a
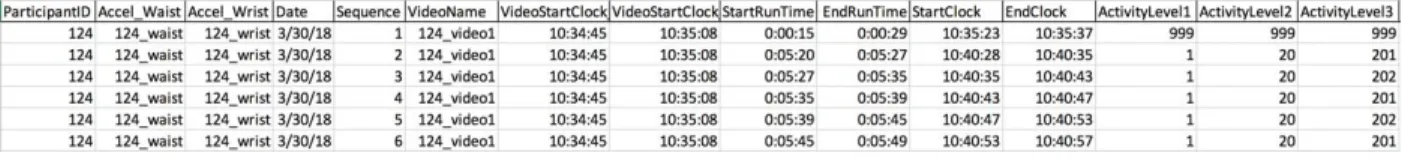
numeric code corresponding to the name of the activity. The annotation file contains the ID of the participant, start and end time of each activity, numeric code of the activity, and other useful information. The annotation file maps sensor signals to the physical activity completed by the toddler. Along with the numeric code of the activity performed by the toddler, the 3-level and 2-level groupings (explained in detail in Chapter 3) are also coded in separate columns. Figure 6 shows a sample of the annotation file compiled by the human coders. The entries in Table 1 show the numeric codes used to represent each activity in the annotation sheet.
FIGURE 6: Annotation sheet for mapping the accelerometer signal data with the activity
TABLE 1: The list of physical activities toddlers performed along with their numeric annotation codes Toddler Activities 101-Run 102-Walk 103-Crawl 104-Climb up 105-Climb down 106-Ride a ride-on toy 107-Bouncing up and down 201-Stand still
202-Stand and move
203-Transition from stand- walk
204-Transition from walk-stand 205-Transition from stand-sit 206-Transition from stand-sit 301-Sit
302-Lie down
303-Carried by adult 304-Ride on a stroller 305-Transition from lie-sit 306-Transition from sit-lie 307-Side down slide
13
Creation of Activity Recognition Model
The first step in creating the activity recognition model is to convert the raw signal into an appropriate form for training the classifier through feature extraction. The accelerometer signal is comprised of a data in which the annotation file indicates a known activity, data when the annotation file indicates an unknown miscellaneous activity, and data which is not represented in the annotation file, such as during the placement or removal of the accelerometer.
The annotation sheet is processed using a Python script to check for any manual coding errors during activity annotation. The invalid activity codes are ignored (e.g. 999, the code representing accelerometer shake time). Any activity codes that do not follow the annotation hierarchy are also ignored (e.g. when "running" is coded as a sedentary activity in the annotation sheet).
Feature Extraction
Accelerometer signal data is segmented into two second windows to generate enough samples for training the classifiers. Time domain and frequency domain features were extracted from the segmented clips.
Twenty distinct activities are performed by the toddlers, and some of the activities annotated are transition activities (e.g. "transition from sit to stand", "sit to lie", "lie to sit", "sit to stand"). The transition activities are quick and are often complete in a few seconds. Samples taken from the accelerometer are only used for training if the entirety of the window falls in the same activity; therefore, to capture the signals
corresponding to each activity, including the transition activities, the duration of the segmented clips was reduced to two seconds (i.e. 60 samples or a 2 second window)
14
Time domain features
Statistical attributes are extracted from each axis (x, y, and z) and the magnitude of the signal. Statistical features from the cross correlation of axis x, y, and z (xy, yz, xz) are also generated to see any patterns in the binary combination of motion axes. A moving average of the signal in the x, y, and z axes is computed to smooth the signal to reduce the effect of noise in each axis. Table 2 lists the 33 features extracted from the time domain.
Description Features Variable Count
Central tendency mean, median, standard deviation x, y, z 9
Symmetry features skew, kurtosis x, y, z 6
Range maximum, minimum x, y, z 6
Magnitude derivate values skew, kurtosis, mean, median, maximum, minimum
√(x2+y2+z2) 6
Cross Correlation mean xy, yz, xz 3
Noise noise x, y, z 3
TABLE 2: Time domain features extracted from the signal Frequency domain features
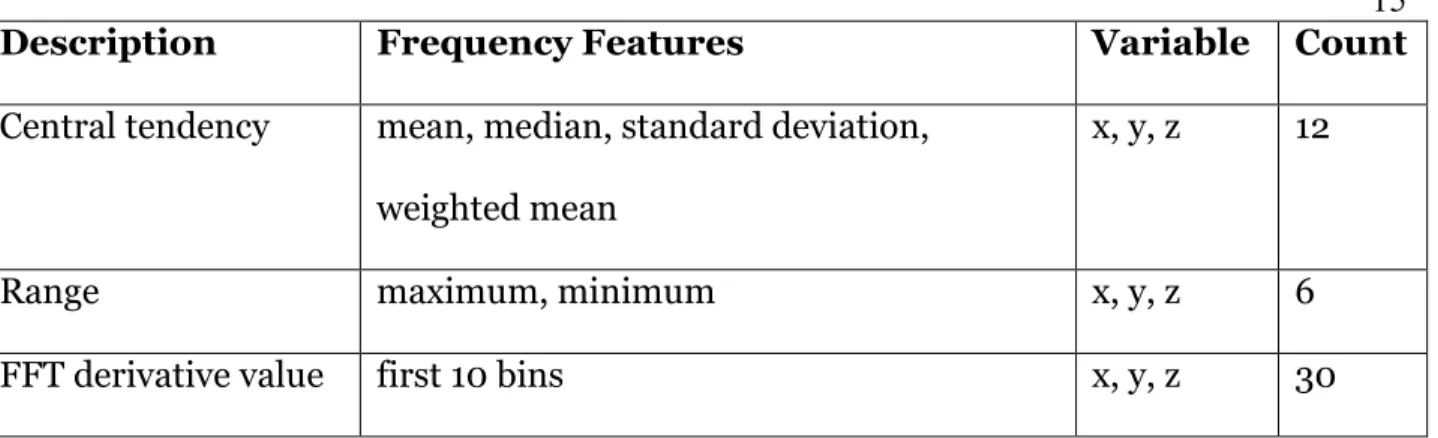
The fast Fourier transform (FFT) was used to convert the data into frequency domain. This is useful for quantifying the amount and frequency of periodic motion in the signal. Mean, median, standard deviation, maximum and minimum values are extracted from each axis in frequency domain. Table 3 lists all the 48 frequency domain features.
15
Description Frequency Features Variable Count
Central tendency mean, median, standard deviation, weighted mean
x, y, z 12
Range maximum, minimum x, y, z 6
FFT derivative value first 10 bins x, y, z 30
TABLE 3: Frequency domain features extracted from the signal Model Training
Each two second data clip is converted to the 81 features previously mentioned. The two second data samples were split into two data sets – training and test set in a 70:30 ratio. The training set is used to build the models and select hyperparameters, and the test set is used to evaluate the trained model.
81 features are extracted from each signal clip. The features most relevant for model construction were determined by feature selection. Random forest feature importance is used to rank features. Only the features which carried more than 25% importance are used for later model training.
Model performance is improved by selecting the right choice of model
hyperparameters. The optimized hyperparameters are selected using grid search cross validation within the training set. Once the optimal hyperparameters are chosen, the full training set is used with that hyperparameter choice for final training. The models were then evaluated using the remaining 30% of the test data set.
Model Selection
The performance of a classifier can be readily observed in the confusion matrix, which can be summarized with metrics such as accuracy. Note, metrics such as accuracy
16
can be misleading when there are a large number of classes, at it is more likely to
mistake an activity when there are 20 alternatives rather than just 3 or 4. Random forest and decision tree had the highest accuracy. Hence random forest is used for most of the results presented later in this chapter.
Hyperparameter tuning
Classifier Hyperparameter Values
K-nearest neighbors number of neighbors 1, 3, 5, 7, 9, 11, 13, 15
SVM regularization parameter 1e-6, 1e-5, …, 1, …, 1e+3, 1e+4 kernel coefficient 1e-6, 1e-5, …,1e-1, …, 1e+3, 1e+4 Logistic regression inverse of regularization strength 1e-5, 1e-4, …, 1e-1, …, 1e+3, 1e+4
Decision tree
min samples split 2, 4, 6, 8, 10 min samples leaf 1, 5, 10, 15, 20
max depth 10, 20, 30, 40, 50 Random forest number of estimators 10, 20, 30, 40, 50, 60, 70, 80, 90, 100, 150, 200,250,300,350,400
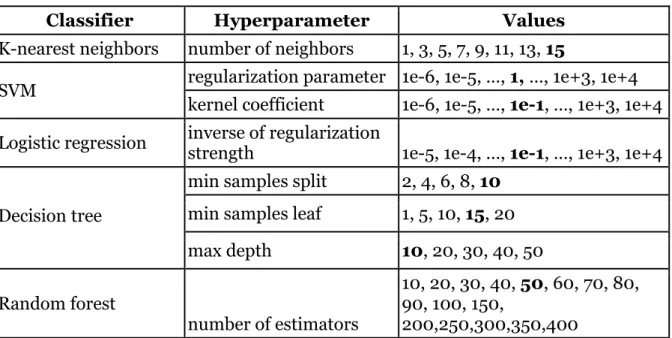
TABLE 4: Hyperparameter grid searched values and (bold) values chosen for the final model
Hyperparameters are selected for each classifier through grid search cross
validation. The grids used and selected values for each of the classifier are listed in Table 4. 10-fold cross validation within the training set was used to select the optimal
hyperparameters.
The logistic regression classifier was tuned with ridge penalty (l2 regularization). The SVM classifier optimum values for gamma and C were selected to avoid possible misclassification. The number of estimators provided a stable accuracy for the RF
17
classifier. Optimizing the three parameters for the decision tree classifier (max_depth, min_samples_leaf, min_samples_split) helped to prevent overfitting.
Results
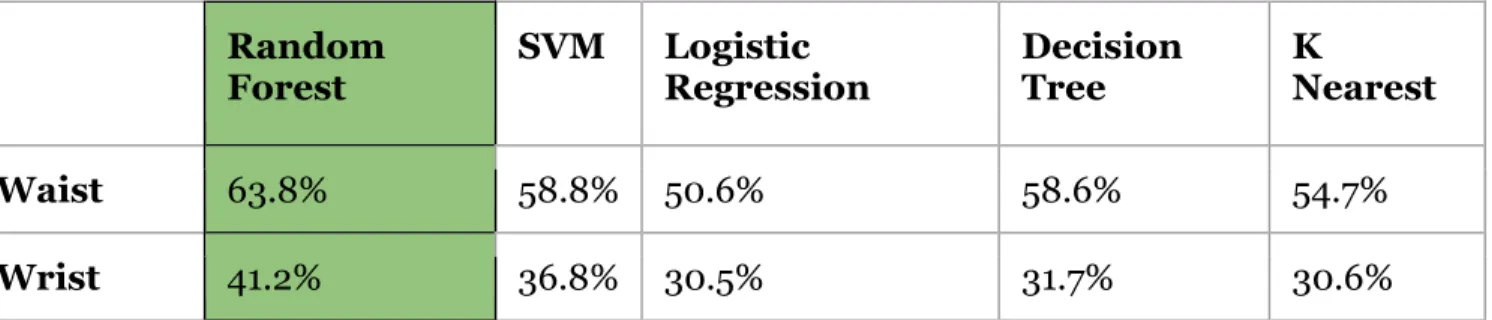
Twenty separate activities were trained with the 5 classifiers – random forest, support vector machine, logistic regression, decision tree, and k nearest neighbors using the 81 features extracted from the signal data. The highest accuracy of 63.8% is achieved with the random forest classifier. Table 5 shows the accuracy achieved by all the
classifiers; the classification was run separately on data from waist and wrist worn accelerometers. Random Forest SVM Logistic Regression Decision Tree K Nearest Waist Worn 63.8% 58.8% 50.6% 58.6% 54.7% Wrist Worn 41.2% 36.8% 30.5% 31.7% 30.6%
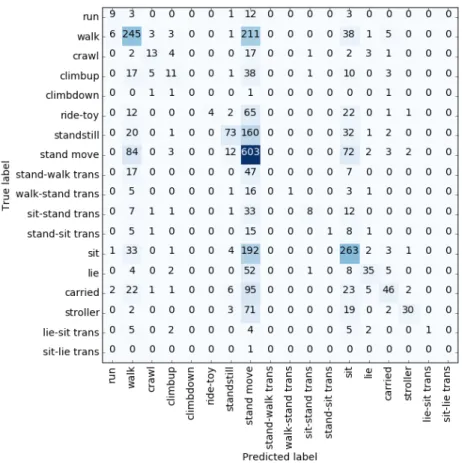
TABLE 5: Overall accuracy of the activity recognition classification with 20 activities The confusion matrix in Figure 7 shows the predicted activity labels in the test data. The activities "bouncing up and down" and "slide down" do not appear on the confusion matrix due to the very short durations and thus lack of data for these activities.
The waist worn accelerometer analysis performed consistently better than the wrist worn accelerometer, as has been observed in similar studies [12, 13]. As the waist worn accuracy was consistently higher, all later analyses are performed on the waist worn signal for clarity
18
FIGURE 7: Confusion matrix generated from the random forest classifier for the waist worn accelerometer
Discussion
The prediction accuracy is highly dependent on the number of classes, and their inherent similarities. There were activities which were similar in nature that led to misclassification and greatly affected the overall accuracy. The activity pairs like "transition from sit to stand" vs "transition from stand to sit", "carried by an adult" vs "ride on stroller", "stand move" vs "standing" were very similar activities in nature which in some other studies are grouped. Having these activities split can disadvantage this model with respect to overall accuracy.
19
FIGURE 8: The distinct activities plotted against time. The linear acceleration of the activities is shown in three different colors.
Additionally, there are activities which intuition would suggest are very
dissimilar, but on observation of the accelerometer signal we can expect they would be difficult to distinguish. Figure 8 shows the accelerometer data of different activities. In general, we observe clear differences between many activities, however, at the smaller timescales in 2 second windows, one can observe much more similarity than the labels suggest. Figure 9 adds markers to provide an alternate view on how the activities may be more similar at these smaller timescales. The activities "running", "walking", and "climb up" are generally more active movements compared to "sitting", "lie down", and "carried by adult"; however, when comparing across groups, we are able to mark similar signals
20
across all these activities. This similarity can lead to poor activity classification affecting the overall accuracy of the model.
FIGURE 9: The distinct activities highlighting similar (2 purple and 7 gray) 2-second clips
Stand-move: an ambiguous class
"Stand move" is an activity which strongly affects accuracy. The "stand move" activity from the name itself suggests components both active and inactive. When looking into the confusion matrix on Figure 10, it is clear that the activity "stand move" is confused with "walking", "standstill", and "sitting". Notably, when "stand move" is removed, the accuracy increases from 63.8% to 83.7% – in other words, a nearly 50% reduction in errors.
21
FIGURE 10: Confusion matrix derived from random forest classifier highlighting how "stand move" is misclassified
Clustering
This experiment has been conducted without grouping similar activities as is commonly done in activity recognition research – especially when researchers are
seeking higher-accuracy results to report. However, with these many activities, finding a natural grouping is difficult, as intuitions may suggest one set of groupings, while the sensor data and accuracies may suggest another. To provide some insight into this next step, a clustering of the 20 distinct activities was performed. This was done by
measuring the mean of each feature for each activity and generating a table. This table was used for hierarchical clustering, as shown in Figure 11. Additional unsupervised
22
learning approaches could be used to pursue a data-driven approach for selecting activity labels to be used in practice.
FIGURE 11: Hierarchical clustering dendrogram from the feature values (mean) of the twenty activities
23
CHAPTER III
ACTIVITY LEVEL CLASSIFICATION
3-level classification: sedentary, light, and moderate
The physical activities performed by the toddlers are summarized into various categories based on the perceived intensity level. The three levels studied here are sedentary, light physical activity (LPA), and moderate to vigorous physical activity (MVPA). MVPA activities generally require more oxygen consumption compared to the other activities. Activities which generally require very little effort are labeled into LPA. The below table categorized the 20 activities performed by the toddlers based on the intensity levels. Note, this 3-level classification is strictly determined by the observed activity label, and not as a separate judgement. For example, MVPA "riding on a ride-on toy" may be less active than some sedentary activities but given that label is it strictly MVPA here by definition. Similarly, "transitions from lie-sit" may involve a lot of movement but are considered sedentary in this labeling.
TABLE 6: List of activities under each intensity category
MVPA LPA Sedentary
Run Walk Crawl Climb up Climb down Ride a ride-on toy Bouncing up and down
Stand still Stand and move
Transition from stand-walk Transition from walk-stand Transition from stand-sit Transition from stand-sit
Sit
Lie down
Carried by adult Ride on a stroller Transition from lie-sit Transition from sit-lie Side down slide
24
The extracted sensor signal clips are matched to the intensity levels as defined by Table 6. A total of 8319 two second clips were generated for training the model. The model is then applied on the 3566 clips used for testing. The same 81 features for the activity classification were used for the activity level classification here. Figure 12 shows example accelerometer signals for each activity level. MVPA activities have larger
magnitudes and faster changes in acceleration compared to LPA and sedentary.
FIGURE 12: Activity level accelerometer signal examples for 3 levels – Sedentary, LPA, and MVPA
Grouping of similar activities generally improved overall accuracy as there are fewer classes in which the classifier can mislabel. That is observed here with an improved accuracy over the 20 activity classifier, however, the improvement was modest. The random forest classifier performed best with an accuracy of 73.6% on the waist worn signal. The confusion matrix for the test data is shown in Figure 13.
Moderate activities are misclassified as light physical activities more than sedentary. Sedentary activities were misclassified into light activities more often than moderate ones.
25
Random Forest SVM Logistic Regression Decision Tree K Nearest
Waist
Worn 73.6% 69.0% 58.9% 69.2% 67.7%
Wrist Worn
56.7% 54.1% 47.7% 51.3% 50.1%
TABLE 7: 3-level activity level classification accuracy
FIGURE 13: Confusion matrix for the 3-level activity level classification
This accuracy is lower than expected. One potential reason is the precision of the activity labels relative to the size of clips. Some labeled activities may be composed of sensor signals which can easily be confused on smaller timescales. This can be visually observed in Figure 14. The highlighted areas show similar fluctuations across activity levels. Even though all the activities are attributed correctly at longer timescales by a human observer, the sensor signals appear to indicate that within these labels, the intensity of motion may not match the intensity level based directly attributed to each activity type. Anecdotally, 4 seconds clips were tested instead of the 2 second clips
26
throughout this study. Accuracy did not show significant improvement, so altering clip size was not further studied, though this is a likely area of potential future work as larger clips sizes may be more appropriate for such high-level activity level summaries.
FIGURE 14: 3-level activity level examples highlighting similarity 2-level classification (inactive and active)
The 2-level activity level classification grouped the activities into active and inactive. Table 8 lists all the activities under each grouping. The moderate and light intensity physical activities are classified as the "active" activity level and sedentary activities are grouped into the "inactive" activity level.
TABLE 8: 2-level classification and the activities under each level
Active Inactive
MVPA LPA Sedentary
Run Walk Crawl Climb up Climb down Ride a ride-on toy Bouncing up and down
Stand still Stand and move
Transition from stand-walk Transition from walk-stand Transition from stand-sit Transition from sit-stand
Sit
Lie down
Carried by adult Ride on a stroller Transition from lie-sit Transition from sit-lie Side down slide
27
The classifiers are trained with two second data clips. A total of 9731 clips were created for training the 5 classifier models. The model accuracy was 85.2% using random forest. As expected, all five classifiers had higher accuracies in this binary classification task compared to classification of more activities or activity levels. As with all the experiments conducted the waist worn accelerometer consistently performed better.
Figure 15 shows example signals in both classification levels. The active class has observable bouts of vigorous and light movements because MVPA and LPA both fall under the active classification. Note however, a portion of the "active" example also has a window of little movement which would lead a clip-based activity recognition system to likely misclassify that portion of the signal as sedentary. The seemingly inaction portion of the clip is marked in gray colored lines
FIGURE 15: 2-level activity level examples highlighting similarity
The confusion matrix in the Figure 16 is generated by random forest classifier and as expected from the plot analysis we could see that some of the active clips are misclassified as inactive and vice versa. The Table 9 shows the accuracy of each classifier.
28
FIGURE 16: Confusion matrix for the 2-level activity level classification
Random Forest SVM Logistic Regression Decision Tree K Nearest
Waist
Worn 85.2% 83.2% 66.7% 83.1% 83.6%
Wrist Worn
78.2% 77.2% 74.2% 74.2% 73.3%
29
CHAPTER IV
DISCUSSION: LIMITATIONS AND FUTURE WORK Limitations
The large number of unique annotated activities studied here, and the variability of freely behaving toddlers created challenges in analysis. In comparison to instructed behaviors, natural freely-behaving activities of toddlers are very quick making it difficult to annotate and automatically categorize the activities accurately. To capture such short-timescale activities the clip size was kept small, which led to difficulties in recognizing activities composed of multiple natural segments. Also, certain specific activities with mixed component signals (e.g. "stand move") significantly affect the accuracy of the model. These limitations are explained in detail as follows.
Quick transitions in freely-behaving toddlers: Twenty labelled activities were performed by the toddlers, but many activities were very abrupt sometimes lasting only one second. This led to many times in which there was not sufficient time to create a clip for analysis. Quick transitions also led to difficulties in accurate timing in the annotation file and accurate syncing between the annotation file and the sensor signal data, likely contributing to error. Training the model with activities labeled incorrectly or mismatch in the timestamps captured by the device likely affects the overall
performance of the model. Potential solutions are addressed in the next section – future work.
30
Comparing models with different numbers of classes: Models with multi-class classifications performs poorer when compared to binary classifications, as there are more potential ways to misclassify an observation. It is challenging to compare accuracies between our models and other work as the number of activity classes varies widely. Also, the duration of the activities is not equally distributed in the data which changes the impact of each class on overall matrix.
Separate classes that should be grouped: Some classes are inherently difficult to accurately classify due to the limitations of the accelerometer signal. For instance, the features of the activities "walk" and "stand-move" are similar and this leads to the misclassification of the walking activity. Similar to how "stairs up" and "stairs down" may simply be grouped as "stairs", it is sometimes beneficial to select activity groups based on perceived similarity according to the accelerometer readings.
Ambiguous classes leading to poor performance: Additionally, ambiguity in the class definitions themselves can lead to more challenging activity recognition. For example, "stand-move" is one of the most miscategorized activities, in part because it is a combination of activities in smaller timescales. This leads to a persistent challenge for activity classification. For example, by removing "stand-move" the accuracy of the activity classifier (with now 17 activities) increases dramatically from 63.8% to 83.7% – roughly half of the errors came from this single activity. Future efforts may involve redefining this activity during labeling.
Clip size limitations: The models are trained with 2 second width data clips. The features present in such short clips likely do not well represent the signal over the entirety of an activity. This likely led to a great deal of the observed misclassification.
31
Future efforts would benefit from either using techniques which take into account information in neighboring clips, or from original activity labels which are more directly tied to movements of the device (e.g. never let "walking" have 2 second bouts of no movement).
Syncing/shifting between annotation file and sensor signal: The
annotation files labels each of the activities performed by the toddlers. The activities are videotaped and labeling of the activities are done manually by analyzing the video recorded. Any shift in the video clock will affect the timestamp of the data captured by the accelerometer. In this scenario, an activity labeled might not be the actual activity performed by the toddler. A small shift in the video start time will be reflected
throughout the activities labeled using the same video clip. Although there were efforts to synchronize the clocks between the video and sensors during recording, there was no correction to the synchronization later during analysis, and this would likely result in improved accuracy, especially for activities with very short durations.
Future Work
A number of future improvements are possible – some are relatively
straightforward choices that have been informed by this work, others are more extensive and reserved as future projects. Fixing the synchronization issues between the
annotation file and accelerometer signal can increase the performance of the recognition model. Subject-wise cross validation is also expected for proper validation, and such analysis could also provide more information on which individuals may not have proper time synchronization between the annotation file and sensor data. Finally, we will discuss how much of activity recognition, being a sequential signal, is moving toward
32
using techniques which handle dependencies between segments of the signal; this suggests that dynamic state estimation techniques, such as hidden Markov models (HMM), would be the next reasonable direction to this research.
Properly sync annotation file and sensor signals: The annotation file is used as the ground truth for labeling the toddler activity, and for the best accuracy it is critical to have proper clip labels. By having the annotation file clock differ from the sensor clock, even by one second, much of the analysis is tainted with impure data leading to inflated errors. This can be addressed in multiple ways. First, segmentation techniques could be used to estimate borders between activities in the sensor signals, and the matching between those borders and the annotation file could be done manually or programmatically. Second, data visualizations could be used to observe the
timestamps of annotation compared to the sensor data to verify any shift in the timestamp in accordance with the annotation file. Third, average sensor features
could be observed for each annotated activity, and with the proper shift the assumption is that sensor features would be more distinct for clearly disparate activities (e.g.
"walking" vs "sitting"). Such sensor features could be plotted relative to shifts and used to establish the shift visually or programmatically.
Combine appropriate activities: By combining similar activities and labeling them appropriately accuracy could be greatly improved. Activities such as "walk" and "stand-move", "moving in the stroller" and "carried by an adult", "stand-walk transition" and "walk-stand transition" are pairs of activities which should be combined and labeled as composite activities due to their similarity of features.
33
Subject-wise cross validation: The accuracies obtained earlier are from pooled data from all 24 toddlers. However, this led to a single toddler having part of their movement data in the training set, and part in the test set. A more valid test of activity recognition in a practical sense would be to have separate subjects in training and testing – a subject-wise cross validation of the model. This way, the accuracy score obtained are more likely what is to be observed when a developed model is applied to a new toddler (as opposed to a toddler for which training data was previously collected).
Test alternate clip sizes: Clip size was not thoroughly tested; 2-second clips were chosen due to opposing constraints, though many activity recognition studies use clips of 10 or even 15 seconds. Clips needed length of have sufficient variation in the signal for classification, however, if clips were too long entire movement classes (like sit-to-stand) would not be adequately extracted for testing. This is partly due to the random movement of the toddler and partly due to the overall amount of data collected.
Alternate clip sizes could be selected from the data pool and use for training the model instead, which may have dramatic impacts, especially in the case of activity level classification.
Use dynamic state estimation models (e.g. HMMs): One major limitation of this approach is the clip-based classification strategy. When there is not enough information in a clip to make an accurate classification, it is beneficial to use
neighboring classifications to improve accuracy. The techniques used here treat each clip in isolation, but this is clearly not the case. For example, it is more likely to see a "walking" clip after a "walking" clip rather than a "lie down" clip. And it is especially more likely to see a "sit" clip after a "transition from stand-sit" clip, but this model does
34
not take that into account. Future work would involve incorporating dynamic state estimation models, such as hidden Markov models, to more accurately capture the temporal nature of the data.
35
REFERENCE LIST
[1] Che-Chang Yang, Y.-L. H. (2010). A Review of Accelerometry-Based Wearable Motion Detectors for Physical Activity Monitoring. Sensors.
[2] Mark V. Albert, K. K. (2012). Fall Classification by Machine Learning Using Mobile Phones. PLOS One.
[3] Chen, L., Nugent, C. D., & Wang, H. (2011). A Knowledge-Driven Approach to Activity Recognition in Smart Homes. IEEE Xplore.
[4] Raschka, S. (2015). Python Machine Learning. PACKT.
[5] Shyamal Patel, H. P. (2012). A review of wearable sensors and systems with application in rehabilitation. PMC.
[6] Farrokh F. Mohammadzadeh, S. L. (2015). Feasibility of a Wearable, Sensor-based Motion Tracking System. Science Direct.
[7] F. Duarte, A. Lourenço, and A. Abrantes, “Classification of Physical Activities Using a Smartphone: Evaluation Study Using Multiple Users,” Procedia Technol., vol. 17, pp. 239–247, 2014.
[8] Ylvisåker, E. A. (2014). Reliability of the Actigraph GT3X+ Accelerometer in Adults under Free-Living Conditions. PLOS One.
[9] Harmon S. Jordan, S. K.-M. (2014). A Report of the American College of
Cardiology/American Heart Association Task Force on Practice Guidelines and The Obesity Society. Journal of the American College of Cardiology.
[10] Kathleen F. Janz, E. i. (2009). Sustained Effect of Early Physical Activity on Body Fat Mass in Older Children. AJPM.
[11] Soyang Kwon, K. F. (2015). Active lifestyle in childhood and adolescence prevents obesity development in young adulthood. Obesity Society.
[12] Costa S, Barber SE, Cameron N, Clemes SA. The objective measurement of physical activity and sedentary behaviour in 2-3 year olds and their parents: a cross-sectional feasibility study in the bi-ethnic Born in Bradford cohort. BMC Public Health. 2015;15(1):1109]
36
[13] Wijtzes AI, Kooijman MN, Kiefte-de Jong JC, et al. Correlates of physical activity in 2-year-old toddlers: the generation R study. J Pediatr. 2013
[14] Wikipedia contributors. "Cross-validation (statistics)." Wikipedia, The Free Wikipedia, The Free Encyclopedia, 21 Jun. 2018. Web. 24 Jun. 2018.
37
VITA
Pinky Sindhu is from Kerala, the southern tropical coastal state of India. She completed her Bachelor of Technology degree in Electronics and Communication from Kerala University in 2009. After obtaining her degree Pinky worked in three software companies gathering programming experience in healthcare and telecom domains.
Pinky came to the United States of America in 2015 by carrying an ambition to continue her studies in the states. After looking through various programs and schools, Pinky joined the MS in Computer Science program at Loyola University Chicago. She received a teaching assistantship merit award during the program. She was also the winner of the CS department project presentation competition at the end of her time at Loyola.
Pinky began her first experience in research when she joined the summer
research program organized by Loyola University's Computer Science Department. She continued with research after the end of the summer program by joining the Machine Learning Lab with Dr. Mark V. Albert. This finally led to joining the ongoing toddler activity recognition pilot study which culminated in thesis work.