TWO DATA MINING APPLICATIONS FOR PREDICTING PRE-DIABETES
A Dissertation
Submitted to the Graduate Faculty of the
North Dakota State University of Agriculture and Applied Science
By Guangjing You
In Partial Fulfillment of the Requirements for the Degree of
MASTER OF SCIENCE
Major Department:
Industrial Engineering & Management
November 2015
North Dakota State University
Graduate School
TitleTwo data mining applications for predicting pre-diabetes
By Guangjing You
The Supervisory Committee certifies that this disquisition complies with North Dakota State University’s regulations and meets the accepted standards for the degree of
MASTER OF SCIENCE SUPERVISORY COMMITTEE: Kambiz Farahmand Chair Jing Shi Yarong Yang Approved: 11/20/2015 Om Prakash Yadav
iii
ABSTRACT
In this study, the performance of Logistic Regression and Decision Tree modeling is compared by using SAS Enterprise Miner for predicting pre-diabetes in US population by using several of the common factors from the type 2 diabetes screening criteria. From 17 variables of NHANES’ three sets of dataset, a total of 13 risk factors were selected as predictors of pre-diabetes. A comparison of two data mining methodology showed that Decision Tree has a higher ROC index than Logistic Regression modeling. All ROC indexes for two models were greater than 77% indicating both methods present a good prediction for pre-diabetes. The predictive accuracy of the two models was greater than 72% on the whole dataset. Decision tree modeling also resulted in higher accuracy and sensitivity values than Logistic Regression modeling. Taken as a whole, the results of comparison indicated Decision Tree modeling is a better indicator to predict pre-diabetes.
iv
TABLE OF CONTENTS
ABSTRACT ... iii
LIST OF TABLES ... vi
LIST OF FIGURES ... vii
LIST OF ABBREVIATIONS ... viii
INTRODUCTION ... 1
DATA DESCRIPTION ... 4
Data Collection ... 4
Variables ... 5
PROCESSING RESEARCH ... 11
Regression Methods Literature Review ... 11
Decision Tree Literature Review ... 24
PREDICTION MODELS ... 32
Logistic Regression Analysis ... 32
Decision Tree Analysis ... 33
RESULTS... 35
Results of Chi-square Test ... 35
Results of Logistic Regression ... 43
Results of Decision Tree ... 48
DISCUSSION THE RESULTS OF COMPARISON ... 62
CONCLUSION ... 69
REFERENCES ... 72
v
Decision Tree Nodes of 2007-2008 ... 84
Decision Tree Nodes of 2009-2010 ... 87
Decision Tree Nodes of 2011-2012 ... 91
APPENDIX B ... 94
2007-2008 Tree Leaf Report ... 94
2009-2010 Tree Leaf Report ... 104
vi
LIST OF TABLES
Table Page
1. Type 2 diabetes screening criteria ... 6
2. Explanatory variable explanation ... 9
3. Logistic regression for diabetes or pre-diabetes ... 20
4. Decision tree for diabetes or pre-diabetes ... 29
5. Chi-square test analysis for 2007-2008 ... 37
6. Chi-square test analysis for 2009-2010 ... 39
7. Chi-square test analysis for 2011-2012 ... 41
8. The importance of the 7 input variables in three logistic regression models ... 44
9. Variables in the logistic regression equation ... 48
vii
LIST OF FIGURES
Figure Page
1. Diabetes and pre-diabetes diagnosis criteria (WHO, 2014) ... 2
2. Significant variables were selected by Chi-square test ... 36
3. Comparison of AUC for logistic regression model in 2007-2008 ... 45
4. Comparison of AUC for logistic regression model in 2009-2010 ... 45
5. Comparison of AUC for logistic regression model in 2011-2012 ... 46
6. Comparison chart of logistic regression ROC statistics ... 47
7. Proportions of participants in pre-diabetes and normal group ... 49
8. Comparison process flow diagram ... 50
9. Decision tree for detecting pre-diabetes in 2007-2008’s data ... 59
10. Decision tree for detecting pre-diabetes in 2009-2010’s data ... 60
11. Decision tree for detecting pre-diabetes in 2011-2012’s data ... 61
12. ROC curve of two models for 2007-2008 database ... 65
13. ROC curve of two models for 2009-2010 database ... 65
14. ROC curve of two models for 2011-2012 database ... 66
15. Comparison chart of classification results and ROC indices from whole dataset ... 68
viii
LIST OF ABBREVIATIONS
AACE ...American Association of Clinical Endocrinologists Medical ADA ...American Diabetes Association
ANNs ...Artificial Neural Networks AOC ...Area of Curve
ARIC ...Atherosclerosis Risk in Communities AUC ...Area Under Curve
AUSDIAB ...Australian Diabetes Obesity and Lifestyle Study BLR ...Binary Logistic Regression
BMI ...Body Mass Index BPSYS ...Systolic Blood Pressure
CART/CRT ...Classification and Regression Tree CDC ...Centers for Disease Control
CHAIN ...Chi-Square Automatic Interaction Detection CMI ...Comorbidity Index
CMS ...Centers for Medicate and Medicaid Services CS ...Chi-Square
CURES ...Chennai Urban Rural Epidemiology Study CVD/CV ...Cardiovascular disease
DBP ...Diastolic Blood Pressure DT ...Decision Tree
ER ...Emergency Department Visits ESRD ...End-Stage Renal Disease
ix FBS ...Fasting Blood Glucose FFA ...Free Fatty Acid
FP ...False Positive
FPG ...Fasting Plasma Glucose FN ...False Negative
GDM ...Gestational Diabetes Mellitus GLU ...Blood Glucose
GT ...Gamma-glutamyl Transferase HbA1C...Glycated Hemoglobin
HDL ...High-Density Lipoprotein
ICMR-INDIAB ...Indian Council of Medical Research-Indian Diabetes ICSI ...Institute for Clinical Systems Improvement
IDF ...International Diabetes Federation IDRS ...Indian Diabetes Risk Score ID3 ...Iterative Dichotomister IFG ...Impaired Fasting Glucose IGT ...Impaired Glucose Tolerance HIS ...Indian Health Service K-NN...K-nearest Neighbor LDL ...Low Density Lipoprotein LR ...Logistic Regression
MLR ...Multinomial Logistic Regression NASH ...Non-alcoholic Steatohepatitis
x
NHANES ...National Health and Nutrition Examination Survey NIDDM ...Non-Insulin-Dependent Diabetes Mellitus
OGTT ...Oral Glucose Tolerance Test OV ...Office Visits
PCOS...Polycystic Ovarian Syndrome PDM ...Pre- Diabetes Mellitus
PIDD ...Pima Indian Diabetes Dataset
PLS-DA...Partial Least Square Discriminant Analysis PLS-LDA ...Partial Least Square-Linear Discriminant Analysis PNN...Prototype Nearest Neighbor
ROC ...Receiver Operating Characteristic SAHS ...San Antonio Heart Study
SVM ...Support Vector Machines TG ...Triglyceride
TN ...True Negative TP ...True Positive
TLGS...Tehran Lipid and Glucose Study T2DM ...Type 2 Diabetes Mellitus
VA/DoD ...The Department of Veterans Affairs and the Department of defense UCI ...University of California
UCL...University College London
USPSTF ...U.S. Preventive Services Task Force WC ...Waist Circumference
xi
WEKA...Waikato Environment for Knowledge Analysis WHO ...World Health Organization
1
INTRODUCTION
Diabetes is the fastest growing chronic disease in the world. In the United States,
according to the Centers for Disease Control and Prevention (CDC) Diabetes report (2014), there were more than twenty-nine million people or 9.3% the U.S. population who had diabetes in 2012. From which, twenty-one million were diagnosed, and 8.1 million with diabetes were undiagnosed. Diabetes is a common chronic disease, which occurs when the pancreas does not produce enough insulin, or when the body cannot effectively use the insulin it produces. This leads to an increased concentration of glucose in the blood.
There are two main types of diabetes:
Type 1 diabetes mellitus: when most or all insulin producing beta cells in the pancreas have been destroyed, so there is a severe lack of insulin in the body.
Type 2 diabetes mellitus: when the pancreas still produces insulin but body cannot use insulin properly.
Type 1 diabetes often happens in children and adolescents. However, type 2 diabetes is the most common form of diabetes. In adults, type 2 diabetes accounts for about 90% to 95% of all diagnosed cases of diabetes. Patients with type 2 diabetes require long-term health
management plans (ADA, 2013). According to the statistics of CDC (2014), $ 245 million were used for the total costs and lost work and wages for people with diagnosed diabetes. From these numbers, one can see that type 2 diabetes has significant financial impact. In this study, the assumption is the type 2 diabetes if a particular kind of diabetes is not mentioned.
Data from the National Diabetes Statistics report (2014), 86 million American age greater and equal 20 years had diabetes in 2012. It is mean that more than 1 out of 3 adults have pre-diabetes. A person with pre-diabetes who has a blood sugar level higher than normal, but not high
2
enough for a diagnosis of diabetes. At this stage, patients may be considered to have pre-diabetes. Often, they have Impaired Glucose Tolerance (2-hour OGTT values between 140 and 199 mg/dl), IFG (FPG between 100 and 126 mg/dl), or an A1C of 5.7–6.4%. Blood test level was shown in figure 1 as follow:
Figure 1. Diabetes and pre-diabetes diagnosis criteria (WHO, 2014)
These individuals are at higher risk for developing type 2 diabetes and other serious health problems, including heart disease, and stroke. Without lifestyle changes to improve their health, 15% to 30% of people with pre-diabetes will develop type 2 diabetes within five years. But, 9 out of 10 adults do not know who have pre-diabetes. Therefore, identifying individuals at high risk for pre-diabetes is an urgent need.
Effective diabetes screening could improve people’s quality of life and reduce the cost of health care system. Screening should be sequential, not a one-time event. However, when and how to screen asymptomatic individuals is a complex decision. In order to group the patients who
Condition
Diabetes
Pre-diabetes
Normal
Oral Glucose Tolerance Test (mg/dl) 200 & above140-199
139 & Below Fasting plasma glucose (mg/dl) 126 & above100-126
99 & Below Glycated hemoglobin /Hb A1C (percent) 6.5 & above5.7- 6.4
5.6 & Below3
have the same condition and make a screening schedule for same group. Based on these requirement, how to accurately predict and diagnose diabetes or pre-diabetes are vital for healthcare system.
The objective of this study is compare qualitative models in data mining for pre-diabetes. Data mining is the processing of analyzing large-scale data in order to descript, understand and predict trends in the data. This is the reason why data mining technologies were used to analyze the constantly increasing volumes of data for diabetes.
4
DATA DESCRIPTION Data Collection
Data of National Health and Nutrition Examination Survey (NHANES) in website of Centers for Disease Control and Prevention (CDC) were released to the public in 2-year cycles, all participants were interviewed from 15 different country locations selected from a sampling frame that included all 50 states in U.S. and District of Columbia. Following this method, data was selected from 1999 to present. In this study, the recent three 2-year cycles data were chose and analyzed. From which, data of 2011-2012 was used and eliminated all participants with any of the “missing”, “refused”, and “don’t know” among total 9756 participants. Each of data set, represent the two-year data release cycle number. In the original data, there are two dependent variables, first is “Ever doctors told you have pre-diabetes” and the other one is “Doctor told you that you have diabetes”. These two variables were combined together, and if anyone was told “Borderline”-on the verge of diabetes, they will be considered the pre-diabetes patients.
Ultimately, there were 4312 survey participants who had the integrated information about what was needed. NHANES 2007-2008 demographics data had a total 10,149 participants and 2009-2010 demographics data have total 10,537 participants. For 2007-2008 and 2009-2009-2010 NHANES data, the same procedure was done as data of 2011-2012. The final total observations are 2985 and 3357. In final version, all diabetes patients had been deleted. Therefore, these data were applied to analyze which factors would cause pre-diabetes and to find how these factors predict pre-diabetes.
5
Variables
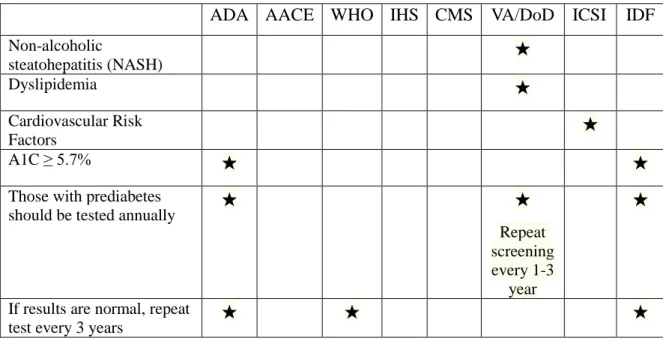
To detect people with diabetes in early stage, based on the study of Tan et al (2014) comparison was made eight guidelines: 1. The American Diabetes Association (ADA, 2014); 2. American Association of Clinical Endocrinologists medical (AACE, 2013); 3. The World Health Organization (WHO, 2006); 4. The Indian Health Service (IHS, 2011); 5. Centers for Medicate and Medicaid Services (CMS); 6. The Department of VeteransAffairs and the Department of defense (VA/DoD, 2010); 7. The Institute for Clinical Systems Improvement (ICSI, 2012); 8. The International Diabetes Federation (IDF, 2006). All of them were utilized to care for patients with type 2 diabetes. Individuals might have some early signs of the disease but do not exactly meet the criteria for diagnosis. Several of these guidelines considered patients to be at high risk for undiagnosed type 2 diabetes if they had 1 or more of the following diabetes risk factors, For example, the ADA (2014) guidelines recommendations for screening for type 2 diabetes: a family history of diabetes (defined as diabetes in a parent, brother, or sister, or some combination thereof), hypertension, cardiovascular disease (myocardial infarction, heart failure, atrial
fibrillation, stroke, peripheral vascular disease), lipid metabolism disorders, obesity (Body Mass Index, BMI ≥25 kg/𝑚2), age ≥ 45 years, and a history of gestational diabetes mellitus. Five comparison tables were made to see what differences are present between these guidelines. Risk factors will be considered based on these criteria to predict pre-diabetes. The one of five
6 Table 1. Type 2 diabetes screening criteria
ADA AACE WHO IHS CMS VA/DoD ICSI IDF
Overweight (BMI ≥ 25 kg/𝑚2)
★ ★ ★ ★ ★ ★
First-degree relative with diabetes
★ ★ ★ ★ ★ ★ ★ ★
Women who delivered a
baby weighing > 9 lb ★ ★ ★ ★ ★ ★ ★ ★ Hypertension (>140/90 mmHg) ★ ★ ★ ★ ★ ★ ★ ★ HDL cholesterol <35 mg/dl or triglyceride level >250 mg/dl (VA/DoD HDL cholesterol <40 mg/dl) ★ ★ ★ ★ ★ ★ ★ ★
IGT or IFG on previous
testing/Pre-diabetes ★ ★ ★ ★ ★ ★ ★ History of Gestational Diabetes Mellitus (GDM) ★ ★ ★ ★ ★ ★ Polycystic ovarian syndrome (PCOS) ★ ★ ★ ★ ★ ★ ★ Acanthosis Nigricans ★ ★ ★ ★ ★ ★
Other clinical conditions associated with insulin resistance (e.g., Severe obesity, PCOS, Acanthosis Nigricans) ★ ★ History of CVD ★ ★ ★ ★ High-risk race/ethnicity ★ ★ ★ ★ ★ ★ Physical inactivity ★ ★ ★ ★ Age ≥45 years (WHO Age≥35 years CMS Age ≥65 years)
★ ★ ★ ★ ★
History of Vascular Disease ★ ★
Antipsychotic therapy for schizophrenia or severe bipolar disease
★ ★
7
Table 1. Type 2 diabetes screening criteria (continued)
ADA AACE WHO IHS CMS VA/DoD ICSI IDF
Non-alcoholic steatohepatitis (NASH) ★ Dyslipidemia ★ Cardiovascular Risk Factors ★ A1C ≥ 5.7% ★ ★
Those with prediabetes
should be tested annually ★ ★
Repeat screening every 1-3
year
★
If results are normal, repeat
test every 3 years ★ ★ ★
In the present study, the following dependent variable coding is used: ‘No
Pre-diabetes’=0, and ‘Pre-diabetes’=1. According to the data from the National Health and Nutrition Examination Survey. 17 variables were chose, including gender (male/female), age,
race/ethnicity (six levels), served active duty in US armed forces (yes/no), born of U.S. (yes/no), citizenship status (yes/no), education level (five levels), marital status (six levels), total number of people in the family (six levels), annual family income (fourteen levels), ever told you have health risk for diabetes (yes/no), smoked (two levels), physical activity (three levels), high cholesterol level (yes/no), hypertension status (three levels), diet (five levels), and BMI. Age and body mass index are continuous variables, while the other 15 factors are categorical variables. These two continuous variables are explain below:
1) Age is the most important factor for the risk of type 2 diabetes, because the incidence of diabetes increases steeply with age of the fifty articles total in table 3, there are forty-one studies (82%) mentioned age as predictor in their regression model. Effective
pre-8
diabetes screening can reduce the incidence of diabetes and cost of treatment. For instance, Chung et al. (2014) reconsidered the age thresholds of screening using cross-sectional analysis of a nationally representative sample from the National Health and Nutrition Examination Survey, 2007–2010. This study examined the optimal age for opportunistic universal screening, compared to different screening, methods
recommended by the U.S. Preventive Services Task Force (USPSTF) and American Diabetes Association (ADA) guidelines.
2) Body Mass Index (BMI) is another important factor. The equation of BMI =Weight (kg)/Height (m)2= 703*Weight (lb)/Height (inch)2, so the BMI index will increase with weight. Tayek’s (2002) showed, weight loss alone will not cure the type 2 diabetes, but it could reduce the incidence of type 2 diabetes. As mentioned, following the six guidelines, adults should be evaluated for type 2 diabetes if they are overweight (BMI ≥ 25 kg/m2) and have one or more of the factors list in table 1. In addition, waist circumference is another form of BMI could be a factor. All of the fifty articles total in table 3, there are twenty-five papers (50%) mentioned BMI as predictor in model, and fifteen studies (30%) mentioned waist circumferenceas factor in their regression model.
9 Table 2. Explanatory variable explanation
Factor Variable Variable assignment rules
Age 𝑥1 20 years of age or older
Body mass index 𝑥2 Body mass index calculated by the weight in kilograms divided by the square of the height in meters
Gender 𝑥3 Gender of patient (Male=1; Female=2)
Race 𝑥4 Race/ethnicity (Mexican American=1; Other
Hispanic=2; Non-Hispanic White=3; Non-Hispanic Black=4; Other Race-Including Multi-Racial=5) US armed forces 𝑥5 Served active duty in US armed forces (Yes=1;
No=2)
Born of U.S. 𝑥6 Born of U.S. (Born in 50 US States or Washington, DC=1; Others=2)
Citizenship status 𝑥7 Citizenship status (Citizen by birth or naturalization=1; Not a citizen if the US=2)
Education level 𝑥8 Education level (Less than 9th grade=1; 9-11th grade (Includes 12th grade with no diploma)=2; High school graduate/GED or equivalent=3; Some college or AA degree=4; College graduate or above=5)
Marital status 𝑥9 Marital status (Married=1; Widowed=2;
Divorced=3; Separated=4; Never married=5; Living with partner=6)
Total number of people in family
𝑥10 Total number of people in family (1 People=1; 2 People=2; 3 People=3; 4 People=4; 5 People=5; 6 People=6; 7 or more people in the family=7)
Annual family income
𝑥11 Annual family income ($ 0 to $ 4,999=1; $ 5,000 to $ 9,999=2; $10,000 to $14,999=3; $15,000 to $19,999=4; $20,000 to $24,999=5; $25,000 to $34,999=6; $35,000 to $44,999=7; $45,000 to $54,999=8; $55,000 to $64,999=9; $65,000 to $74,999=10; $20,000 and Over=12; Under $20,000=13; $75,000 to $99,999=14; $100,000 and Over=15) Ever told you have
health risk for diabetes
𝑥12 Ever been told by a doctor or other health
professional that you have health risk for diabetes (Yes=1; No=2)
Smoked 𝑥13 Smoked at least 100 cigarettes in life (Yes=1; No=2) Physical activity 𝑥14 Physically active moderate recreational activities ( Less than 3 days Moderate activities a week=1; More than 3 days Moderate activities a week=2) High cholesterol
level
𝑥15 Doctor told you have High cholesterol level (Yes=1; No=2)
Hypertension status 𝑥16 Hypertension status (High Blood Pressure=1; Borderline Hypertension=2; No=3)
Diet 𝑥17 How healthy is the diet (Excellent=1; Very Good=2;
10
Age (𝒙𝟏), gender (𝒙𝟑), race (𝒙𝟒), served in US armed forces (𝒙𝟓), born of U.S. (𝒙𝟔), citizenship status (𝒙𝟕), education level (𝒙𝟖), marital status (𝒙𝟗), total number of people in family
(𝒙𝟏𝟎) andannual family income (𝒙𝟏𝟏) were selected from demographics data of NHANES. The remaining seven variables are from questionnaire data of NHANES. Due to the use of logistic regression and decision tree both continuous and categorical variables be processed. Therefore, it is not necessary to change the form of these variables.
11
PROCESSING RESEARCH Regression Methods Literature Review
Logistic Regression
There are several papers focusing on the selection of factors for type 2 diabetes or pre-diabetes. In primary care clinical sciences, logistic regression has been used to investigate the factors of diabetes. Bonora et al. (2004) investigated 1,000 random white people of Bruneck, Italy between the ages of 40 to 79 years. They used logistic regression modeling to suggest age, body mass index (BMI), hypertension, dyslipidemia, IFG (Impaired fasting glucose) and IGT (Impaired glucose tolerance) are significant. Meng et al. (2013) compared the three data mining models for predicting diabetes or pre-diabetes using 12 risk factors: logistic regression, artificial neural networks (ANNs) and decision tree. These data total included 1487 participants from two communities in Guangzhou, China. There are twelve variables in logistic regression: age, family history of diabetes, marital status, educational level, work stress, duration of sleep, physical activity, gender, eating fish, drinking coffee, preference for salty food, and BMI. Meng et al. (2013) also used chi-square test to choose the risk factors; the result is same with logistic regression selection but the importance of variables are different.
Borrell et al. (2007) selected 7,231 U.S. adults aged 20 years or older without diabetes and not pregnant. Logistic regression modeling was used to predict the probability of the individuals having undiagnosed diabetes, using the factors were: age, sex, ethnicity, family history of diabetes, self-reported hypertension, hypercholesterolaemia, and periodontal disease. Gray et al. (2010) used the data on 6,186 subjects aged 40-75 years from UK. Age, ethnicity, sex, first-degree family history of diabetes, antihypertensive therapy or history of hypertension, waist circumference, and BMI were included in final logistic regression model. Similar in
12
method, Griffin et al. (2000) based on 1,077 British individuals aged 40-64 years without diabetes. Age, sex, prescribed antihypertensive medication, prescribed steroids, BMI, family history of diabetes, and smoking status were calculated to the diabetes risk score. Schmidt et al. (2005) produced risk functions for detecting incident diabetes on a randomly selected half of the sample using logistic regression models. Factors were considered includes: age, sex, ethnicity, parental history of diabetes, use of medication for hypertension, height, various measures of obesity (waist, weight, BMI, waist-to-hip ratio, each investigated one at a time), systolic blood pressure, fasting glucose, HDL cholesterol, triglycerides, and fasting insulin.
A total of 562 participatesin Kuwait agreed to be tested. These data were entered into a forward logistic regression modeling, some important factors were identified: age, waist circumference, blood pressure medication, sibling with diabetes (Al Khalaf et al, 2010). Al-Lawati et al. (2007) investigated 1,432 subjects without pregnant in Oman. Backward stepwise logistic regression modeling was used to obtain age, waist circumference, BMI, family history of diabetes, hypertension and coefficients of these factors. Based on 1,016 participants aged 55-74 years in the Netherlands, Baan et al. (1999) used stepwise logistic regression to obtain four factors: age, sex, use of antihypertensive medication, obesity (BMI ≥ 30).
Multivariate Logistic Regression
In Statistics, multivariate analysis as a kind of statistical modeling that have 2 or more dependent or outcome variables (Van Belle, 2004), and multivariable analysis as a kind of statistical modeling in which there are multiple independent or response variables (Katz, 2005).
Lindström and Tuomilehto (2003) followed a random population sample of the ages of 35 to 64 years old with no antidiabetic drug treatment. The data from the Nation Population Register
13
Survey (N=4746) in 1987 and the FINRISK Studies Survey (N=4615) in 1992. Multivariate logistic regression modeling coefficient were used to develop a concise model, which assign a score for each of the following variable: age (45-54, 55-64), BMI, waist circumference, use of blood pressure medication, and history of high blood glucose. Gao et al. (2009) indicated that age, sex, BMI, waist circumference, family history of diabetes play the most significant role by applying a multivariate logistic regression modeling. They based on 3,094 Mauritian Indians between the ages of 20 to 65 years without diabetes during 11 years follow up. After a year later, Gao et al. (2010) used two years survey (2002, n=1986) and (2006, n=4336) from Chinese adults between the ages of 20 to 74 years. Age, waist circumference, family history of diabetes were significance predictors in the multivariate logistic regression model. According to 1,032 Egyptian subjects with no diabetes, the multivariate logistic regression equation included age, random plasma glucose, postprandial time, sex, BMI as predictors for undiagnosed diabetes (Tabaei and Herman, 2002). A total of 6,237 individuals in Canary Islands were applied to test the screening programs. The three predictors were: age, waist/height ratio, and family history of diabetes for men. For women, the four predictors were age, waist/height ratio, family history of diabetes, and gestational diabetes (Cabrera de León et al, 2008).
Multiple Logistic Regression and Multivariable Logistic Regression
As early as 1999, Burke, et al (1999) followed participants in the San Antonio Heart Study (SAHS) for 7-8 years. The SAHS predicting model was created by using multiple logistic regression models. They used odds ratios for various factors to identify which factors will develop type-2 diabetes by estimating from these logistic regression models. Age, sex, ethnic group, neighborhood, and date of enrollment were significance predictors of diabetes. Carlsson
14
et al. (2004) tested age, BMI, physical activity and alcohol consumption in the multiple logistic regression model, based on a prospective study of 11 years followed up of the incidence of diabetes in the Nord- Trondelag Health Survey. The result indicated that smoking influences the immune system in human diabetes. In the same way, Waki et al. (2005) investigated 12,913 men and 15,980 women aged 40-59 years old in the Japan Public Health Center-based study on cancer and cardiovascular disease. During 10 years of follow-up, their results show high alcohol consumption was positively associated with the incidence of diabetes in lean Japanese men (BMI≤ 22 kg/𝑚2).
Chen et al. (2010) studied 6,060 Australians in a diabetes obesity and lifestyle study (AUSDIAB). These participants aged 25 years or older and did not have diagnosed diabetes by follow- up after 5 years. The final prediction model included nine factors: age, sex, ethnicity, smoking, parental history of diabetes, history of high blood glucose level, use of antihypertensive medications, physical inactivity and waist circumference. Stern et al. (2002) analyzed 5,158 participants between the ages of 25 to 64 years and not pregnant in San Antonio Heart Study. Multiple logistic regression modeling was used to indicate that age, sex, race, fasting plasma glucose (FPG), systolic blood pressure, HDL cholesterol, BMI, family history of diabetes were considered as factors. From NHANES (National Health and Nutrition Examination Survey), a total of 21,620 in U.S. aged 45 years or older were tested. Bang et al. (2004) used multiple logistic regression to determine age, sex, family history of diabetes, history of hypertension, obesity (BMI or waist circumference), and physical activity as participant characteristics associated with undiagnosed diabetes. Ko et al. (2010) derived 12,448 Hong Kong Chinese without diabetes. Age, sex, BMI, hypertension, dyslipidaemia, family history of diabetes, gestational diabetes were used to calculate the risk score of diabetes in the multiple logistic
15
regression modeling. Among 26,001 subjects who derived from the Chennai Urban Rural Epidemiology Study (CURES) in India, age, waist circumference, physical activity, and family history of diabetes were identified as the four factors as used to develop the Indian Diabetes Risk Score (IDRS) based on multiple logistic regression analysis (Mohan et al, 2005). Ramachandran et al. (2005) tested 10,003 participants aged 20 years or older in India. Age, family history of diabetes, BMI, waist circumference, physical activity were identified as significant factors and applied for multiple logistic regression analysis.
A total of 2,364 Caucasian subjects were studied, who between the ages of 50 to 74 years old, who did not know if they had diabetes. Ruige et al. (1997) pointed out frequent thirst, pain during walking with need to slow down, shortness of breath when walking, age, sex, BMI, obesity (men), family history of diabetes, use of antihypertensive drugs, and reluctance to use bicycle for transportation were significant in backward stepwise multiple logistic regression model. Stepwise multiple logistic regression was applied on the optimal risk score for occurrence of Diabetes Mellitus among Hindustani Surinamese (n=336), African Surinamese (n=593), and Dutch (n=486). Age, BMI, waist circumference, resting heart rate, first-degree relative with diabetes, hypertension, history of CVD, ethnicity were included in the risk score (Bindraban et al, 2008). Glümer et al. (2004) studied in 6,784 individuals between the ages of 30 to 60 years in Denmark. Stepwise backward logistic regression were developed to calculate the diabetes risk score. Age, BMI, sex, known hypertension, physical activity, and family history of diabetes were included in final risk score.
A total of 429 Thai adults without diabetes were derived by stepwise multiple logistic regression to determine the risk equation. Age, BMI, and history of hypertension were significant in model (Keesukphan et al, 2007). Similarly, Pires de Sousa et al. (2009) based in a population
16
of 1,224 subjects aged 35 years or older without known diabetes in Brazilian. They indicated age, BMI, and hypertension were significance factors to classify as type 2 diabetes patients by stepwise backward multiple logistic regression.
Aekplakorn et al. (2006) followed 2, 677 individuals between the ages of 35 to 55 years without diabetes in Thailand during 12 years. Multivariable logistic regression was used to indicate that age, BMI, waist circumference, hypertension, and family history of diabetes were significant predictive variables. The Atherosclerosis Risk in Communities (ARIC) study
recruited 15,792 U.S. adults between the ages of 45 to 64 years as subjects. Schmidt et al. (2005) constructed a multivariable logistic regression modeling to indicate age, waist circumference, height, hypertension, family history of diabetes, ethnicity, HDL cholesterol, triglycerides, and fasting glucose were significant. Chaturvedi et al. (2008) studied in 4,044 individuals between the ages of 35 to 64 years in India. Age, blood pressure, waist circumference, and family history of diabetes were significant with p<0.05 in multivariable logistic regression analysis. Based on 1,549 participants from Rancho Bernardo Study in U.S.A., multivariable logistic regression were performed to indicate sex, age, triglycerides, and fasting plasma glucose as predictors (Kanaya et al, 2005).
Cox Proportional hazards models
According to Perry et al. (1995), there are 7,735 middle aged (40 to 59 years old) British men who were selected at random from 24 towns in England Wales, and Scotland between 1978 and 1980. Cox’s proportional hazards models were used to assess which factors could develop noninsulin dependent diabetes. Seven variables were selected by proportional hazards regression: age, BMI, blood pressure, triglycerides, high density lipoprotein (HDL) cholesterol, heart rate,
17
and uric acid. Kawakami et al. (1997) investigated a cohort of 2,312 male employees who worked at electrical company in Japan. They used analysis to indicate that the age an individual starts smoking and the number of cigarettes smoked per day are two important factors that increase the non-insulin-dependent diabetes mellitus (NIDDM) incidence over 8 years (1984-1992). Sugimori et al. (1998) contained similar methods during a 16 year epidemiologic study with a cohort of 1,851 males and 722 females from Tokyo, Japan. Age, fasting blood glucose (FBS), family history, hypertension, smoking, and body mass index (BMI) were significant factors for diabetes in males, whereas age, FBS, drinking, not eating breakfast, and hypertension were significant factors for diabetes in females. Manson et al. (2000) studied 21,068 American male physicians aged 40 to 84 years over 12 years in the Physicians’ Health Study, who were initially free of diagnosed diabetes mellitus, cardiovascular disease, and cancer. Heir result
indicated cigarette smoking was an independent and modifiable determinant of type 2 diabetes mellitus by using proportional hazards regression models.
Multivariable Cox proportional hazards regression was used to construct a model for predicting the incidence of diabetes over 10 years in Chinese people. Age, elevated fasting
glucose, body mass index, white blood cell count, triacylglycerol, and HDL-cholesterol were
found as predictors to create the model (Chien et al, 2009). Sun et al. (2009) followed 73,961 individuals between the ages of 36 to 74 years over a median 3.15 years in the Taiwan periodic health-check population, and derived risk functions using multivariate Cox regression. Factors eventually included: age, gender, education level, smoking status, BMI, waist circumference, hypertension, high FPG, and HDL cholesterol. Among 19,257 hypertensive patients in Anglo-Scandinavian, Gupta et al. (2008) used multivariable cox proportional hazards regression to indicate the significant of predictors: age, sex, fasting plasma glucose (FPG), BMI, serum
18
triglycerides, HDL cholesterol, alcohol intake, and systolic blood pressure. Schulze et al. (2007) investigated 9,729 men and 15,438 women aged 35-65 years old in Germany. Age, waist
circumference, height, history of hypertension, physical activity, smoking, consumption of red meat, whole-grain bread, coffee, and alcohol were significant in the model. Hipposley-Cox et al, (2009) used a similar model to investigate primary care health records 2,540,753 patients
between the ages of 25 to 79 years from 19 of the Qsearch databases in England. Age, sex, body mass index, smoking status, family history of diabetes, social deprivation, treated hypertension, cardiovascular disease, and current use of corticosteroids were the significant factors. In
Tuomilehto et al.’s (2010) paper, a total 1,429 individuals aged 40-70 years with BMI 25-40 kg/ 𝑚2 were randomly recruited from nine countries (Canada, Germany, Austria, Norway,
Denmark, Sweden, Finland, Israel and Spain). Acarbose treatment, gender, serum triglyceride level, waist circumference, fasting plasma glucose, height, history of cardiovascular disease (CVD) and hypertension were included in multivariable Cox proportional hazards regression model.
Other methods
Based on 46,239 Chinese adults aged 20 years or older, Yang et al. (2010) indicated age (older), sex (male), a family history of diabetes, overweight, obesity, central obesity, increased heart rate, elevated systolic blood pressure, elevated serum triglyceride level, educational level below college, and urban residence were all significantly associated with an increased risk of diabetes by using multivariable multinomial logistic models. In addition, as above, all factors except sex (male) and urban residence were significantly associated with an increased risk of pre-diabetes. Between 1980 to 1996, the Nurses’ Health Study followed 84,941 female nurses
19
who were tested for dietary and lifestyle factors in relation to type 2 diabetes. They got results by using pooled logistic regression; overweight was the single most important predictor of diabetes, though lack of exercise, a poor diet, currently smoking, and abstinence from alcohol were
significant to increase risk of diabetes (Hu et al. 2001). Based on 12, 729 American adults aged 45-64 years, Kahn et al. (2009) demonstrated age (55 years or older), diabetic status of parents, hypertension, race (black), smoking status, waist circumference, rapid pulse, and nonuse of alcohol were significant factors by applying Weibull proportional hazards regression.
For pre-diabetes and undiagnosed diabetes, Heikes et al. (2008) used the data from the Third National Health and Nutrition Examination Survey to build two logistic regression and classification tree analysis models. These two models were used to designate any individuals who have a high risk for ‘undiagnosed diabetes or pre-diabetes’, ‘pre-diabetes’, and ‘neither undiagnosed diabetes or pre-diabetes’. In the estimated coefficients equations of logistic regression, only 8 variables (age, gender, weight, standing height, waist-to-hip ratio, BMI, and high blood pressure) meet the p< 0.05 significance level for entry into the model.
Balkau et al. (2008) investigated 1,863 men and 1,954 women aged 30-65 years old in France, and used logistic regression to test for interactions with sex. The result show the predictors were fasting glucose, waist circumference, smoking, and hypertension for men, whereas fasting glucose, BMI, hypertension, and diabetes in family for women. Kolberg et al. (2009) devised a model development process applying multiple statistical approaches to reduce the number of factors based on six biomarkers (adiponectin, C-reactive protein, ferritin, inter-leukin-2 receptor A, glucose, and insulin) from 6,600 Danes followed over 5 years. Based on 3,140 participants aged 54 years, Wilson et al. (2007) used two modelling methods (Cox proportional hazards model and multivariate logistic regression) to estimate the risk of type 2
20
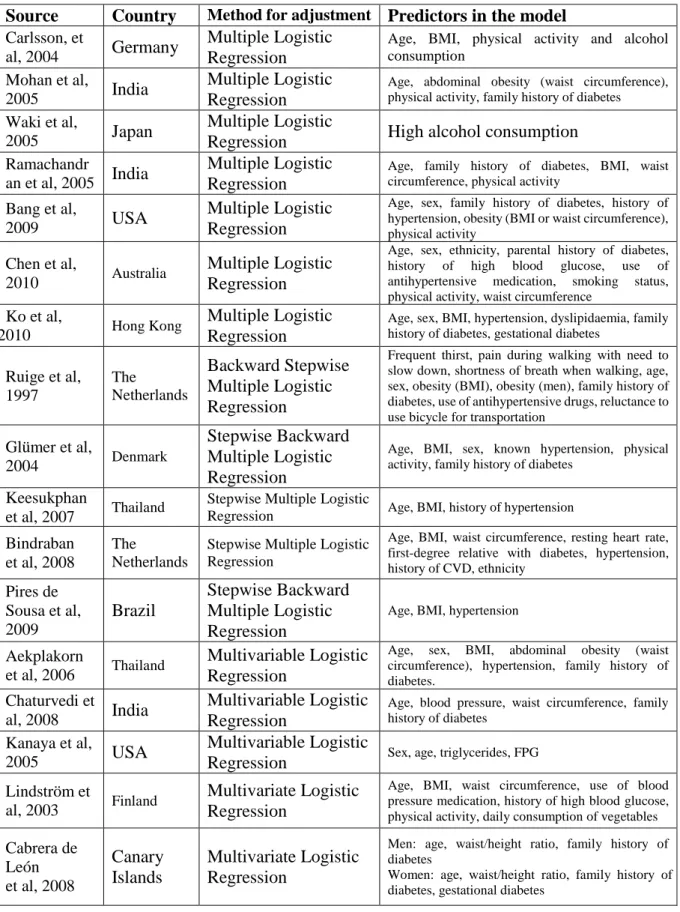
diabetes. The results show parental history of diabetes, BMI, triglycerides, HDL cholesterol, fasting plasma glucose (FPG), and blood pressure were significant association with incidence of diabetes. Furthermore, Xie et al. (2010) used classification and regression tree models based on 15,540 Chinese adults aged 35-74 years. The significant predictors for type 2 diabetes for men were age and waist circumference and for women were age and waist/hip ratio. In addition, Woolthuis et al. (2009) used multiple statistical analysis methods (𝑥2test and logistic regression) to perform and analyze the data based on 49,229 practice population in Netherlands. Among diagnostic models containing various factors, a model containing obesity alone was the best predictor of undiagnosed diabetes. All literature review sources are given below in table 3.
Table 3. Logistic regression for diabetes or pre-diabetes
Source Country Method for adjustment Predictors in the model Griffin et al,
2000 UK Logistic Regression
Sex, prescribed antihypertensive medication, prescribed steroids, age, BMI, family history of diabetes, smoking status
Bonora et al,
2004 Italy Logistic Regression
Age, BMI, Hypertension, Dyslipidemia, IFG (Impaired fasting glucose) and IGT (Impaired glucose tolerance)
Schmidt et
al, 2005 USA Logistic Regression
Age, ethnicity, parental history of diabetes, FPG, systolic blood pressure, waist circumference, height, HDL cholesterol, triglycerides
Borrell et al,
2007 USA Logistic Regression
Age, sex, ethnicity, family history of diabetes, self-reported hypertension, hypercholesterolaemia, periodontal disease
Gray et al,
2010 UK Logistic Regression
Age, ethnicity, sex, first-degree family history of diabetes, antihypertensive therapy or history of hypertension, waist circumference, BMI
Baan et al, 1999 The Netherlands Stepwise Logistic Regression
Age, sex, use of antihypertensive medication, obesity (BMI ≥ 30)
Al Khalaf et
al, 2010 Kuwait
Forward Stepwise Logistic Regression
Age, waist circumference, blood pressure medication, diabetes in sibling
Al-Lawati et
al, 2007 Oman
Backward Stepwise Logistic Regression
Age, waist circumference, BMI, family history of diabetes, hypertension
Burke et al,
1999 USA
Multiple Logistic Regression
Age, sex, ethnic group, neighborhood, and date of enrollment
Stern et al,
2002 USA
Multiple Logistic Regression
Age, sex, ethnicity, FPG, systolic blood pressure, HDL cholesterol, BMI, family history of diabetes
21
Table 3. Logistic regression for diabetes or pre-diabetes (continued)
Source Country Method for adjustment Predictors in the model Carlsson, et
al, 2004 Germany
Multiple Logistic Regression
Age, BMI, physical activity and alcohol consumption
Mohan et al,
2005 India
Multiple Logistic Regression
Age, abdominal obesity (waist circumference), physical activity, family history of diabetes Waki et al,
2005 Japan
Multiple Logistic
Regression High alcohol consumption
Ramachandr
an et al, 2005 India
Multiple Logistic Regression
Age, family history of diabetes, BMI, waist circumference, physical activity
Bang et al,
2009 USA
Multiple Logistic Regression
Age, sex, family history of diabetes, history of hypertension, obesity (BMI or waist circumference), physical activity
Chen et al,
2010 Australia
Multiple Logistic Regression
Age, sex, ethnicity, parental history of diabetes, history of high blood glucose, use of antihypertensive medication, smoking status, physical activity, waist circumference
Ko et al,
2010 Hong Kong
Multiple Logistic Regression
Age, sex, BMI, hypertension, dyslipidaemia, family history of diabetes, gestational diabetes
Ruige et al, 1997 The Netherlands Backward Stepwise Multiple Logistic Regression
Frequent thirst, pain during walking with need to slow down, shortness of breath when walking, age, sex, obesity (BMI), obesity (men), family history of diabetes, use of antihypertensive drugs, reluctance to use bicycle for transportation
Glümer et al,
2004 Denmark
Stepwise Backward Multiple Logistic Regression
Age, BMI, sex, known hypertension, physical activity, family history of diabetes
Keesukphan
et al, 2007 Thailand
Stepwise Multiple Logistic
Regression Age, BMI, history of hypertension Bindraban
et al, 2008
The Netherlands
Stepwise Multiple Logistic Regression
Age, BMI, waist circumference, resting heart rate, first-degree relative with diabetes, hypertension, history of CVD, ethnicity Pires de Sousa et al, 2009 Brazil Stepwise Backward Multiple Logistic Regression
Age, BMI, hypertension Aekplakorn
et al, 2006 Thailand
Multivariable Logistic Regression
Age, sex, BMI, abdominal obesity (waist circumference), hypertension, family history of diabetes.
Chaturvedi et
al, 2008 India
Multivariable Logistic Regression
Age, blood pressure, waist circumference, family history of diabetes
Kanaya et al,
2005 USA
Multivariable Logistic
Regression Sex, age, triglycerides, FPG
Lindström et
al, 2003 Finland
Multivariate Logistic Regression
Age, BMI, waist circumference, use of blood pressure medication, history of high blood glucose, physical activity, daily consumption of vegetables Cabrera de León et al, 2008 Canary Islands Multivariate Logistic Regression
Men: age, waist/height ratio, family history of diabetes
Women: age, waist/height ratio, family history of diabetes, gestational diabetes
22
Table 3. Logistic regression for diabetes or pre-diabetes (continued)
Source Country Method for adjustment Predictors in the model Gao et al,
2010 China
Multivariate Logistic
Regression Age, waist circumference, family history of diabetes
Tabaei and Herman, 2002
Egypt Multivariate Logistic Regression
Age, random plasma glucose, postprandial time, sex, BMI
Perry et al,
1995 UK
Cox Proportional Hazards Regression
Age, BMI, blood pressure, triglycerides, high density lipoprotein (HDL) cholesterol, heart rate, and uric acid
Kawakami et
al, 1997 Japan
Cox Proportional Hazards Regression
Younger age at starting smoking and the number of cigarettes smoked per day
Sugimori et
al, 1998 Japan
Cox Proportional Hazards Regression
Men: Fasting blood glucose (FBS), age, family history, hypertension, smoking, and body mass index (BMI)
Women: not eating breakfast, FBS, age, drinking, and hypertension
Manson, et
al, 2000 USA
Cox Proportional Hazards Regression
Cigarette smoking is an independent and modifiable determinant Schulze et al, 2007 Germany Multivariate Cox Proportional Hazards Regression
Waist circumference, height, age, hypertension, intake of red meat, intake of whole-grain bread, coffee consumption, alcohol consumption, physical activity, former smoker, current heavy smoker (≥ 20 cigarettes/day) Gupta et al, 2008 UK, Ireland, Sweden, Denmark, Iceland, Norway, Finland Multivariate Cox Proportional Hazards Regression
Age, sex, FPG, BMI, randomized group, triglycerides, systolic blood pressure, total cholesterol, use of non-coronary artery disease medication, HDL cholesterol, alcohol intake Chien et al,
2009 Taiwan
Cox Proportional Hazards Regression
Age, BMI, WBC count, and triacylglycerol, HDL cholesterol, FPG levels
Gao et al,
2009 Mauritius
Cox Proportional Hazard Regression
Age, sex, BMI, waist circumference, family history of diabetes
Hippisley-Cox et al, 2009
UK Cox Proportional Hazards Regression
Age, BMI, family history of diabetes, smoking status, treated hypertension, current treatment with corticosteroids, diagnosis of CVD, social deprivation, ethnicity Sun et al, 2009 Taiwan Multivariable Cox Proportional Hazard Regression
Sex, education level, age, current smoking status, BMI, waist circumference, family history of diabetes, hypertension, FPG Tuomilehto et al, 2010 Canada, Germany, Austria, Norway, Denmark, Sweden, Finland, Israel, Spain Multivariable Cox Proportional Hazard Regression
Acarbose treatment, sex, serum triglyceride level, waist circumference, FPG, height, history of CVD, diagnosed hypertension
Kahn et al,
2009 USA
Weibull Proportional Hazard Regression
Diabetic mother, diabetic father, hypertension, ethnicity, age, smoking status, waist circumference (sex), height (sex), resting pulse (sex), weight (sex)
23
Table 3. Logistic regression for diabetes or pre-diabetes (continued)
Source Country Method for adjustment Predictors in the model Balkau et al,
2008 France
Sex-specific Logistic Regression
Men: waist circumference, smoking status, hypertension.
Women: waist circumference, family history of diabetes, hypertension.
Hu et al.
2001 China
Pooled logistic regression
Overweight, lack of exercise, a poor diet, current smoking, and abstinence form alcohol Wilson et al, 2007 USA Cox Proportional Hazards Regression Multivariate Logistic Regression
FPG, BMI, HDL cholesterol, parental history of diabetes, triglyceride level, blood pressure
Heikes et al, 2008 USA Logistic Regression and Classification Tree Analysis
Age, waist circumference, history of gestational diabetes, family history of diabetes, ethnicity, high blood pressure, weight, height, parental diabetes, exercise
Woolthuis et
al, 2009 Netherlands
𝑥2 test and logistic
regression Obesity
Xie et al,
2010 China
Classification and Regression Tree
Men: age, waist circumference Women: age, waist/hip ratio Yang et al,
2010 China
Multivariable, Multinomial, logistic models
Male sex, older age, a family history of diabetes, overweight, obesity, central obesity, increased heart rate, elevated systolic blood pressure, elevated serum triglyceride level, educational level below college, and urban residence
Meng et al,
2013 China
Logistic Regression, Artificial Neural Networks (ANNs) and Decision Tree
Age, family history of diabetes, marital status, educational level, work stress, duration of sleep, physical activity, preference for salty food, gender, eating fish, drinking coffee, and body mass index
Kolberg et
al, 2009 Denmark
U (univariate logistic regression analyses),
E (exhaustive enumeration of small multivariate logistic models),
H (six different heuristic model-building methods, including forward, backward, and stepwise selection, Kruskal-Wallis, random forest, and Eigengene-based linear discriminant analysis with three different statistical learning algorithms, including logistic regression, linear discriminant analysis, and support vector machines), and
B (frequency of selection within 100 bootstrap replicates using the same basic heuristic model-building methods)
Adiponectin, C-reactive protein, ferritin, interleukin 2 receptor A, glucose, insulin
24
Decision Tree Literature Review
Decision tree-ID3, C4.5, and C5.0 Algorithm
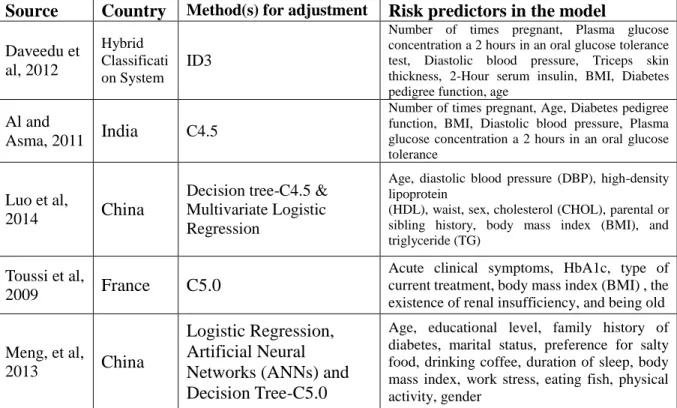
The Fuzzy ID3 (Iterative Dichotomiser 3) algorithm as a precursor to the C4.5 is used by training on a dataset to produce a decision tree. Daveedu et al. (2012) indicated that a total of eight variables were used to obtain decision tree for individual clusters:age, BMI, number of times pregnant, plasma glucose concentration after 2 hours in an oral glucose tolerance test, diastolic blood pressure, triceps skin thickness, 2-hour serum insulin, and diabetes pedigree function.
According to the Indian diabetes dataset, Al and Asma (2011) used C4.5 in Waikato Environment for Knowledge Analysis (Weka) software. Age, diabetes pedigree function, BMI, 2-hour serum insulin, triceps skin fold thickness, diastolic blood pressure, plasma glucose concentration after 2 hours in an oral glucose tolerance test, and number of times pregnant were considered as predictors. They gave negative (non-diabetic) and positive (diabetic) as decision results, and the accuracy of the result was 78.18%. Luo et al. (2014) used C4.5 and multivariate logistic regression to selected variables from the data of 16,246 individuals aged 20 and older in Beijing, China. Combining the result of these two methods, nine factors were selected: age, diastolic blood pressure (DBP), high-density lipoprotein (HDL), waist, sex, cholesterol (CHOL), parental or sibling history, body mass index (BMI), and triglyceride (TG).
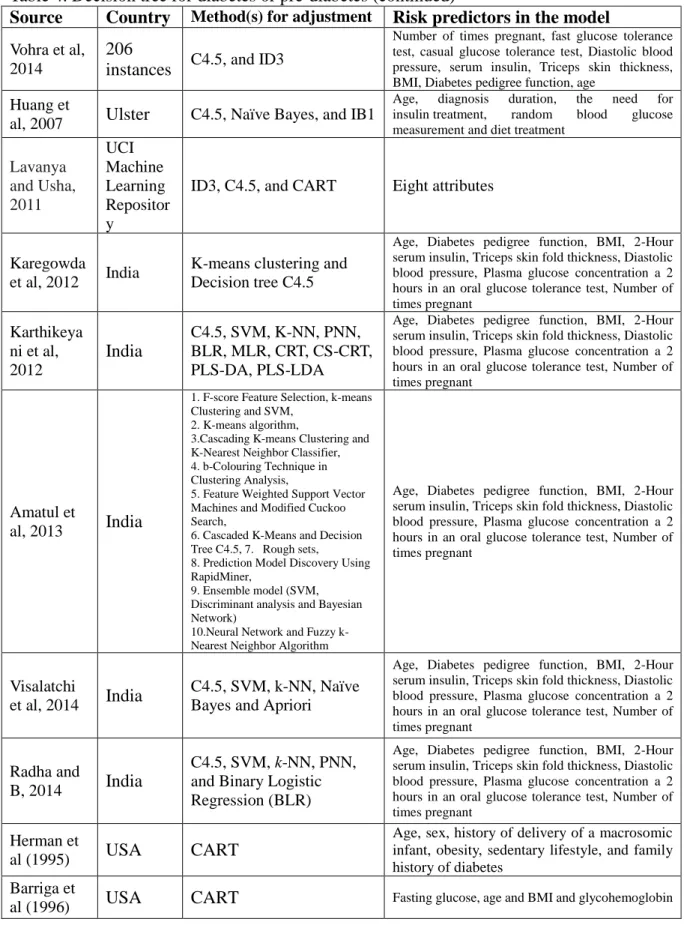
In a research paper presented by Vohra and Anshul (2014). A total of 206 individuals were collected from hospital records, the analyzed nine variables: age, number of times pregnant, fast glucose tolerance test, casual glucose tolerance test, diastolic blood pressure, serum insulin, triceps skin thickness, BMI, and diabetes pedigree function. They tested C4.5 and ID3 to determine which was more accurate to predict three levels (normal, pre-diabetes, and diabetes).
25
Comparing three data mining algorithm techniques (C4.5, Naïve Bayes, and IB1), Huang et al (2007) identified five predictors (age, diagnosis duration, insulin treatment, random blood glucose measurement, and diet treatment) as important factors for Ulster diabetes. Three popular decision tree algorithms (ID3, C4.5, and CART) were compared in the research paper presented by Lavanya and Usha (2011). Using data collected from the UCI Machine Learning Repository, they analyzed eight attributes for diabetes classifiers. The CART showed the best accuracy (99.45%) relative to C4.5 (96.24%) and ID3 (84.52%).
Based on Pima Indian Diabetes Dataset (PIDD), there are several studies comparing various data mining techniques. They all used on eight variables as factors: age, diabetes pedigree function, BMI, 2-Hour serum insulin, triceps skin fold thickness, diastolic blood pressure, plasma glucose concentration after 2 hours in an oral glucose tolerance test, and number of times pregnant. Karthikeyani et al, (2012) compared ten data mining algorithm methods: 1. C4.5; 2. Support vector machines (SVM); 3. K-nearest neighbor (K-NN); 4.Prototype nearest neighbor (PNN); 5. Binary Logistic Regression (BLR); 6. Multinomial logistic regression (MLR); 7. Classification and Regression Trees (CRT); 8. Chi-Square Classification and Regression Trees (CS-CRT); 9. Partial Least Square Discriminant Analysis (PLS-DA); 10. Partial Least squares-Linear Discriminant Analysis (PLS-LDA). Of these, C4.5, CRT, and CS-CRT were accepted as decision tree algorithms. Amatul et al. (2013) also compared ten algorithms in study, C4.5 and CS-CRT have the most accurate (86%). Total 768 patients were selected in same dataset, ten techniques: 1.F-score Feature Selection, k-means Clustering and SVM; 2. K-means algorithm; 3.Cascading K-means Clustering and K-Nearest Neighbor
Classifier; 4. b-Colouring Technique in Clustering Analysis; 5. Feature Weighted Support Vector Machines and Modified Cuckoo Search; 6. Cascaded K-Means and Decision Tree C4.5;
26
7. Rough sets; 8. Prediction Model Discovery Using Rapid Miner; 9. Ensemble model (SVM, Discriminant analysis and Bayesian Network); 10. Neural Network and Fuzzy k-Nearest Neighbor Algorithm were applied to test the accuracy of the prediction.
Based on the same database and same factors, Visalatchi et al. (2014) compared five data mining algorithm methods, the most accurate was C4.5 (86%). Radha and B (2014) used Pima Indian Diabetes Dataset and Indian Council of Medical Research–Indian Diabetes (ICMR-INDIAB) study to compare five data mining methods: C4.5, SVM, k-NN, PNN, and Binary Logistic Regression (BLR). Karthikeyani et al. (2012) also compared C4.5, SVM, k-NN, PNN, Binary Logistic Regression (BLR), MLR, CRT, CS-CRT, PLS-DA, AND PLS-LDA by using the same eight variables. Similarly, Karegowda et al. (2012) make a hybrid model by using K-means clustering and decision tree C4.5 from the same database and same eight factors. The
classification accuracy could be 93.33%.
C5.0 as an improved version of the C4.5 and ID3 algorithm was used by Toussi et al. (2009). They analyzed six variables (acute clinical symptoms, HbA1c, type of current treatment, body mass index (BMI), the existence of renal insufficiency, and being old (yes or no)) to
explore who have the risk of diabetes. Meng et al. (2013) compared three data mining algorithms (logistic regression, artificial neural networks (ANNs) and decision tree-C5.0), according to twelve importance variables from the most to the least (age, educational level, family history of diabetes, marital status, preference for salty food, drinking coffee, duration of sleep, body mass index, work stress, eating fish, physical activity and gender), between these thee algorithms C5.0 was the best predictor and achieved a classification accuracy of 77.87%.
27
Decision tree-Classification and Regression Trees (CART)
As early as in the 1990s, Barriga et al. (1996) used classification and regression tree (CART) to screen for impaired glucose tolerance and previously undiagnosed diabetes. Based on 583 Hispanic and 768 Non-Hispanic white observations, four variables (age, BMI, fasting glucose, and glycohemoglobin) were found to be the significant factors for identifying the different levels of diabetics. In a research paper presented by Herman et al. (1995), there were six total risk variables (age, sex, history of delivery of a macrosomic infant, obesity, sedentary lifestyle, and family history of diabetes) used indicators in CART models. CART was developed to identify individual who have a high risk for previously undiagnosed diabetes.
Breault et al. (2002) examined 30, 383 diabetes patients in New Orleans by using CART. In CART 4.0 version, HgbA1c >9.5 (0, 1) as target with ten predictors: age, sex, emergency department visits (ER), office visits (OV), comorbidity index (CMI), dyslipidemia, hypertension (HTN), cardiovascular disease (CV), retinopathy, and end-stage renal disease (ESRD). Miyaki et al. (2002) indicated CART was used to identify patients by two factors: macroangiopathy and microangiopathy. In the classification tree of macroangiopathy, five predictors were found: systolic blood pressure (BPSYS), triglyceride (TG), blood glucose (GLU), low density
lipoprotein (LDL) and free fatty acid (FFA) at p<0.02 significance level. On the other hand, for microangiopathy group, there were five predictors that were significant at p<0.02: morbidity term, body mass index, high density lipoprotein (HDL), hemoglobin Alc (HBA1C), and blood glucose (GLU). Kavitha and Sarojamma (2012) developed a diabetes diagnostic system based on the CART method. Patients could login to the system and input their informations to check the status of diabetes. Age, fasting plasma glucose level (FPG), BMI, oral glucose tolerance test (OGTT), and A1c were five significant predictors in decision tree modeling.
28
In four common variables (age, waist-hip ratio (WHR), waist circumference (WC), and BMI) from Chinese adults between the ages of 35-74 years, Xie et al. (2010) separated men and women in different groups. For women, WHR and age as predictors were selected by CART, and for men, WC and age were selected to identify the diabetes risk levels. Sankaranaratanan and T (2014) used the dataset of 768 participants in UCL Machine Learning Repository which
contained eight attributes. However, age, gender, and level value of glycated hemoglobin (HbA1C) were used to contribute the decision tree algorithm CART. Mochan and Ebell (2009) developed a risk assessment tool (CART and logistic regression) for detecting undiagnosed diabetes based on the study paper presented by Heikes et al (2008).
Decision tree-other methods
In the Tehran lipid and glucose study (TLGS) database a total of 6,647 individuals aged older than 20 years were followed over 12 years. Classification by the decision tree was used to create a prediction model for identify the incidence of type 2 diabetes (Ramezankhani et al, 2014). In a research paper presented by Xin et al (2010), logistic regression and classification tree analysis were used to build a model to identify those who have a high risk of type 2 diabetes (T2DM) or pre-diabetes (PDM). In the classification tree analysis, waist-hip ratio (WHR), waist, hypertension, age and weight were found to be predictors in this model for detecting
undiagnosed T2DM. Age, hypertension, waist-hip ratio (WHR), family history of diabetes and waist were found to be predictors in this model for detecting PDM and undiagnosed T2DM.
According to Taiwan’s National Health Insurance system, Liou et al (2008) applied three data mining techniques (logistic regression, neural network, and classification tree model) and compared their accuracy. Classification tree algorithm showed the best accuracy (99%),
29
following by logistic regression (92%) and neural network (95%). Average days of
drug dispensed, average medical expenditure per day, average dispensing service fees, average diagnosis fees, average drug cost per patient, average drug cost per patient per day, and average consultation and treatment were used to create the classification tree model.
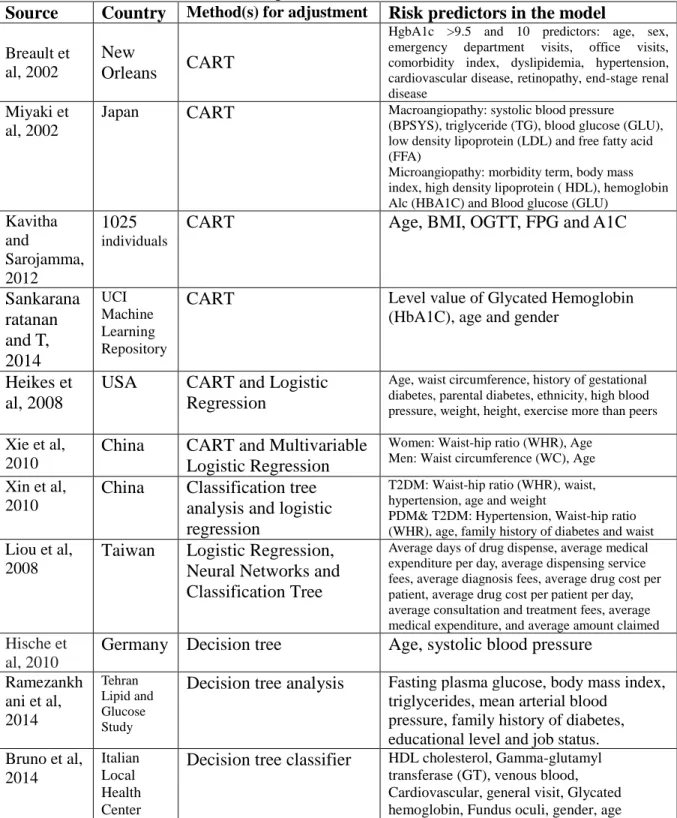
Hische et al. (2010) analyzed metabolic syndrome from Berlin Potsdam Study (Mesy-Bepo) cohort and Dresden cohort by using a decision tree. Age and systolic blood pressure were used as the factors to build the decision tree. Bruno et al. (2014) adopted a decision tree to create a decision tree classifier, and they analyzed the dataset from Italian local health centers. Age, gender and some examination information (i.e. HDL cholesterol, gamma-glutamyl transferase (GT), venous blood, cardiovascular, general visit, glycated hemoglobin, and fundus oculi) were considered as nodes of the decision tree. The accuracy value was 98.6% by using the multiple level clustering strategy. Table 4 lists all literature review sources of decision tree modeling.
Table 4. Decision tree for diabetes or pre-diabetes
Source Country Method(s) for adjustment Risk predictors in the model Daveedu et al, 2012 Hybrid Classificati on System ID3
Number of times pregnant, Plasma glucose concentration a 2 hours in an oral glucose tolerance test, Diastolic blood pressure, Triceps skin thickness, 2-Hour serum insulin, BMI, Diabetes pedigree function, age
Al and
Asma, 2011 India C4.5
Number of times pregnant, Age, Diabetes pedigree function, BMI, Diastolic blood pressure, Plasma glucose concentration a 2 hours in an oral glucose tolerance
Luo et al,
2014 China
Decision tree-C4.5 & Multivariate Logistic Regression
Age, diastolic blood pressure (DBP), high-density lipoprotein
(HDL), waist, sex, cholesterol (CHOL), parental or sibling history, body mass index (BMI), and triglyceride (TG)
Toussi et al,
2009 France C5.0
Acute clinical symptoms, HbA1c, type of current treatment, body mass index (BMI) , the existence of renal insufficiency, and being old Meng, et al,
2013 China
Logistic Regression, Artificial Neural Networks (ANNs) and Decision Tree-C5.0
Age, educational level, family history of diabetes, marital status, preference for salty food, drinking coffee, duration of sleep, body mass index, work stress, eating fish, physical activity, gender
30
Table 4. Decision tree for diabetes or pre-diabetes (continued)
Source Country Method(s) for adjustment Risk predictors in the model Vohra et al,
2014
206
instances C4.5, and ID3
Number of times pregnant, fast glucose tolerance test, casual glucose tolerance test, Diastolic blood pressure, serum insulin, Triceps skin thickness, BMI, Diabetes pedigree function, age
Huang et
al, 2007 Ulster C4.5, Naïve Bayes, and IB1
Age, diagnosis duration, the need for insulin treatment, random blood glucose measurement and diet treatment
Lavanya and Usha, 2011 UCI Machine Learning Repositor y
ID3, C4.5, and CART Eight attributes
Karegowda et al, 2012 India
K-means clustering and Decision tree C4.5
Age, Diabetes pedigree function, BMI, 2-Hour serum insulin, Triceps skin fold thickness, Diastolic blood pressure, Plasma glucose concentration a 2 hours in an oral glucose tolerance test, Number of times pregnant Karthikeya ni et al, 2012 India C4.5, SVM, K-NN, PNN, BLR, MLR, CRT, CS-CRT, PLS-DA, PLS-LDA
Age, Diabetes pedigree function, BMI, 2-Hour serum insulin, Triceps skin fold thickness, Diastolic blood pressure, Plasma glucose concentration a 2 hours in an oral glucose tolerance test, Number of times pregnant
Amatul et
al, 2013 India
1. F-score Feature Selection, k-means Clustering and SVM,
2. K-means algorithm,
3.Cascading K-means Clustering and K-Nearest Neighbor Classifier, 4. b-Colouring Technique in Clustering Analysis,
5. Feature Weighted Support Vector Machines and Modified Cuckoo Search,
6. Cascaded K-Means and Decision Tree C4.5, 7. Rough sets, 8. Prediction Model Discovery Using RapidMiner,
9. Ensemble model (SVM, Discriminant analysis and Bayesian Network)
10.Neural Network and Fuzzy k-Nearest Neighbor Algorithm
Age, Diabetes pedigree function, BMI, 2-Hour serum insulin, Triceps skin fold thickness, Diastolic blood pressure, Plasma glucose concentration a 2 hours in an oral glucose tolerance test, Number of times pregnant
Visalatchi
et al, 2014 India
C4.5, SVM, k-NN, Naïve Bayes and Apriori
Age, Diabetes pedigree function, BMI, 2-Hour serum insulin, Triceps skin fold thickness, Diastolic blood pressure, Plasma glucose concentration a 2 hours in an oral glucose tolerance test, Number of times pregnant
Radha and
B, 2014 India
C4.5, SVM, k-NN, PNN, and Binary Logistic Regression (BLR)
Age, Diabetes pedigree function, BMI, 2-Hour serum insulin, Triceps skin fold thickness, Diastolic blood pressure, Plasma glucose concentration a 2 hours in an oral glucose tolerance test, Number of times pregnant
Herman et
al (1995) USA CART
Age, sex, history of delivery of a macrosomic infant, obesity, sedentary lifestyle, and family history of diabetes
Barriga et
31
Table 4. Decision tree for diabetes or pre-diabetes (continued)
Source Country Method(s) for adjustment Risk predictors in the model Breault et
al, 2002
New
Orleans CART
HgbA1c >9.5 and 10 predictors: age, sex, emergency department visits, office visits, comorbidity index, dyslipidemia, hypertension, cardiovascular disease, retinopathy, end-stage renal disease
Miyaki et al, 2002
Japan CART Macroangiopathy: systolic blood pressure (BPSYS), triglyceride (TG), blood glucose (GLU), low density lipoprotein (LDL) and free fatty acid (FFA)
Microangiopathy: morbidity term, body mass index, high density lipoprotein ( HDL), hemoglobin Alc (HBA1C) and Blood glucose (GLU)
Kavitha and Sarojamma, 2012 1025 individuals
CART Age, BMI, OGTT, FPG and A1C
Sankarana ratanan and T, 2014 UCI Machine Learning Repository
CART Level value of Glycated Hemoglobin
(HbA1C), age and gender
Heikes et al, 2008
USA CART and Logistic Regression
Age, waist circumference, history of gestational diabetes, parental diabetes, ethnicity, high blood pressure, weight, height, exercise more than peers Xie et al,
2010
China CART and Multivariable Logistic Regression
Women: Waist-hip ratio (WHR), Age Men: Waist circumference (WC), Age Xin et al,
2010
China Classification tree analysis and logistic regression
T2DM: Waist-hip ratio (WHR), waist, hypertension, age and weight
PDM& T2DM: Hypertension, Waist-hip ratio (WHR), age, family history of diabetes and waist Liou et al,
2008
Taiwan Logistic Regression, Neural Networks and Classification Tree
Average days of drug dispense, average medical expenditure per day, average dispensing service fees, average diagnosis fees, average drug cost per patient, average drug cost per patient per day, average consultation and treatment fees, average medical expenditure, and average amount claimed Hische et
al, 2010
Germany Decision tree Age, systolic blood pressure
Ramezankh ani et al, 2014 Tehran Lipid and Glucose Study
Decision tree analysis Fasting plasma glucose, body mass index, triglycerides, mean arterial blood
pressure, family history of diabetes, educational level and job status. Bruno et al, 2014 Italian Local Health Center
Decision tree classifier HDL cholesterol, Gamma-glutamyl transferase (GT), venous blood, Cardiovascular, general visit, Glycated hemoglobin, Fundus oculi, gender, age
32
PREDICTION MODELS
A special emphasis has been placed on the assessment of individuals’ risk of diabetes or pre-diabetes. As previously described, statistical analyses was performed in SAS version 9.4 Statistics for chi-square test and logistic regression. For decision tree analysis and comparison of the prediction models, SAS Enterprise Miner Version 13.1 was used.
Logistic Regression Analysis
This aim at compared the performance of the different prediction methods for type 2 diabetes. Logistic regression can be applied to predict the probability of an event in subjects at risk of pre-diabetes. One tool was developed using the logistic regression model to identify individuals who have pre-diabetes as follows:
Logit (p) = ln(1−pp )=𝛽0+𝛽1𝑥1+⋯ ⋯+𝛽𝑖𝑥𝑖 (1)
Where p is the probability in individual has pre-diabetes, X (𝑥1, ⋯ 𝑥𝑖) are the
dichotomous explanatory variables, 𝛽0 is constant, and 𝛽1to 𝛽𝑖 are the vector of regression
coefficients corresponding to X. The term 1−pp is known as the odds of the people who have
pre-diabetes. The probability can be rewritten as
P=[1 + e^(−(𝛽0+ 𝛽1𝑥1+ ⋯ ⋯ + 𝛽𝑖𝑥𝑖 ))]−1 (2) In the logistic regression analysis, the odds of risk is usually used to predict the
probability of the risk. As mentioned in part 3, there are many useful regression models used to predict diabetes or pre-diabetes. Logistic regression models and Cox Proportional hazards models could be simple or multivariable models. The function of Cox Proportional hazards model is as follows: