ФАКУЛТЕТ ЗА ИНФОРМАТИКА
GOCE DELCEV UNIVERSITY – STIP
FACULTY OF COMPUTER SCIENCE
ГОДИНА 3
ЈУНИ, 2015
VOLUME III
ГОДИШЕН ЗБОРНИК
2014
YEARBOOK
2014
ГОДИШЕН ЗБОРНИК
ФАКУЛТЕТ ЗА ИНФОРМАТИКА
YEARBOOK
FACULTY OF COMPUTER SCIENCE
Издавачки совет
Проф. д-р Саша Митрев
Проф. д-р Лилјана Колева - Гудева
Проф. д-р
Владо Гичев
Проф. д-р Цвета Mартиновска
Проф. д-р Татајана Атанасова - Пачемска
Доц. д-р Зоран Здравев
Доц. д-р Александра Милева
Доц. д-р Сашо Коцески
Доц. д-р Наташа Коцеска
Доц. д-р Зоран Утковски
Доц. д-р Игор Стојановиќ
Доц. д-р Благој Делипетров
Редакциски одбор
Проф. д-р Цвета Mартиновска
Проф. д-р Татајана Атанасова - Пачемска
Доц. д-р Наташа Коцеска
Доц. д-р Зоран Утковски
Доц. д-р Игор Стојановиќ
Доц. д-р Александра Милева
Доц. д-р Зоран Здравев
Главен и одговорен уредник
Доц. д-р Зоран Здравев
Јазично уредување
Даница Гавриловаска - Атанасовска
(македонски јазик)
Павлинка Павлова-Митева
(англиски јазик)
Техничко уредување
Славе Димитров
Благој Михов
Редакција и администрација Универзитет ,,Гоце Делчев“-Штип Факултет за информатика ул. ,,Крсте Мисирков“ 10-A п. фах 201, 2000 Штип Р. МакедонијаEditorial board
Prof. Saša Mitrev, Ph.D
Prof. Liljana Koleva - Gudeva, Ph.D.
Prof. Vlado Gicev, Ph.D.
Prof. Cveta Martinovska, Ph.D.
Prof. Tatjana Atanasova - Pacemska, Ph.D.
Ass. Prof. Zoran Zdravev, Ph.D.
Ass. Prof. Aleksandra Mileva, Ph.D.
Ass. Prof. Saso Koceski, Ph.D.
Ass. Prof. Natasa Koceska, Ph.D.
Ass. Prof. Zoran Utkovski, Ph.D.
Ass. Prof. Igor Stojanovik, Ph.D.
Ass. Prof. Blagoj Delipetrov, Ph.D.
Editorial staff
Prof. Cveta Martinovska, Ph.D.
Prof. Tatjana Atanasova - Pacemska, Ph.D.
Ass. Prof. Natasa Koceska, Ph.D.
Ass. Prof. Zoran Utkovski, Ph.D.
Ass. Prof. Igor Stojanovik, Ph.D.
Ass. Prof. Aleksandra Mileva, Ph.D.
Ass. Prof. Zoran Zdravev, Ph.D.
Managing/ Editor in chief
Ass. Prof. Zoran Zdravev, Ph.D.
Language editor
Danica Gavrilovska-Atanasovska
(macedonian language)
Pavlinka Pavlova-Miteva
(english language)
Technical editor
Slave Dimitrov
Blagoj Mihov
Address of the editorial office Goce Delcev University – Stip
Faculty of Computer Science
Krste Misirkov 10-A PO box 201, 2000 Štip, R. of Macedonia
За издавачот:
Проф д-р Владо Гичев
СОДРЖИНА
CONTENT
АНАЛИЗА НА ТОЧНОСТА НА МЕТОДОТ НА CRANK-NICOLSON ВО
ЗАВИСНОСТ ОД ПАРАМЕТАРОТ НА МЕТОДОТ r
Весна Гунова, Владо Гичев ...5
MULTIMEDIA TECHNOLOGIES IN ENGINEERING EDUCATION
D.Minkovska, L.Stoyanova ...15
МОДЕЛ НА ПРИФАЌАЊЕ И УПОТРЕБА НА РЕПОЗИТОРИУМОТ НАМЕНЕТ
ЗА НАСТАВНИЧКИОТ КАДАР НА УНИВЕРЗИТЕТОТ „ГОЦЕ ДЕЛЧЕВ“ – ШТИП
Мирјана Коцалева , Игор Стојановиќ , Зоран Здравев ...21
РЕШАВАЊЕ НА ТОПЛИНСКА РАВЕНКА СО NEUMANN ГРАНИЧНИ УСЛОВИ
СО УПОТРЕБА НА CRANK NICOLSON МЕТОДОТ
Мирјана Коцалева , Владо Гичев ...33
ГОЛЕМИ ПОДАТОЦИ ЗА ЕДИКАТИВНО ПОДАТОЧНО РУДАРЕЊЕ,
АНАЛИТИКА НА ПОДАТОЦИ И ВЕБ РАБОТНИ ТАБЛИ
Зоран Милевски, Елена Гелова, Зоран Здравев ...39
АЛАТКИ ЗА ВИЗУАЛИЗАЦИЈА НА СОФТВЕР
Александра Стојанова, Наташа Стојковиќ, Душан Биков ...47
VALUATION OF FACTORS AFFECTING THE UNEMPLOYMENT RATE OF YOUNG
PEOPLE IN REPUBLIC OF MACEDONIA
Tatjana Atanasova Pacemska1, Elena Mitreva ...56
NUMERICAL ANALYSIS OF BEHAVIOR FOR LORENZ SYSTEM
WITH MATHEMATICA
Biljana Zlatanovska ...63
ДИГИТАЛЕН ВОДЕН ЖИГ ВО СЛИКА ВО ФРЕКВЕНТЕН ДОМЕН СО
ДИСКРЕТНА КОСИНУСНА ТРАНСФОРМАЦИЈА
Ана Љуботенска, Александра Милева ...73
COMPARING OF THE BINOMIAL MODEL AND THE BLACK-SCHOLES MODEL
FOR OPTIONS PRICING
АЛАТКИ ЗА ВИЗУАЛИЗАЦИЈА НА СОФТВЕР
Александра Стојанова1, Наташа Стојковиќ1, Душан Биков11Факултет за информатика, Универзитет „Гоце Делчев“, Штип (aleksandra.stojanova, natasa.maksimova, dusan.bikov)@ugd.edu.mk
Апстракт.Визуализацијата на софтверот претставува еден вид компјутерска уметност, а истовремено и наука за генерирање на визуелни претстави на различни аспекти на софтверот и неговиот процес на развој. Постојат многу алатки кои го овозможуваат визуализирањето на софтвер, но ние се задржуваме на некои од нив.Во овој труд ќе бидат разработени точно четири алатки за визуализација на софтвер, и тоа: Jeliot 3, SRec, jGrasp и DDD. Ќе бидат разгледани и анализирани визуализациите кои тие ги произведуваат, а истовремено ќе бидат нагласени местата кадешто тие можат да помогнат. Исто така, ќе бидат нагласени предностите и недостатоците на овие алатки кои ги забележавме при нивното разработувањеи нивната употреба.
Клучни зборови: статичка визуализација, динамичка визуализација, програмска визуализација, анимација
TOOLS FOR SOFTWARE VISUALIZATION
Aleksandra Stojanova1, Natasha Stojkovikj1, Dusan Bikov1
Faculty of computer science, Goce Delcev University, Stip, Macedonia (aleksandra.stojanova, natasa.maksimova, dusan.bikov)@ugd.edu.mk
Abstract: Software visualization is a kind of computer art, and in the same time is a science for generating visual representations of different software aspects and of software development process. There are many tools that allow software visualization but we are focusing on some of them. In this paper will be examined in details just four tools: Jeliot 3, SRec, jGrasp and DDD. Visualizations that they produce will be reviewed and analyzed and will be mentioned possible places for their application. Also, will be discussed their advantages and disadvantages that we noticed during their work and examination.
Kew words: static visualization, dynamic visualization, program visualization, animation.
1.
Introduction
The software itself is something intangible and invisible and its understanding, research and creation can be difficult. The goal of software visualization is not to produce accurate computer images, but computer images that can cause images in user’s mind which can help process of software understanding.
Today there are many different tools for software visualization. Even today's development environments for programming languages increasingly include visual elements in programming in order to get closer to the user and leave traditional programming, which use only pure code.
In this paper, we will focus on visualization of software, especially on tools that are used for educational purposes [6] [7], which explain the way in which certain programs and program segments work.
We are examining in detail four tools: DDD [1] [4] [5] [14], JGrasp [9] [10] [15], SRec [3] [8] [16] and Jeliot 3 [2] [11] [12] [17].
Most of today’s freely available tools for software visualization are based on Java programming language. Three from our chosen tools JGrasp, SRec and Jeliot, are based on Java and only DDD is working with programs written in C or C++ programming language.
The reason for choosing these tools is that they have integrated more of the features used in existing tools. They accurately and precisely represent and visualize parts of the program they are intended for. Another reason why we chose these tools is that the user has the opportunity to use pure Java or C code, without any need for translating into another programming language or inserting elements into the code in order to get the desired visualization. Another advantage of these tools over existing ones for this purpose is that they don’t work only with certain already predefined code, but offer the users opportunity for writing their own code and watching the results from its visualization.
2.
Analyzed tools for software visualization
2.1 Jeliot 3
Jeliot 3 is a Program Visualization application. It visualizes how a Java program is interpreted. Method calls, variables, operation are displayed on a screen as the animation goes on, allowing the user to follow step by step the execution of a program. Programs can be created from scratch or they can be modified from previously stored code examples. The Java program being animated does not need any kind of additional calls; all the visualization is automatically generated. Jeliot 3 understands most of the Java constructs and it is able to animate them. This tool has successfully performed the displaying of object-oriented concepts, visualizing objects and inheritance [11].
The main feature of Jeliot 3 is fully or semi automatic visualization of the data and control flows. So there is no need of adding additional code or using special elements to obtain visualization. The user uses pure Java code and automatically gets visualizations from the written program.
The main advantages of this tool are:
- The system is easy to use and is extensible.
- The visualizations produced by the system are consistent with the visualization in all cases and are complete and continuous.
This tool also offers static visualization of program’s code. Static visualization is consisted of emphasizing key words (a method called “pretty printing”) and numbering each line of code for easily finding potential errors.
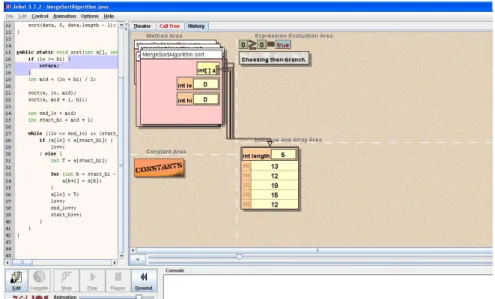
User interface of Jeliot 3 and part of static and dynamic visualization of program illustrating merge-sort is given in Figure 1. This tool allows two different views during dynamic visualization: theatre view and call tree view.
Figure 1. Part of static and dynamic visualization of program illustrating merge-sort produced by Jeliot 3. All visualizing components in dynamic visualization have their own area in the theatre view. There are four areas: Method Area, Expression Evaluation Area, Constant Area and Instance and Array Area.
Visualizations are formed as close as possible to the Java Language Specification. All the visualized material is coherent and complete in a sense that none of the visualized elements appear from nowhere, but each of the elements has its own place to appear. In addition, all the expressions and their sub expressions are
evaluated and all the values shown so that user doesn’t need to guess where each value is coming from.
Furthermore, the visualization and program code is linked with the code highlighting so that cause and effect could be identified [2].
For object-oriented program visualization, notation similar to UML diagrams is used. The objects are shown as boxes that contain attributes and their values. The references are shown as lines connecting the object with the corresponding variable, allowing the object to have several references at any moment.
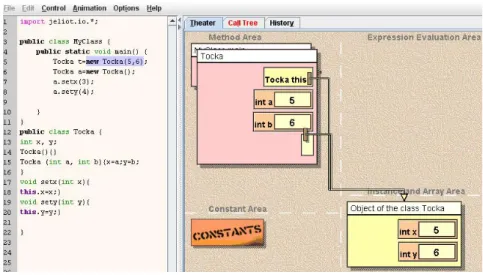
Figure 2.Part of static and dynamic visualization of simple object oriented program with Jeliot 3. In Figure 2 a part of static and dynamic visualization of simple class Tocka with two constructors is presented. One object from class Tocka is displayed and its connection with the class can be clearly seen.
All object oriented concepts like: inheritance, polymorphism and encapsulation can be displayed with this tool.
In Call Tree view all method calls which are currently running are displayed in the form of a tree. Example of Call Tree view for the same program Tocka are presented in Figure 3.
Figure 3. Part of Call Tree visualization with Jeliot 3.
Jeliot 3 is more usable when working with simple and small programs or program segments, which can be analyzed in details, and their way of work can be easily understood. This tool can help understanding basic
program’s concepts and it can be especially useful for novices in programming. For larger programs, program
running can last very long time, so user can lose his interest while waiting the whole program to end. Another disadvantage of this tool is that some features in Java are not yet implemented here.
Jeliot 3 can be easily found on the web and download and its installation is very simple, which makes tool easy to use especially in initial programming courses. User interaction with Jeliot 3 consists of ability to edit the code at any time and be able to notice any change occurring while running the animation.
2.2 SRec
SRec is an animation system, which is specifically designed for visualization of recursion in algorithms implemented in Java. It supports three visualizations of recursion, or three views: trace view, control stack view, and recursion tree view. SRec supports automatic generation and modification of animations [16].
In the last version of SRec there are three additional visualizations specially designed for “divide and conquer” algorithms. The present system is able to simultaneously display two different views in order to allow better examination of program visualization.
This tool is specially designed for visualizing recursion as a programming technique that is most difficult to be understood by beginners in programming.
For programs and program segments that don’t contain recursive calls, this tool is not very useful. Different views that offers, gives users detailed presentation where they can monitor the execution of the recursive call step by step [3].
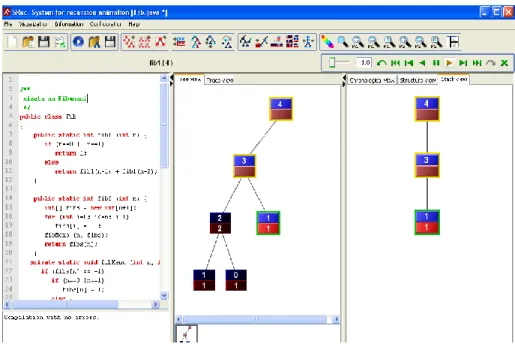
Programming code that is visualized can be easily modified and edited which means that there is a good user interaction with the program. All programs that have recursive calls can be visualized with this tool. There is no need for writing a complete program with main method because only recursive functions are enough. That facilitates process of writing program segments. As an example for illustrating the visualization with SRec an example of code for finding the n-th member of the Fibonacci sequence is used. A part of static and dynamic visualization produced by this tool can be clearly seen in Figure 4.
Figure 4.Part of visualizing the program for finding the n-th member of the Fibonacci sequence with SRec (static visualization, tree view and stack view).
On the left part is code written as poor java code, giving the static visualization through emphasizing key words and numerating each line. Dynamic visualization is given through building recursion tree and changing stack view. Recursion tree presents flow of recursion step by step. Recursion tree’s leaves are basic cases of recursion.
Another part of dynamic visualization is Trace view. Trace view of our example is given in Figure 5.
Figure 5. Trace view as part of dynamic visualization of the program for finding the n-th member of the Fibonacci sequence with SRec.
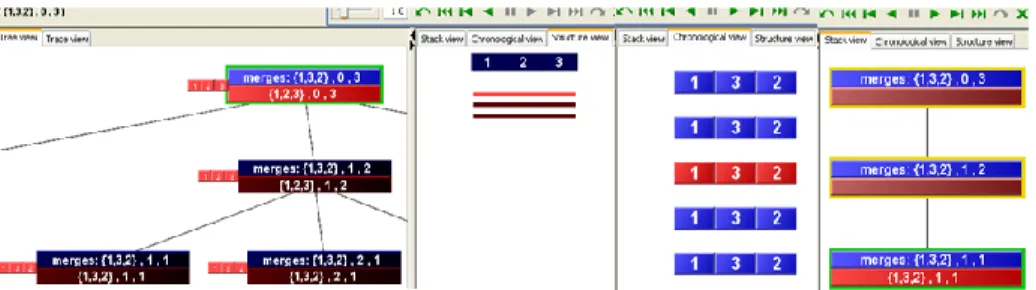
Recursion is also met at “divide and conquer” algorithms. SRec automatically recognizes and detects these types of algorithms and obtains additional views for them. As an example for illustrating this kind of algorithms we chose merge-sort again. In Figure 6 are given Tree view, Structure view, Chronological view and Stack view as part of dynamic visualization merge-sort with SRec.
Figure 6. Tree view, Structure view, Chronological view and Stack view as part of dynamic visualization of merge-sort with SRec.
This tool can be easily found, download and installed. Version 1.2 can be directly run as .jar file. That makes this tool easy to use and can greatly assist in understanding of recursive functions.
Disadvantage of this tool is that it only works with simple data types and does not provide the input and output arguments of recursive functions to be instances of classes. If large number is entered as input argument to function then recursive tree becomes enormous and difficult to be followed. In this case, visibility and clarity in recursion visualization is lost.
2.3 JGrasp
JGrasp is tool or development environment, created specifically to provide automatic generation of software visualizations to improve the comprehensibility of software. jGRASP is implemented in Java, and runs on all platforms with a Java Virtual Machine. jGrasp can compile and execute programs written in Java, C/C++, Python or Ada. For all these programs this tool enables creation of Control Structure Diagrams – CSD and only for Java programs enables creation of Complexity Profile Graphs –CPGs and UML class diagrams as part of static visualization. Dynamic visualization with this tool is obtained during debugging and it’s possible only for programs written in Java. There is data structure identifier mechanism which recognizes objects that represent traditional data structures such as stacks, queues, linked lists, binary trees, and hash tables, and then displays them in an intuitive textbook-like presentation view [9].
Programs that can be visualized are written in poor Java or C/C++ code, without need for inserting additional program elements. Because we already had used program for merge-sort we decided to use here too.
Figure 7. Static visualization (Control Structure Diagrams – CSD) of merge-sort with jGrasp. The same kind of visualization is obtained for C/C++ programs. All program elements are presented in different ways. This helps user to see where program begins and where ends, which are local and which global variables or where cycles and program brunches are. This minimize possible syntax errors or facilities their finding if there are any.
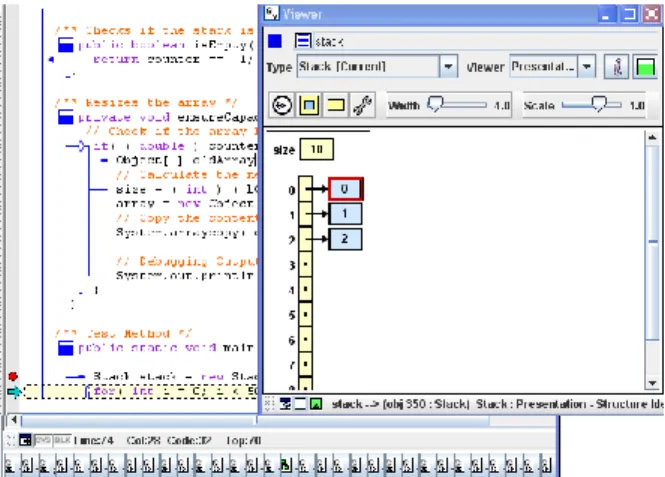
Dynamic visualization obtained in jGrasp is on high level of abstraction and it is connected with data structures and their change during running a program. This kind of visualization offers better understanding of traditional data structures. Also helps understanding operations, like: creating data structure, adding element, finding element or removing element from the structure. We decided to use program that uses stack data structure implemented with arrays and binary tree for illustrating dynamic visualization of jGrasp.
In Figure 8 is given part of dynamic and static visualization of program using stack structure implemented with arrays, obtained during debugging the program with Jgrasp.
Figure 8. Part of jGrasp’s dynamic and static visualization of program using stack structure implemented with arrays.
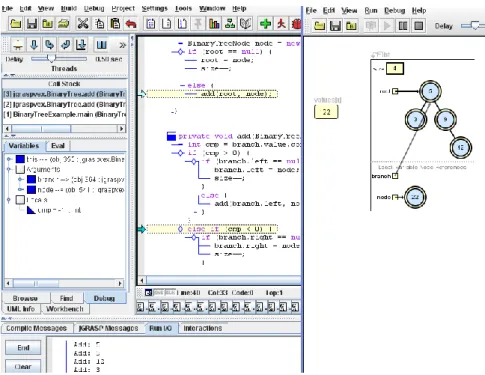
In Figure 9 the same kind of visualization is shown. Difference here is using simple program working with binary trees for illustration.
Figure 9. Part of jGrasp’s dynamic and static visualization of program using binary tree.
jGrasp can offer different kind of static visualization for object oriented programs automatically creating UML class diagrams and also can produce Complexity Profile Graph-CPG for all Java programs. Complexity Profile Graph and UML class diagram for the program using binary trees are given in Figure 10.
Figure 10.jGrasp’s Complexity Profile Graph and UML class diagram as part of static visualization of program using Binary tree.
jGrasp can be easily found and download. Because it is platform independent it can work with any operating system. It offers good interaction with user during editing the code or during debugging and forming dynamic visualization. The user decides which elements will be shown during animation.
2.4 DDD
DDD (Data Display Debugger) is tool for debugging programs written in С/С++ Java or Perl. More precisely DDD is graphical user interface for command line debuggers like GDB,
DBX, WDB, JDB, XDB, Perl, bash and Python [1]. DDD displays data structures as graphs. Something that makes this debugger different from the others like gdb, is that it offers graphical presentation of data structures and it is specially suitable for representation of pointers in C/C++ programs. Pointers especially double pointers are part from programming which can be difficult to be understood and this tool can help in process of their learning and understanding.
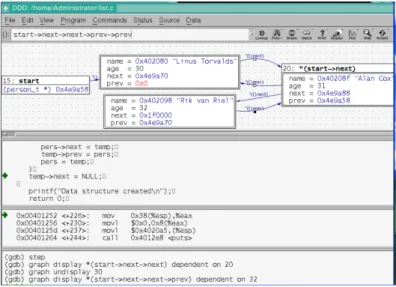
For illustrating visualizations that this tool offers we decided to use program written in C which uses pointers and also list as data structures. In Figure 11 is shown part of dynamic and static visualizations of program with list using DDD.
Graphical interface here looks like DOS environment. There are different views: code view, assembler and machine code view, view of potential error and messages and graphical display view.
Dynamic visualization here is obtained during program debugging.
User can’t edit code in this tool but his interaction here consists of debugging and managing display of dynamic visualization. User decides what program segment will be shown on graphical display view.
Figure 11. DDD’s static and dynamic visualization of program using pointers and list data structure. Programs that can be visualized with DDD are simple console applications written in pure java or C/C++ code. But DDD offers better dynamic visualization only for C/C++ programs.
DDD can be easily found on web but its installation can be a problem especially if there is a need for installing this program on Windows system. For its installation and making it works more software packages are needed. That can be a disadvantage of this tool.
3. Conclusion
Software visualization is an important part of studying and using software. There are many tools which visualize software but we decided to analyze four of them because they represent whole systems. They give user a freedom to write their own programs in some program language, without inserting additional elements in code and then watch their generated visualization.
By using this tools and by visualizations we obtained using tham, we can conclude that all of them can be used for visualizing programs from different aspects and can be used in different situations, but their mutual feature is that they all can be used for easily learning and understanding parts of code and finding possible errors in code. Visualization they produce is clear and understandable for simple programs. They are all free to use and need a little effort from user for making them work.
References
[1] A. Zeller, “DDD-A Free Graphical Front-End for UNIX Debuggers” ACM SIGPLAN Notices, Pages 22-27, Volume 31, January 1996.
[2] A. Moreno, N. Myller, E. Sutinen “Visualizing Programs with Jeliot 3”, AVI’04 Proceedings of the workingconference on Advanced visual interfaces, Pages 373-376, ACM New York, NY, USA ,2004.
[3] A. Pérez-Carrasco, J. Á. Velázquez-Iturbide, J. Urquiza-Fuentes, “SRec: An animation system of recursion for algorithm courses”, 13rd Annual Conference on Innovation and Technology in Computer Science Education, ACM Press, 2008
[4] A. Zeller “Visual Debugging with DDD” Dr. Dobb's Journal, Pages 21-28, Volume 322, March 2001
[5] A. Zeller “Animating data structures in DDD” Proc. SIGCSE/SIGCUE Program Visualization Workshop, Finland, July 2000
[6] C. Halverson, Jason B. Ellis, C. Danis, Wendy A. Kellogg „ Designing Task Visualizations to Support the Coordination of Work in Software Development “, ACM New York, NY, USA, 2006.
[7] C. M. Kehoe, J. T. Stasko “Using Animations to learn about Algorithms: An Ethnographic Case Study”- Technical Report GIT –GVU-96-20, September 1996.
[8] J. Á. Velázquez-Iturbide, A. Pérez-Carrasco, J. Urquiza-Fuentes, “Interactive visualization of recursion with SRec”, 14th Annual Conference on Innovation and Technology in Computer Science Education, ACM Press, 2009
[9] J.H.Cross “Using the new jGrasp canvas of dynamic viewers for program understanding and debugging in Java courses” Journal of Computing Sciences in Colleges, ACM, Volume 29 Issue 1, October 2013
[10] J.H.Cross, T.D. Hendrix “jGRASP: an integrated development environment with visualizations for teaching Java in CS1, CS2, and beyond”, ACM, Journal of Computing Sciences in Colleges, Volume 23 Issue 3, January 2008.
[11] N. Myller, R.Bednarik and A. Moreno “Integrating Dynamic Program Visualization into BlueJ: the Jeliot 3 Extension”, Seventh IEEE International Conference on Advanced Learning Technologies, ICALT 2007.
[12] R. Bednarik, A.Moreno and N.Myller “Jeliot 3, an Extensible Tool for Program Visualization”, 5th Annual Finnish / Baltic Sea Conference on Computer Science Education. November 17 - November 20, 2005.
[13] T. Khan, H. Barthel,A.Ebert, and P.Liggesmeyer, "Visualization and Evolution of Software Architectures"-Visualization of Large and Unstructured Data Sets Workshop 2011
[14] http://www.gnu.org/software/ddd/
[15] http://www.jgrasp.org/
[16] http://www.lite.etsii.urjc.es/srec/