Czech Technical University in Prague
Faculty of Electrical Engineering
Doctoral Thesis
Czech Technical University in Prague
Faculty of Electrical Engineering
Department of Computer Science
Graph-based Detection of Malicious
Network Communities
Doctoral Thesis
Jan Jusko
Prague, August 2017
Ph.D. Programme: Electrical Engineering and Information Technology Branch of study: Information Science and Computer Engineering
Supervisor: Martin Reh´ak, Ph.D., Ing´enieur ECP Supervisor-Specialist: Ing. Tom´aˇs Pevn´y, Ph.D.
Acknowledgments
First and foremost, I would like to express my gratitude to my supervisors, Martin Reh´ak and Tom´aˇs Pevn´y. Martin introduced me to the field of network security and his enthusiasm persuaded me to eventually join his research team. Ever since, Martin and Tom´aˇs have been constantly helping me with all aspects of my research. I especially appreciate and enjoy our discussions – we might often disagree, but their ideas always push my research forward. My sincere thanks also goes to Michal Pˇechouˇcek who provided me with an opportunity to join the Agent Technology Center group at the Czech Technical University.
I would like to thank my fellow graduate students and co-workers for providing a stim-ulating and fun environment in which to learn and grow. I am especially grateful to Karel Bartoˇs, Martin Grill and Jan Stiborek with whom I have worked closely over the last seven years. I am also very grateful to all collaborators who contributed to this research. Namely I would like to thank Ver´onica Valeros, with whom I worked closely on transforming my re-search project into production systems with global impact. I would like to thank Petr Somol and Luk´aˇs Machlica for valuable comments on this thesis.
I also would like to thank my family. I am thankful to my parents for their support, encouragement and guidance that helped me immensely to get where I am today. They were always a source of inspiration for me. I also want to say a big thank you to Jazm´ına and Leonka for their love, patience and understanding. They were always happy to put a smile on my face when I needed it the most. Thank you.
I gratefully acknowledge the funding sources that made my Ph.D. work possible. I was funded by the ITC-A of the U.S Army (contracts N62558-07-C-001, W911NF-08-1-0250, W911NF-10- 1-0070 and W911NF-12-1-0028); ONR Global under the Department of the Navy (contract N62909-11-1-7036); Air Force Office of Scientific Research, Air Force Material Com-mand, USAF (grant FA8655-10-1-3016); Czech Ministry of Education (grants ME10051 and MEB111008) and the Czech Ministry of Interior (grants VG2VS/189 and VG20122014079).
Abstract
In this thesis, we use graph based methods in conjunction with behavioral modeling to uncover hidden malicious communities and peer-to-peer traffic.
The nature of malicious traffic, and its tendency to rally in order to communicate with its owner opens a possibility to detect malicious traffic by revealing hidden sub-structures of network traffic. In fact, besides discovering the presence of an infection, analyzing network traffic also enables inference of valuable context information about the malicious campaign as a whole, often leading to a more precise attribution than is possible using only a host-based solution. In this work, we focus on the detection approaches that observe the hidden structures and exploit them to uncover malicious command & control (C&C) servers.
Peer-to-peer (P2P) protocol is a popular choice with malware authors to be used as a C&C channel. Therefore, we propose a unified solution to identify P2P communities operating in a monitored network. We propose an algorithm that is able to 1) progressively discover hosts in the monitored network that cooperate in a P2P network and to 2) identify that P2P network. Starting from a single known host, other hosts participating in the P2P network are identified through the analysis of widely available and standardized IPFIX (NetFlow) data. It is able to identify a large range of both legitimate and malicious P2P networks, is highly scalable and the use of standard meta-data without access to traffic content makes it easy to deploy and justify from privacy protection perspective.
Even malware families that do not rely on a P2P-based C&C channels resort to highly dynamic C&C structures to counter security industry approaches based on blacklisting known malicious domains. It is therefore important to automatically follow the migration of C&C servers. We propose to use a well-known Probability Threat Propagation (PTP) with a novel graph representation capturing connections from clients to servers. The proposed graph representation is highly condensed, preserves privacy, allows us to find malicious domains that cannot be found using existing graph representations and is harder to evade by malware authors.
We propose two behavioral models for HTTP traffic together with kernel-based similarity and distance functions that can be conveniently used to extend the findings of PTP. For any domain marked as malicious by PTP we can find other domains with identical or similar behavior, which are likely also malicious. This significantly increases the number of discovered malicious domains.
All proposed algorithms and representations are verified using extensive data sets spanning hundreds of independent networks. The validity of proposed approaches was further verified in a large-scale deployment within the Cisco Cognitive Threat Analytics.
Abstrakt
V tejto pr´aci vyuˇz´ıvame grafov´e met´ody v spojen´ı s behavior´alnym modelovan´ım na odhalenie skryt´ych spoloˇcenstiev ˇskodliv´ych serverov a ˇskodliv´ych peer-to-peer (P2P) siet´ı.
Povaha siet’ovej komunik´acie malwaru a jeho tendencia koordinovane sa nap´ajat’ na kon-troln´e servery s ciel’om komunikovat’ s jeho vlastn´ıkom otv´ara moˇznost’ odhalit’ siet’ov´u ko-munik´acia malwaru odhalen´ım skryt´ych subˇstrukt´ur siet’ovej prev´adzky. Anal´yza siet’ovej prev´adzky okrem zistenia pr´ıtomnosti infekcie malwarom umoˇzˇnuje odvodenie hodnotn´ych kontextov´ych inform´aci´ı o kampaniach malwaru ako celku, ˇco ˇcasto vedie k presnejˇsiemu urˇceniu pˆovodu malwaru, neˇz je moˇzn´e len na z´aklade antiv´ırov´eho rieˇsenia. V tejto pr´aci sa zameriavame na pr´ıstupy detekcie, ktor´e pozoruj´u tieto skryt´e ˇstrukt´ury a vyuˇz´ıvaj´u ich na detekciu serverov sl´uˇziacich na koordin´aciu malwaru.
Autori malwaru ˇcasto pouˇz´ıvaj´u P2P siete ako prostriedok komunik´acie s malwarom. Preto navrhujeme jednotn´e rieˇsenie na identifik´aciu P2P komun´ıt pˆosobiacich v monitorovanej sieti. Navrhujeme algoritmus, ktor´y je schopn´y 1) postupne objavovat’ zariadenia v sledovanej sieti, ktor´e spolupracuj´u v P2P sieti a 2) identifikovat’ dan´u P2P siet’. Toto rieˇsenie je schopn´e na z´aklade znalosti jedn´eho zariadenia s vyuˇzit´ım anal´yzy siet’ovej komunik´acie v ˇstandardnom form´ate IPFIX (NetFlow) dohl’adat’ d’alˇsie zariadenia, ktor´e s n´ım spolupracuj´u v rovnakej P2P sieti. Navrhnut´y algoritmus je schopn´y identifikovat’ vel’k´y rozsah legit´ımnych aj ˇskodliv´ych P2P siet´ı a je vysoko ˇsk´alovatel’n´y. Pouˇz´ıvanie ˇstandardn´ych form´atov bez pr´ıstupu k vlastn´emu obsahu siet’ovej komunik´acie umoˇzˇnuje jednoduch´e nasadenie a ochranu s´ukromia uˇz´ıvatel’ov.
Skupiny malwaru/ˇskodliv´eho softv´eru, ktor´e sa nepouˇz´ıvaj´u P2P siete na komunik´aciu so svoj´ım autorom, vyuˇz´ıvaj´u ˇcasto sa meniace sady serverov aby sa vyhli detekcii pomocou blacklistov – zoznamov zn´amych ˇskodliv´ych serverov. Je preto dˆoleˇzit´e sledovat’ automaticky migr´aciu serverov ˇskodliv´ych serverov. Navrhujeme pouˇzit’ zn´amy algoritmus Probabilistic Threat Propagation (PTP) v spojitosti s nov´ym grafom, ktor´y popisuje siet’ov´e spojenia medzi klientami a servermi. Navrhovan´y graf zachyt´ava relevantn´e inform´acie o siet’ovej ko-munik´acii v komprimovanej forme, ktor´a zachov´ava s´ukromie uˇz´ıvatel’ov zariaden´ı, umoˇzˇnuje n´ajst’ ˇskodliv´e servre, ktor´e nie je moˇzno n´ajst’ pomocou existuj´ucich grafov´ych reprezent´aci´ı a obmedzuje moˇznosti autorov malwaru vyhn´ut’ sa detekcii.
Navrhujeme dve techniky modelovania HTTP siet’ovej komunik´acie, spolu s funkciami podobnosti a vzdialenosti zaloˇzen´ymi na kernel funkcii. Tie sa daj´u pouˇzit’ na n´ajdenie dodatoˇcn´ych ˇskodliv´ych serverov na z´aklade serverov n´ajden´ych pouˇzit´ım algoritmu PTP. Pouˇzit´ım modelovania siet’ovej komunik´acie, n´ajdeme pre kaˇzd´y server oznaˇcen´y ako ˇskodliv´y algoritmom PTP d’alˇsie servery s rovnak´ym alebo podobn´ym spr´avan´ım, ktor´e s´u pravde-podobne taktieˇz ˇskodliv´e. To v´yrazne zvyˇsuje poˇcet n´ajden´ych ˇskodliv´ych serverov.
Vˇsetky navrhovan´e algoritmy boli overen´e na rozsiahlych mnoˇzin´ach d´at, ktor´e pokr´yvaj´u stovky nez´avisl´ych siet´ı. ´Uspeˇsnost’ navrhovan´ych pr´ıstupov bola d’alej overen´a vo vel’kom meradle v r´amci produktu Cisco Cognitive Threat Analytics.
Contents
1 Introduction 1
1.1 Research problems . . . 4
1.2 Key contributions . . . 4
2 Related work 7 2.1 Basic graph notation . . . 7
2.2 P2P networks . . . 8
2.2.1 Structured Architectures . . . 8
2.2.2 Unstructured Architectures . . . 9
2.2.3 Popular peer-to-peer networks . . . 10
2.2.4 Peer Selection in P2P Networks . . . 12
2.3 P2P as a botnet C&C . . . 12
2.3.1 Viability of P2P networks for C&C . . . 12
2.3.2 Peer-to-peer as a botnet C&C channel . . . 15
2.4 Botnet detection . . . 18
2.4.1 Monitoring mutual contacts . . . 18
2.4.2 Persistence analysis . . . 22
2.4.3 Other methods . . . 25
2.5 Guilt by association methods . . . 29
2.5.1 Probabilistic threat propagation . . . 31
2.6 Behavioral modeling of HTTP traffic . . . 33
3 P2P networks detection 37 3.1 Introduction . . . 37
3.2 Finding cooperating hosts . . . 38
3.2.1 The graph algorithm . . . 39
3.3 Identifying the revealed P2P network . . . 42
3.3.1 P2P prototype stability . . . 47
3.4 Enumerating all active peer-to-peer networks . . . 47
3.5 Joint detector design . . . 48
3.5.1 Persistence module . . . 49
3.5.2 Graph module . . . 50
3.5.3 Identification module . . . 51
3.6 Evaluation . . . 52
3.6.1 Data sets description . . . 52
3.6.2 Computation performance evaluation . . . 54 i
3.6.3 Detection performance evaluation . . . 54
3.6.4 Recall on the P2P network snapshots . . . 56
3.7 Discussion . . . 56
3.7.1 Parameters and their impact . . . 58
3.8 Conclusion . . . 59
4 Probabilistic threat propagation analysis 61 4.1 Full equations . . . 62
5 Identification of malicious domains using graph inference 65 5.1 Theip-domain graph . . . 66
5.2 Theclient-domain graph . . . 67
5.2.1 Interpretation issues . . . 67
5.2.2 Practical issues . . . 68
5.2.3 Leaking personally identifiable information . . . 68
5.3 From bipartite to unipartite graphs . . . 69
5.3.1 Edge weight functions . . . 70
5.3.2 Distributed construction of unipartite graphs . . . 73
5.4 Pruning of client-based graphs . . . 74
5.5 Experiments & evaluation . . . 75
5.5.1 Data set description . . . 75
5.5.2 Source of labels . . . 75
5.5.3 Evaluation criteria . . . 76
5.5.4 Bipartite graphs . . . 76
5.5.5 Improving precision of client-domain-based graphs . . . 77
5.5.6 Impact of graph pruning . . . 78
5.5.7 Distribution of calculated probabilities . . . 80
5.5.8 Differences in findings . . . 82
5.5.9 Correlation . . . 82
5.6 Discussion & remarks . . . 84
5.7 Conclusion . . . 86
6 Behavioral modeling of domains 87 6.1 Behavioral models & kernels . . . 88
6.1.1 Query-based behavioral modeling . . . 88
6.1.2 Path-based behavioral modeling . . . 89
6.2 Evaluation . . . 91
6.2.1 Data Set Description . . . 92
6.2.2 Source of Labels . . . 92 6.2.3 Evaluation methodology . . . 92 6.2.4 Quality of clustering . . . 93 6.2.5 Computational Performance . . . 93 6.3 Conclusion . . . 94 7 Conclusion 97 7.1 List of author’s publications . . . 98
List of Figures
1.1 Scope of the peer-to-peer discovery algorithm. . . 2
1.2 Scope of our method when compared to Probabilistic Threat Propagation. . . 3
2.1 Life spans of botnets. . . 16
2.2 Peacomm - number of contacted peers. . . 18
2.3 Precision-recall curve Nugache. . . 22
2.4 ROC curve of persistence measurement method. . . 25
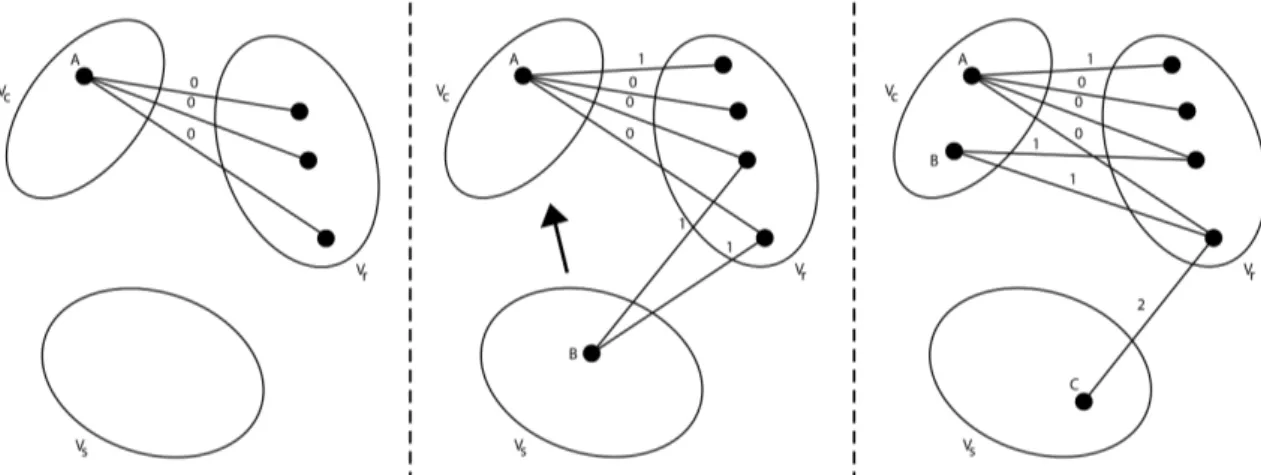
3.1 Graph algorithm illustration. . . 40
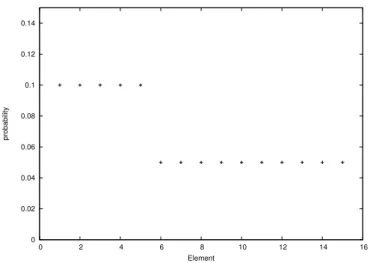
3.2 Example of a mixture of uniform distributions. . . 42
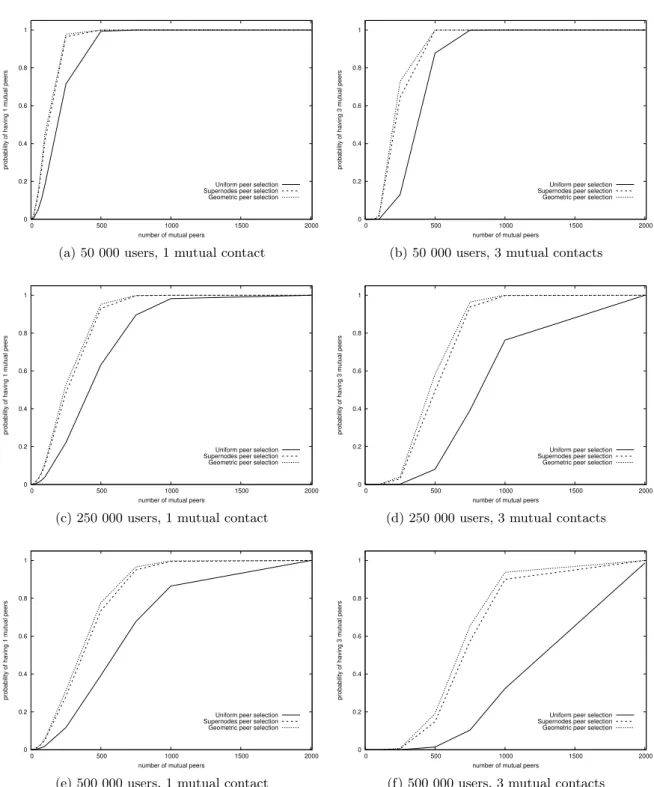
3.3 Mutual contacts probability (1,3). . . 43
3.4 Mutual contacts probability (5,7). . . 44
3.5 Port distribution of major P2P networks. . . 46
3.6 Proposed P2P detector schema. . . 48
3.7 Persistence of endpoints. . . 49
3.8 Processing times of the proposed P2P detector. . . 54
3.9 Detection rate of the proposed detector. . . 55
4.1 Decrease of calculated threat depending on distance from seed. . . 62
5.1 Unintuitive results on a bipartite graph using PTP. . . 69
5.2 Impact of removal of domains with low popularity. . . 79
5.3 Number of detected users after removal of malicious domains with low popularity. 80 5.4 Distribution of calculated probabilities - bipartite. . . 80
5.5 Distribution of calculated probabilities - unipartite. . . 81
5.6 Correlation of the proposed edge weight functions. . . 85
6.1 Visualization of different parts of URL. . . 88
6.2 Path representation example. . . 89
6.3 Example of data tunneling via URL. . . 90
6.4 Path representation compression. . . 91
List of Tables
2.1 Overview of methods and goals of the related work. . . 19
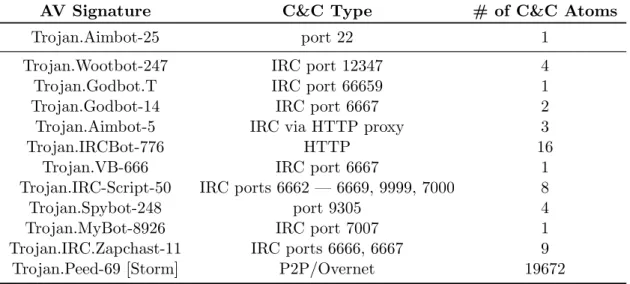
2.2 List of sampled botnet binaries with clear identifiable C&C traffic . . . 24
2.3 C&C detection performance . . . 25
3.1 Communication period of peers in selected P2P networks. . . 45
3.2 Experiment setup - installed client applications of P2P networks. . . 52
3.3 Evaluation - parameters setup. . . 53
3.4 Properties of P2P network snpashots. (Sality & ZeroAccess) . . . 53
3.5 Recall estimate on P2P network snapshots. (Sality & ZeroAccess) . . . 57
5.1 FQDN to second level domain and publix suffix examples. . . 75
5.2 A summary of properties of data sets used in evaluation. . . 75
5.3 Precision@K achieved by PTP using ip-domain and client-domain graphs in two considered use cases. . . 76
5.4 Achieved precision@100 - training set . . . 77
5.5 Achieved precision@100 - testing sets . . . 78
5.6 Intersections of domains detected by various edge weight functions. . . 83
5.7 Correlation of the proposed edge weight functions. . . 84
6.1 An example of URL with query string and extracted keys augmented with type of corresponding types of values. . . 89
6.2 Description of the training and testing data set. . . 93
6.3 ARI for the compared metrics using 5 well established clustering algorithms. 94 6.4 Computational performance comparison - behavioral modeling. . . 94
Chapter 1
Introduction
Malware is a shortcut for malicious software. It is designed to infect a device and either provide profit to its author or cause harm to the owner of the device. In the past, malware was created mostly as a prank or to demonstrate skill. Nowadays, it is mostly used to create profit for its authors, steal information, or attack specific organizations or nation states with the goal of causing harm.
Malware thus became an umbrella term for a whole family of software with malicious intents. In fact, whether a software is considered to be a malware is based on the intent of its author, not on the actual harm/profit made by the software. Malware can be categorized into several groups, either according to its purpose or means of spread. Distinguishing by purpose, there are four common groups of malware:
• adware which makes profit to its owner by click fraud,
• spyware whose goal is to steal personal information such as credit card numbers, or industrial and/or state secrets
• ransomware which encrypts the files on infected devices and demands ransom to decrypt them, and
• spamware that makes profit by sending spam emails from the infected devices.
When distinguishing malware by spreading mechanism, there are basically two types of mal-ware – one can spread without user interaction, for example by exploiting known or not yet disclosed device or network vulnerabilities; the other spreads by tricking a human user into thinking that the given malware actually has a legitimate purpose.
Two main strategies [122] exist to protect devices from infection by malware. The classi-cal, host-based approach is an anti-virus software installed on a device, that scans in real time all executed files. If a file is found to be malicious, its execution is blocked and it is removed from the system. A more recent approach is to protect devices on the network level. Private companies and governmental organizations employ firewalls that check all traffic coming to a network from the Internet. Such solutions block downloads of malicious binaries or con-nections to/from sites that serve exploit kits. However, malware with infection vectors other than the network is not covered by this solution.
Host-based and network-based strategies of infection prevention are based on fundamen-tally different observations. First, during and after infection, any malware needs to embed
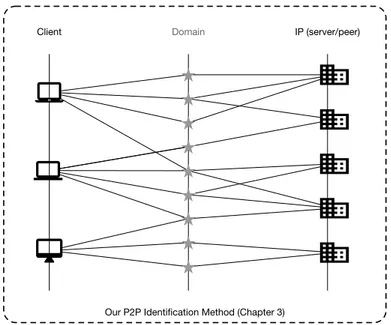
Our P2P Identification Method (Chapter 3)
Client Domain IP (server/peer)
Figure 1.1: Scope of the peer-to-peer discovery algorithm.
itself into the device’s system, e.g. by installing code and/or making changes in registries so that the instance of malware is started every time the device is rebooted. Second, malware needs to communicate over Internet to bring economic benefit to its owner. The communi-cation may be either to receive new commands or monetize the infected machine in any way, e.g. ex-filtrate data.
Host-based and network-based detection approaches are thus complementary. Malware authors can avoid detection by either, but evading both approaches working in unison poses new challenges to malware authors.
Another important distinction is whether the protection system is set-up forpreventionor
detection. Intrusion prevention systems (IPS) attempt to prevent the infection itself – firewall blocks download of a malicious file and anti-virus blocks its execution. But prevention is not always effective. First, IPS is often biased to prefer precision over recall. This prevents false alarms, but weakens the coverage of rapidly developing new threats. Second, malware can exploit an infection vector that is not covered by the installed IPSs. Malware thus can infect a system despite IPS being in place. On the other hand, Intrusion detection systems (IDS) passively monitor what is happening either in the network or on the infected hosts in order to uncover successful infections.
Many detection approaches focus on statistical properties of malicious network communi-cation. The nature of malicious traffic and its tendency to rally in order to communicate with its owner opens a possibility to detect malware activity by revealing hidden sub-structures of network traffic. In fact, besides merely discovering the presence of an infection, analyzing network traffic on global scale also enables inference of valuable context information about the malicious campaign as a whole. This often leads to a more precise attribution than is possible using only a host-based solution. Our work specifically focuses on the detection of malicious communication structures in network traffic and uses them to uncover malicious command & control (C&C) servers that manage the botnets. Once discovered, the C&C servers are
Client Domain IP (server/peer)
Probabilistic Threat Propagation (as published) Our Method (Chapters 4,5,6)
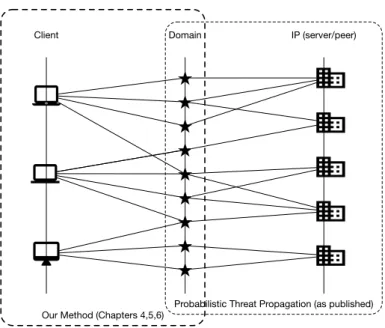
Figure 1.2: Scope of our method when compared to Probabilistic Threat Propagation.
used by other methods (not discussed in this thesis) to associate threat intelligence and other analytical results to a specific botnet.
Malicious C&C channels can have many shapes and forms. In recent years, C&C channels of several major botnets, i.e. virtual networks of cooperating infected hosts, were based on peer-to-peer (P2P) networks. P2P networks are an ideal choice for botnet owners – P2P networks do not have a central point of failure, which was typical for botnets with centralized C&C architecture. At the same time, any computer infected by a P2P-based malware can disseminate new commands to the rest of the botnet, protecting the identity of the botnet master. Accordingly, we will also address the problem of malicious P2P discovery. The scope of the proposed P2P discovery algorithm is depicted in Figure 1.1.
Our approach to the problem differs from the prevailing approach (Probabilistic Threat Propagation) in the domain. Instead of using the information contained in the relationship between a domain name and the associated IP address(es), we rely on the analysis of network metadata associated with the host. A comparison of the scopes of the two approaches is depiceted in Figure 1.2. The distinction is important mainly from security perspective, as it allows us to find a different set of malware when compared to the traditional approach. Traditional methods excel in identification of malware that heavily relies on changing set of DNS records on a limited set of server hosts. This case is typical, as it avoids domain-based blocking on host and network prevention devices and does not force the attackers to laboriously migrate the infrastructure. However, a growing proportion of diverse malware deviates from this scheme and avoids the detection by domain-based analytics completely. Our approach has been designed to be robust w.r.t. this evasion technique and therefore detects a different, novel set of malware.
The input metadata is typically available in standardized formats, such as Netflow/IPFIX records and/or HTTP access logs. When collected on a perimeter device, such as a router,
a firewall or a proxy, it contains full information about network connections between the monitored host and Internet. Following main elements can be extracted from each flow or request record: client host (internal IP, username and device ID), server domain and server IP address. Additional information can be extracted from some records (such as HTTP(S) header elements).
Our work builds a graph (or, rather, several graphs) that represents a set of connections between one monitored network and Internet. Then we use the analysis techniques discussed below to identify peer-to-peer activity and infected hosts in the network. Compared to tra-ditional IDS systems or anomaly detectors, this approach is harder due to the huge data volumes (our system processes more than 10 billion flows every day) and associated compu-tational cost. Therefore, our techniques need to be meticulously optimized for efficiency and scalability and many of the design choices have been driven by efficiency constraints.
1.1
Research problems
The main topic of this dissertation is identification of collaboration structures from client-server connection information, with particular emphasis on discovery of malicious communities. This can be decomposed to two specific research problems:
• RP1: How to detect all P2P networks in a monitored physical network?
P2P protocol is a popular choice with malware authors to be used as a C&C channel. Several of the biggest botnets observed recently used P2P as their C&C channel [117]. Malicious P2P networks aside, even legitimate P2P networks may have a detrimental effect on the existing anomaly detection approaches [53]. Therefore, traffic related to P2P traffic should be identified and processed separately. Categorization of detected P2P traffic is then needed to enable a proper response of network administrators.
• RP2: How can we use connection information to reveal C&C structures of malicious botnets?
Malware C&C structures are becoming increasingly dynamic, as the malware operators counter security industry approaches based on blacklisting known malicious domains. It is therefore important to automatically follow the migration of C&C servers. Connec-tion informaConnec-tion between infected hosts and external domains can be mined to discover the identity of migrated malicious servers and should be robust w.r.t. adversary manip-ulation. Intuitively, when a thousand infected hosts visit a single domain, this domain should be considered suspicious - unless it is called google.com. The real research prob-lem is to identify the malicious domains between the millions of legitimate servers, given the immense variety of network communication patterns.
1.2
Key contributions
In the following we propose solutions to the outlined research problems.
1. Detection of all P2P networks active in a monitored network and their clas-sification[65] (Chapter 3) We present a unified solution to identify Peer-to-Peer (P2P) communities operating in the monitored network. We propose an algorithm that is able
to 1) progressively discover hosts in the monitored network that cooperate in a P2P network and to 2) identify that P2P network. Starting from a single known host, other hosts participating in the P2P network are identified through the analysis of widely available and standardized IPFIX (NetFlow) data. Instead of relying on the analysis of content characteristics or packet properties, we monitor connections of hosts that are known to participate in a P2P network and then progressively discover other hosts through the analysis of their shared contacts outside of the monitored network. The algorithm presented in Chapter 3 is able to identify a large range of both legitimate and malicious P2P networks. It is highly scalable and the use of standard meta-data with-out access to traffic content makes it easy to deploy and justify from privacy protection perspective.
2. Identification of additional malicious domains based on the information about known malicious domains [66] (Chapter 5) Probabilistic Threat propagation is one of the leading algorithms to discover malicious communities in positive-unlabeled data. So far, it has not been used on the data capturing connections between clients and servers. Our contribution is the application of Probabilistic Threat Propagation to a unipartite graph that we have designed to capture the connection data in a highly con-densed and privacy-sensitive form. The use of connection data instead of ip-domain hosting information used in prior art [19] allows us to find different malicious domains using the same algorithm. At the same time, our focus on the connection data makes the detector harder to evade.
3. Definition of similarity for HTTP servers[66] (Chapter 6) We propose two distinct behavioral models to represent domains based on the HTTP request towards them. We also propose corresponding kernel functions that can be used to calculate either similarity, distance or can be used directly in the kernelized versions of classifiers or clustering algorithms. Behavior similarity can be used to extend the information about the maliciousness of a domain inferred using the algorithm from Chapter 5. Behavior similarity can therefore find other domains used for C&C of a specific botnet even without a single mutual connection on the set of monitored hosts. This significantly increases the number of malicious domains discovered by our algorithm from Chapter 5.
Chapter 2
Related work
In this chapter, we provide overview of
• peer-to-peer (P2P) networks,
• P2P-base command & control channels (C&C),
• methods to detect P2P networks,
• guilt by association approaches and
• behavioral modeling of HTTP traffic.
Each section should provide a comprehensive overview of prior art.
2.1
Basic graph notation
In this section, we introduce basic graph notation used throughout the thesis. It can be read prior the following chapters, as well as used as a reference if necessary.
Weighted undirected graph is defined as
G= (V, E, w) (2.1)
whereV is a set of nodes, w:E → R is an edge weight function and E ⊆ {{u, v}|u, v ∈V}
is a set of edges.
A graph with a specific layout, a bipartite graph, can be defined as
B= (U ∪V, E, w) (2.2)
where U and V are set of nodes called partitions, U ∩V = ∅, E ⊆ {{u, v}|u ∈ U, v ∈ V}
is a set of edges and w :E → R is an edge weight function. Bipartite graph can be further generalized in n-partite graph:
N = ([
i
Vi, E, w) (2.3)
where Ui are partitions,Ui∩Uj =∅,∀i, j,E ⊆ {{u, v}|u∈Ui, v∈Uj, i6=j}is a set of edges
and w:E →R is an edge weight function. 7
For any graph Gwe can define anode neighborhood function
N(u) ={v|{u, v} ∈E},∀u∈V (2.4)
that returns neighbors, i.e. adjacent vertices, of u in the graphG.
Weight functionw can be also specified using an adjacency matrixW ∈R|V|×|V| where
Wij =w(vi, vj). (2.5)
The adjacency matrix is always symmetric for undirected graphs. The same does not hold for directed graphs.
Closely related to the adjacency is the degree matrix D ∈ R|V|×|V|. Its elements are defined as Dii= X j Wij Dij = 0,∀i, j;i6=j. (2.6)
D is thus a diagonal matrix.
2.2
P2P networks
In this section we explore various peer-to-peer network architectures that serve as a basis for all P2P applications, including botnets with P2P-based C&C. In this work, we distinguish three types of peer-to-peer architectures [81]:
• structured,
• unstructured,
• hybrid.
2.2.1 Structured Architectures
Structured P2P networks have a known structure and it is undeniably easier to quantify their network performance. Among the most noted structured architectures are the classic DHT (distributed hash tables) designs: Chord,CAN,Pastry andTapestry.
Chord Chord, introduced in [130], is among the first attempts to design a robust P2P architecture for data storage and lookup. Chord uses a consistent hash function (SHA-1) to describe data that is shared within the overlay. Every piece of data (e.g. file) shared is assigned an m-bit identifier. The hash function of choice should distribute hashes uniformly since it is critical for chord performance. Every node in the Chord network is also assigned an m-bit identifier, and the node is responsible for providing files whose identifiers are closest to his own. The identifier space is organized in a ring — a circular list of numbers from 0 to 2m−1. It is only very rare that the Chord network contains as many nodes as there are available identifiers, therefore we define successor(i) to be the node with closest higher identifier than i. In this ring, every node maintains a small routing table, calledfinger table, which containsO(logN) items. Specifically, a node with identifier n has nodes si = successor((n+ 2i−1) mod 2m),
1≤i≤min its finger table. Thei-th entry contains interval [si, si+1) thus it is easy for node
n to determine which peer is responsible for a given range of identifiers. With this setting, the Chord requires each node to keep O(logn) other nodes in the finger table; the lookup complexity is also O(logN) and node joining or leaving a network entails only O(log2N) messages.
CAN CAN, which stands for Content Addressable Network was first presented in [116]. In CAN, nodes are spread into a d-dimensional Cartesian space and each node is responsible for a part of the space. For each data with key K, the key is hashed into d values and is then represented by a point in the coordinate space. The data is stored by the node that is responsible for the portion of the coordinate space in which the point resides. In the CAN architecture, each node needs to keep record of addresses of its neighboring nodes. In this d -dimensional space, two nodes are neighbors if their regions of responsibility overlap inexactly
d−1 dimensions. It follows, that each node keeps record of 2d neighbors. Routing in this architecture is straightforward — node just forwards the request for a specific resource to the neighbor that is closer (in terms of Cartesian distance) to the requested resources coordinates. If all the regions belonging to the N nodes in the network are same, the mean routing path length is (d/4)(n1/d). This architecture is also resilient to random node failures, since there is more than one pathway between any two points in the coordinate space.
Pastry & Tapestry The remaining two prominent DHT designs are Pastry [118] and Tapestry [150]. In Pastry, each node identifier is a 128-bit number from a circular space. Every node keeps a routing table with logbN rows, with b being a system specific integer value. In each row there are addresses of other nodes matching prefix one bit longer than those in the previous row. Routing is done by searching for nodes in the routing table that have the largest common prefix with the requested resource. Message routing in Pastry is O(logbN). The same routing complexity holds for Tapestry.
Interconnection of Structured Architecture There have also been attempts to inter-connect these networks. For example, one may use nodes that are capable of communicating using two or more protocols and use those as a proxy between two networks [44]. This requires introduction of supernodes that have enhanced capabilities compared to other nodes in the network. Another option is to use so-called truncated pyramid where different P2P overlays are interconnected by trees [102].
2.2.2 Unstructured Architectures
In unstructured P2P networking architecture, nodes simply choose their peers randomly. The prominent examples of unstructured P2P networks are Gnutella or BitTorrent. These two are also examples of two different approaches to the unstructured overlay network construction — Gnutella is purely random without any central authorities and BitTorrent utilizes a cen-tralized tracker (which is not necessary in the latest protocol versions). The two protocols are further described in Section 2.2.3. Overall, the unstructured P2P networks offer several good characteristics, like low diameter and network resilience to node churn and random failures.
Hybrid Architectures
Hybrid architectures try to bring the best from both worlds. We do not deal with them later in the text, but just to give one example we may refer reader to [101]. In it, a DHT ring of smaller unstructured networks called load balancing clusters is proposed. It is a two-layer network, with supernodes in the upper two-layer. Each supernode participates in the DHT network and manages a smaller unstructured network. This load balancing cluster shares the workload put on the managing supernode.
2.2.3 Popular peer-to-peer networks
In this section, we shortly describe the following P2P protocols:
• Skype,
• BitTorrent,
• Gnutella,
• Kademlia.
One can find studies of BitTorrent in [98], BitTorrent’s DHT [37], KAD (which is based on Kademlia) in [127, 86] and Gnutella in [84, 3, 92]. In the following we provide their short description.
Skype Skype protocol is proprietary and has not been publicly described yet. Moreover, Skype encrypts all its communication, it is thus difficult or even impossible to reverse en-gineer it. It is believed that Skype P2P protocol is based on the FastTrack P2P protocol and closely related to KaZaa [49]. While this has not been proven directly, there are stark similarities between them, e.g. both FastTrack and Skype use two layer overlay architecture with supernodes in one layer and ordinary nodes in the other.
A basic description of Skype architecture and an analysis of the message workflow can be found in [34]. Authors have also created several signatures to detect Skype traffic based on their findings. Detection using signatures requires packet payload inspection, which is processor intensive and introduces significant latency. Therefore, it is not suitable for high-bandwidth networks. Another analysis of Skype can be found in [49]. In this work, the authors also provide an analysis of user-behavior and estimate network workload generated by Skype.
Another approach to detect Skype was proposed in [15]. Two detection methods are offered – one based on Pearson’s Chi Square test and the other using Naive Bayes Classifiers. Both methods require packet payload inspection and therefore their deployment on backbone networks can be problematic. These two methods were further modified and their performance analyzed in [121]. Packet inspection and flow properties are also used for detection in [148]. Another approach, introduced in [139], is based solely on the flow data from the network.
An interesting Skype detection method designed specifically for 3G networks can be found in [134]. The authors exploit a specific property of 3G networks whereby every packet is associated with a specific mobile device (and thus user). However, it is still necessary to inspect packet payloads in order to detect active Skype node in the network.
Skype is analyzed from a rather different perspective in [138] where two Skype outages are analyzed and compared. One of the interesting observations of this work is that Skype
temporarily centralized its topology by the introduction of so-calledmega-supernodes, conse-quently speeding up the network recovery.
BitTorrent Bittorrent is a popular file sharing solution nowadays. It differs from another P2P network in that it joins a particular overlay only when it wants to download a file. This overlay is called a swarm and has form of a mesh. Before a node joins a swarm, it must retrieve set of already participating nodes from a tracker to bootsrap. This might be considered a single point of failure; as a countermeasure distributer tracker functionality over DHT (actually Kademlia-based) was added to the later versions of Bittorrent protocol. To enable multi-source downloads, the shared file is split into segments and chunks. Each participating node can download different chunks from different users. They key mechanisms of Bittorrent are choke algorithm and chunk selection algorithm. Choke algorithm is an incentive algorithm to promote fair usage of the network. In basics, every 10 seconds the peer decides to which of its neighbors it will send data. These neighbors are selected based on they willingness to share and speed of download from them. Chunk selection algorithm controls in what order are the chunks downloaded. Since the nodes exchange information about already downloaded parts, each node has an information about rarity of particular chunks. Then it chooses to download the rarest chunks first to ensure it will be able download the whole file. This was of course only a very short introduction, but since it is not the main aim of our work, we will not go any further. An interested reader may find more detailed information in [83].
Bittorrent from the point of view of an ISP was described in [124]. According to their anal-yses, flashcrowds (which are often the reason for the scalability studies in Bittorrent) appear always around midnight. Another interesting observation is that Bittorrent DHT dominates the BitTorrent traffic, even compared to data transfers. This suggests that BitTorrent has a high overhead when using distributed trackers.
The distributed tracker functionality over DHT is studied in [63]. They investigate why the real deployment of distributed trackers is not as successful and optimal as simulations suggest. According to their results, it seems that majority of Bittorrent nodes using DHT are behind NAT, therefore are unreachable by external hosts which severly disrupts the DHT overlay.
Last but not least, a detailed analysis of Bittorrent traffic on the both application- and flow- level in a broadband network can be found in [98]
Gnutella Gnutella is an unstructured P2P network used for file sharing. In its first version, it used purely random peer selection. Upon start of the node, it flooded the network sending
ping messages. If it contacted another Gnutella host, it received apong response. Searching in Gnutella network is done by flooding the overlay network with TTL-aware (time to live) query messages, where each query is forwarded to all known peers unless the TTL is 0 in which case it is discarded. A node usually had 4 to 5 peers. With the introduction of a new version of the protocol, so-called supernodes were introduced. Supernodes maintain many more connections to other supernodes. Gnutella overlay these days has a tree-like structures. Many studies of Gnutella have been published to this day. A study concerned with structural properties of Gnutella overlay can be found in [132]. This study contradicts many other studies of Gnutella by claiming that its overlay in fact does not follow a power-law degree distribution. It also states that Gnutella forms a small-world network.
Another work focused on Gnutella focuses on its messages inter-arrival times [97]. It argues that although many previous works assume that Gnutella has inter-arrival times following the Poisson distribution, it is in fact not true. They show that inter-arrival times are much better approximated by bi-modal Poisson distribution.
Observations from a 15-months long study of the two-tier Gnutella overlay network are described in [115]. They made an interesting observation, that while locality is not enforced in Gnutella, most of the connections exhibit a strong bias towards the intra-continent connec-tivity. Besides that, they observed that the architecture was starting to lose balance during its evolution and rapid increase in the number of nodes. However, changes in the client application managed to reverse the effect and the network regained its stability.
Kademlia Kademlia is a DHT P2P network algorithm, first introduced in [93]. It commu-nicates over UDP. We will not describe internals of the Kademlia implementation, however we point out to several interesting works dealing with Kademlia.
An implementation of Kademlia called KAD was monitored for over a year in [128]. One of the key observations is that user session times in the network are Weibull distributed, exploiting which may improve the publishing mechanism in KAD. Also, the measurements imply that KAD ID, assigned to each user is not static for all users (as was originally assumed). Some users change their KAD ID as often as once a day.
Kademlia is also known to be implemented as an overlay for several P2P botnets. Two articles dealing with Kademlia and its advantages and/or disadvantages for botmasters are considered in Section 2.3.2.
2.2.4 Peer Selection in P2P Networks
Peer selection in P2P networks is a broad and complex topic and we are interested only on a small practical implication of the chosen peer selection strategy. Therefore, we provide only a brief overview of the topic. Peer selection strategy can be either uniform random or biased (random). In case of a uniform random peer selection, node selects several peers randomly using uniform sampling. Such peer selection is used for example in BitTorrent to obtain the first set of peers from a tracker when joining a swarm. The goal of biased peer selection strategies is either to improve data locality [137, 123, 145], minimize delay in multimedia streaming [143], adapt to heterogeneous bandwitdhs within the population [143, 11] or solve scalability issues of existing networks [23].
2.3
P2P as a botnet C&C
2.3.1 Viability of P2P networks for C&C
In this section we review related work that analyze the ability of various P2P architectures to be used as a C&C channel. The focus lies mainly in the ability of the P2P protocols to disseminate new commands, update malicious binaries, and to withstand targeted attacks and enumeration attempts.
Researchers do not have direct global access to the P2P overlay networks used by bot-nets, therefore, when studying properties, mitigation strategies, and potential improvements of P2P-based botnets, they turn to theoretical models that approximate real P2P overlay networks. Structured P2P networks are commonly represented by the Erd¨os-R´enyi random
graph model and unstructured P2P networks are represented as Barab´asi-Albert scale free network model. This choice is based on the observed degree distributions of nodes in graph representations of P2P networks. Structured P2P networks tend to keep uniform degree dis-tribution of its nodes, which is typical the case of the Erd¨os-R´enyi model. On the other hand, unstructured networks typically have scale-free degree distribution, which is typical for Barab´asi-Albert scale free model. Published works sometimes also analyze Watts-Strogatz
small world model, despite the fact that overlay networks with the similar structure are extremely rare; one example of such network is Zindos [27].
Research community is understandably interested in strategies to disrupt botnets. Across the literature, three disinfection strategies are considered when evaluating resilience of a P2P overlay:
• random disinfection,
• tree-like disinfection,
• globally-optimal disinfection.
Random disinfection is equivalent to a random node failure in the study of resiliency of general peer-to-peer networks. In such a case, an infected computer is cleaned once a malware is detected without using any knowledge that can be gained from the malware instance. In the tree-like disinfection, all the peers known to the already cleaned instance are also cleaned and so on. Globally optimal disinfection assumes knowledge of the whole overlay and picks nodes to be disinfected in the order of their importance to the network, e.g. highly connected nodes first.
To what extent a disinfection strategy disrupts a peer-to-peer overlay is determined by various metrics. For example, effectiveness, efficiency and resilience of P2P overlay network were evaluated in [27]. By effectiveness of a botnet, the authors understand an estimate of overall utility to accomplish a given purpose. By efficiency the authors understand the communication efficiency within the overlay network. Finally, robustness represents to ability of the overlay network to withstand the removal of peers. Effectiveness is measured by two metrics – size of the largest connected component and average bandwidth of the infected clients; efficiency is measured by the inverse geodesic length [55], and robustness is measured by the local clustering coefficient. The authors evaluate these properties of three theoretical models:
• Erd¨os-R´enyi random graph model,
• Barab´asi-Albert free scale network model and
• Watts-Strogatz small world model.
The conclusion is that the Erd¨os-R´enyi and Watts-Strogatz behave similarly if the targeted disinfection is being performed, outperforming the Barab´asi-Albert model. On the other hand, the Barab´asi-Albert model is more resilient to the random disinfection. As a conclusion, Erd¨os-R´enyi is considered as a good choice for overlay network.
In [28] a similar study is performed on a mix of theoretical models and existing peer-to-peer overlays:
• Overnet (Kademlia/DHT),
• Gnutella,
• Erd¨os-R´enyi random graph model,
• Barab´asi-Albert scale free network model
using different performance measures – reachability from a given node, shortest path length sets and diameter of the network graph and the three disinfection strategies. Experiments in the paper suggest that Gnutella, as an unstructured peer-to-peer network can be can be very well approximated by the Barab´asi-Albert model. On the other hand, Overnet, as a structured peer-to-peer network is not approximated correctly by the Erd¨os-R´enyi model, mainly due to the degree restriction in the Overnet, which is not present in the theoretical model. The conclusions of the paper seem to be consistent with [27]: Gnutella & Barab´ asi-Albert model are more resilient to the random disinfection, while Overnet and Erd¨os-R´enyi model are more resilient to targeted and tree-like disinfection. However, Overnet is even more resilient than the Erd¨os-R´enyi model. Similar observations were made in [6].
Another types of attacks on P2P botnets do not rely on node removal, but rather try to shut down the overlay itself. They were analyzed on an example of Kademlia in [50]. In it, several measures to identify important nodes in the overlay are proposed, among them
• degree centrality,
• eigenvector centrality [17],
• betweenness centrality,
• closeness centrality,
• routing–based centrality.
According to the experiments, none of the proposed measures fared particularly well in identi-fying nodes in the overlay that see most of the P2P network’s traffic. Even for the betweenness centrality, which appears to be the best metric for choosing the nodes that see the most traffic, this metric achieved only around 13% overlap of top 1000 nodes with respect to the portion of observed traffic with top 1000 nodes chosen by the measure. When comparing top 2000 nodes, this number jumps to around 22%.
Further on, betweenness centrality was used as a measure to identify the most important nodes in the overlay for the three mitigation techniques:
• poisoning attack [56],
• Sybil attack [32],
• eclipse attack [20].
In the poisoning attack, several nodes controlled by an attacker join the P2P network and publish keys belonging to the content being attack. Nodes controlled by the attacker provide fake content under those keys. In the case of Peacomm botnet, the attacker would publish keys corresponding to the URL for download of a new malware binary with an empty string. Other nodes in the network that do not belong to the attacker would slowly rewrite the original keys with the fake content. In the experiment, several poisoning attacks were conducted for
various numbers of poisoned nodes. It is shown that while betweenness centrality is not a good criterion for traffic observation, it does fairly well in choosing nodes for the poisoning attack. Even with only 10 initial bots, the authors were able to poison 25% of the population (of 2000); with 100 initial bots, they were able to poison half of the population. However, with 400 of the initially infected nodes, the poisoning hits the plateau and adding more poisoned nodes makes almost no difference.
In the Sybil attack, several fake nodes with various IDs are added to the node population. These nodes behave differently than the legitimate nodes. In the Sybil attack, the Sybil nodes are passive, thus do not forward any messages routed to them. The results of their experiment suggest that only a small fraction of traffic is forwarded to the Sybil nodes, thus these are not particularly effective in disturbing the operation. On the other hand, when intercepting traffic, the Sybil nodes learn the identity of other bots which suggests that this approach of enumerating botnet can be quite successful. It has also been shown, that it is more efficient to insert addresses of a few Sybil nodes into routing tables of many legitimate nodes, rather than inject addresses of many Sybil nodes into routing tables of only a few legitimate nodes. In the eclipse attack, the attacker tries to use his attack nodes to isolate particular nodes from the rest of the node population; this attack was not successful at all in [50].
Formal models of P2P overlays and attacks on them were described in [117]. Two main types of attacks on P2P-based botnets were considered:
• intelligence gathering,
• disruption and destruction.
Intelligence gathering represents the enumeration attacks, goal of which is to reconstruct the graph representation of the overlay network (crawling) or at least identify IP addresses of machines participating in the P2P network (injecting sensor nodes). Attacks classified as disruption and destruction arepartitioning,sinkholing andpoisoning. Goal of the partitioning attack is to split the overlay into several disconnected parts, which is similar to the eclipse attack. The goal of sinkholing is to replace peer list of all participating peers in the P2P overlay with sinkholed hosts, and thus effectively destroying the overlay. Poisoning attack is basically the Sybil attack described above. In the article, enumeration attacks are attempted on all active P2P-based botnets. Disruption attacks are modeled theoretically using the formal models proposed in the paper. Authors observed that in the enumeration attack, using sensor nodes in addition to crawling considerably increased number of observed peers. It was also observed that while Zeus and Sality are highly resilient botnets, Kelihos and ZeroAccess contain weaknesses that can be used to disrupt them.
2.3.2 Peer-to-peer as a botnet C&C channel
Botnets have been utilizing P2P overlay as their C&C for almost two decades now. A list of early botnets accompanied by the history of peer-to-peer and their introduction as the C&C channel can be found in [48]. In short, one of the first P2P botnets wasSinit that appeared in 2003 and used random scanning to find peers. In 2004 another botnet, Phatbot, emerged whose C&C was based on WASTE [2]. Two P2P botnets appeared in 2006,SpamThru and
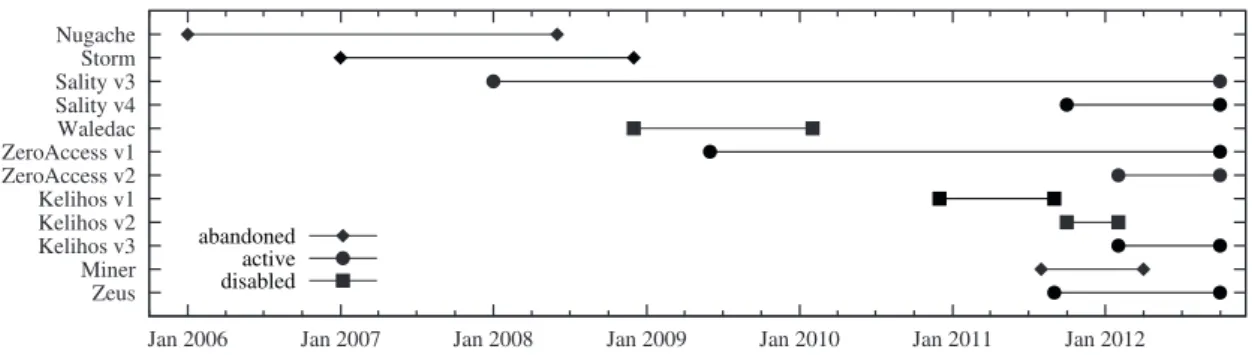
Nugache. SpamThru used a custom P2P protocol; and we mention Nugache in a bit more detail later in this section. More recent botnets that use peer-to-peer networks are described in [117]. Figure 2.1 provides the information about the life span of the modern P2P botnets.
Zeus Miner Kelihos v3 Kelihos v2 Kelihos v1 ZeroAccess v2 ZeroAccess v1 Waledac Sality v4 Sality v3 Storm Nugache
Jan 2006 Jan 2007 Jan 2008 Jan 2009 Jan 2010 Jan 2011 Jan 2012
abandoned active disabled
Figure 2: Lifespans of P2P botnet variants.
of the longest surviving P2P botnet families, is in principle relatively straightforward to sinkhole.
Table I shows the communication protocol, message prop-agation method, communication direction, C&C architec-ture, and the purpose of each P2P botnet. Note that all
recent P2P botnets have unstructured P2P protocols, that
is, they use message gossiping to propagate information. To date, most academic work on P2P botnets has focused on
structured architectures [22, 31, 32, 10]. Bots in structured P2P botnets typically maintain a distributed hash table that is used to store and route commands. Unstructured networks are not susceptible to many of the mitigation strategies for structured networks discussed in the literature. Motivated by the large number of unstructured P2P botnets that are used in the wild today, we propose attacks that are generally
applicable to structuredandunstructured P2P botnets.
The P2P botnets listed in Table I are used for a variety of purposes, including malware distribution, spam, credential theft, and Distributed Denial-of-Service (DDoS) attacks. The table also shows the C&C architectures of all P2P botnets. Nugache, Sality and ZeroAccess are purely P2P based. The other botnets rely on hybrid architectures, which incorpo-rate centralized servers, for instance to collect stolen data. Unfortunately, shutting down these centralized components usually has a minimal effect, as the P2P layer can easily be used to redirect bots to alternative servers. Thus, we focus specifically on the resilience of the P2P layer itself.
Family Protocol Prop. Dir. C&C Purpose
Kelihos custom gossip pull hybrid C,D,M,N,S
Miner custom gossip pull hybrid D,M,P
Nugache custom gossip pull P2P D,T
Sality custom gossip pull P2P D,N,P
Storm Overnet1 routing pull hybrid D,S,T
Waledac custom gossip pull hybrid D,S,T
ZeroAccess custom gossip pull2 P2P P
Zeus custom gossip both hybrid D,P,T
Table I: Overview of P2P botnet families showing their protocol, message propagation method, communication direction, C&C ar-chitecture, and purpose. The main purpose is highlighted in bold. C = Click Fraud, D = DDoS, M = Bitcoin Mining, N = Network Services, P = Pay-Per-Install, S = Spam, T = Credential Theft.
B. Botnet Descriptions
In this section, we describe the P2P botnets that we study in this paper, ordered by the date of their introduction.
1) Nugache: Nugache was a P2P botnet based on a cus-tom protocol, which first appeared in the beginning of 2006 [25]. Its main purpose was DDoS attacks. Earlier versions used IRC for C&C, but over time the C&C infrastructure was migrated to a P2P-based protocol. The Nugache botnet was one of the first to use strong cryptography to protect its communication. Some messages were signed with a 4096-bit RSA key to prevent unauthorized control. Parts of the inter-peer communication were encrypted using a hybrid RSA/Rijndael scheme.
2) Storm: Storm (a.k.a. Peacomm) was a structured P2P botnet based on Overnet, a Kademlia implementation. Storm appeared in the wild in January 2007. The first version of Storm was built upon an existing Overnet network used for file sharing, which the Storm bots shared with benign clients. Storm bots retrieved commands by using a time-based algorithm to compute the IDs under which new commands would be published by the botmaster, and then searching for these IDs in the DHT. Holz et al. [9] showed that in principle Storm could be mitigated by overwriting the command IDs in the DHT.
3) Sality P2P: The P2P version of Sality first appeared in early 2008 and is a variant of the centralized Sality malware downloader. Sality uses a pull-based unstructured P2P net-work to spread URLs where payloads are to be downloaded. Peers regularly contact their neighbors to exchange new URLs. We distinguish two disjoint Sality botnets, denoted as version three and version four. Both networks share the same P2P protocol, but version four of Sality fixes a critical vulnerability in the file downloading mechanism [7].
4) Waledac: Waledac originated in December 2008, and is assumed to be the successor of Storm [23]. The Waledac network used a tiered infrastructure, with an upper layer of centralized nodes providing commands and spam templates to a middle layer of router nodes. Nodes at the router
1A later added XOR encryption separated the Storm botnet from Overnet.
2Bots can trigger pulls at other peers, which are effectively pushes.
Figure 2.1: Visualization of life span of known P2P-based botnets. Adapted from [117].
All identified peer-to-peer based botnets were studied by the research community; for example, one can find studies of Nugache [31], Peacomm/Storm [68], ZeroAccess [144], Sal-ity [38], Waledac [129], Kelihos [71] and Miner [107]. In the following, we provide a short overview of several peer-to-peer based botnets. Their life span is visualized in Figure 2.1.
Nugache
Nugache first appeared in 2006 and was easily identified by AV software because of several known signatures it contained and use of port 8/tcp to listen for incoming connections [31]. However, Nugache became much more elusive after it was updated to a newer version which ceased to use port 8 and moved to a randomly chosen high port. Nugache first used a combination of P2P and centralized C&C architecture and all connection within the P2P overlay were encrypted. With time, the malware shifted completely to P2P, abandoning its IRC channels. At the time, the two C&C architectures were used together, the P2P overlay was used only for rallying bots to visit the botmaster’s IRC server when he needed them [31]. Another interesting thing is that when taking snapshots of peers of the one particular bot in different points in time, the sets overlap only marginally. This might be due to the churn in the network (new bots appearing, old bots being eliminated) or due to the use of dynamic IP addresses. Also, there is only a very small overlap between set of bots communicating with the particular observed bot over P2P and those encountered on the IRC channel. It is suspected, that the P2P network was designed in such a way, that upon observing a bot and monitoring its connection, one would not see more than a 10% of all bots in the botnet [31]. Also, connections within the P2P network are lightweight to avoid detection.
While monitoring a Nugache bot, the authors also witnessed several DDoS attacks and commands to infect other machines. The bot also received several commands to scan for vulnerabilities on hosts in the reserved ranges (reserved IP ranges containing non-routable IP addresses). It is interesting though, that scanning and propagation commands were received through the IRC channel, and command to perform DDoS was received over the P2P overlay.
Storm (Peacomm)
Peacomm, more commonly known as Storm Worm, uses two-step injection. In the primary injection, the base binary with the capability to join a P2P network is installed after the user runs an infected application. The bot then connects to the P2P network and downloads a secondary injection, that gives him the actual malicious capabilities (SPAM campaigns,
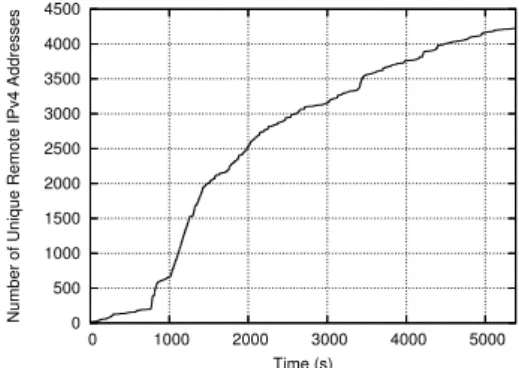
DDoS campaigns, ...). Peacomm employed two distinct P2P overlays. First from January to October 2007 — this network co-opted Overnet (based on Kademlia), shared the same ID space, message types and semantics as Overnet but employed a different Routing algorithm. This network was followed by new, encrypted network which run separate from Overnet [68]. Interesting thing about Peacomm is that it uses P2P network only to search for the URL from which it can download a new version. In comparison to Nugache, where bots kept low profile and did not heavily communicate within the P2P network, Peacomm bot contacted or was contacted by enormous number of peers as can be seen in Figure 2.2. At some point, Peacomm created a layered P2P overlay, with bots in possession of public IP addresses being considered more valuable and placed in the upper layer. The lower layer contained bots behind NAT that were used for example for spamming campaigns [68].
Sality
Sality is a file infector that appeared in several versions. Since 2008 it uses P2P to distribute URL of malware payloads to be downloaded and executed by infected hosts. Upon infection, infected binaries join Sality P2P overlay using the 1000 bootstrap peers embedded in the binary. There are two parallel versions of Sality that use P2P overlay for their C&C – v3 & v4; v4 fixes a critical vulnerability of v3 where files downloaded by the malware are not digitally signed and thus can be tampered with. P2P overlays of these two versions are not interconnected [117].
Waledac
Waledac appeared in 2008 and used a combination of centralized and P2P architecture. Waledac C&C architecture was split into three layers. The lowest layer contained spam-mers, that were infected machines with no public IP address and which, as the name suggest, sent out spam. The fact that these were hidden behind NAT complicated their identification. In the next layer wererepeaters, which were the entry point for newly infected machines as well as a place where spammers went to receive instructions. Repeaters also hosted fast-fluxing domains used by the botnet. While spammers and repeaters formed an actual P2P network, the highest layer containing backend servers was centralized and only repeaters had access to it [129].
Kelihos (Hlux)
Kelihos existed in three variants. The first variant was used for spamming and ID theft. It was blackholed in September 2011. The second version of Kelihos appeared shortly after, with mostly the same structure but new capabilities, such as performing DDoS attacks, stealing bitcoin wallets, intercepting passwords. This version of Kelihos was blackholed in March 2012. The third version was sinkholed in 2013. Kelihos has the same structure of P2P overlay as Waledac, therefore it is sometimes considered to be its successor. It was spread by social networks, especially by Facebook worm which lured victims into downloading a photo album [109, 71].
0 500 1000 1500 2000 2500 3000 3500 4000 4500 0 1000 2000 3000 4000 5000 Number of Unique Remote IPv4 Addresses Time (s)
Figure 2.2: Number of contacted peers along with time for a Peacomm (Storm Worm) malware instance. We can see that Peacomm is very active and within 100 minutes it contacted or was contacted by more than 4000 peers. [68]
ZeroAccess
Existence of ZeroAccess was first reported in 2011. Its size was estimated to around 1 million of infected machines [144]. It is a malware dropper and uses P2P network for its C&C channel. Thanks to its P2P-based C&C, it survived a takedown attempt by Microsoft in 2011 [111]. It exists in 2 variants and has 7 separate P2P overlays for its various minor versions – i.e. 32 bit and 64 bit versions use different overlay networks [117]. It has been estimated that ZeroAccess can bring up to $100,000 of profit to its owners daily [144].
Miner
Miner was a botnet using unstructured P2P overlay for its C&C and operated between August 2011 and March 2012 [117]. It was split into two disjoint networks consisting around 38,000 nodes [107]. One of its purposes was to mine bitcoins [142].
Zeus
Zeus has existed in several variants. Its first variants used centralized architecture and were target of many studies and take-down attempts. One of the variants switched to an unstruc-tured P2P overlay in September 2011. Zeus uses its overlay to relay commands, stolen data, configuration and binary updates. One of the monetization techniques of Zeus is theft of online banking credentials [117].
2.4
Botnet detection
In this section, we provide an overview of related work dealing with botnet detection. Two specific approaches that are the closest to our contribution are discussed in Sections 2.4.1 and 2.4.2. We then follow with the overview with other related work in the field. Categoriza-tion of related work can be found in Table 2.1.
2.4.1 Monitoring mutual contacts
A method how to identify local members of a botnet that uses unstructured random P2P network for its overlay if one bot from the botnet is already known was proposed in [26].
Table 2.1: Overview of methods and goals of the related work. goals P2P properties P2P-based C&C properties P2P detection botnet detection used metho ds empirical studies [3, 37, 78, 84, 86, 92, 98, 108, 127] [48, 117] - -theoretical analysis - [27, 28, 50, 117] - -thresholding - - [10] -graph methods [58, 59] - [26, 42, 57, 58, 59, 61, 73, 99, 42, 149] -statistical approaches - - [100, 151, 10] [42] persistence - - - [46]
Identification is done by post-mortem analysis of the network traffic. Once one bot is dis-covered in the network, the traffic preceding its discovery is collected (say 24 hours) and analyzed. The detection of other hosts is centered around the term mutual contact. We say two hosts in the network have a mutual contact if they both exchange traffic with the same host from outside of that network.
Before we move on, let us define a mutual contacts graph. It is a graph G = (V, E, w) where verticesV in the graph represent hosts in the protected network (for example identified by an IP address) andE is a set of weighted undirected edges;wis a weighting function which assigns each edge weight equal to the number of mutual contacts of the two incident nodes. When creating the graph, only mutual contacts are that were contacted by at most k local hosts are considered. This removes nodes representing popular servers that create a lot of edges in the graph and do not bring any valuable information.
Given the identity of the first infected host, referred to as seed node further on, mutual contacts graph is created and on it so calleddye-pumping algorithm is applied. Dye-pumping algorithm calculates the likelihood of belonging to the same P2P network as the seed node, for all nodes in the graph. It is an iterative algorithm that can be illustrated as pumping dye into the graph through the seed node. From the seed node, the dye distributes to the other nodes in the graph proportionally todye-attraction coefficient γji. γji specifies what portion
of the dye arriving to node j will be distributed to node iin the next iteration. Its value is determined as
γji =
Eji
(Di)β
where Eji is weight of the edge connecting nodes j and i, Di is degree of node i (number
of adjacent vertices) and β is node degree sensitivity coefficient. This coefficient limits the amount of dye arriving to highly connected nodes, since it is unlikely that these nodes are parts of the botnet (which authors assume has only few bots in the protected network).
The algorithm has three inputs:
• matrix E= (Eji) representing all edge weights,
• index sof the seed node Ns,
• i — the maximum number of iterations of the algorithm.
With these inputs at hand, the algorithm first computes the dye-attraction coefficients and forms the transition matrixTsuch that:
T(i, j) =γj,i=
Eji
(Di)β
where i, j ∈ 1, ..., v and i =6 j. We set T(i, i) = 0 and finally v is number of nodes in the graph. This matrix is further normalized so that all columns sum to 1. The algorithm further needsdye-level vector L, whereL(i) specifies how much dye has accumulated in thei-th node. Before the first iteration, all the dye is in the seed node and other nodes have no dye in them, therefore:
L(i) =
(
1, when s=i 0, otherwise
At each iteration, dye from nodes that have it is diffused to their neighborhoods. Amount of dye at each node can be calculated as
L(i) =
v
X
j=1
T(j, i)L(j)
which is equivalent toL=TL. After each iteration,Lis updated, such thatL(s) =L(s) + 1 and then normalized. After i iterations, L indicates the confidence for each node that it belongs to the same P2P network as the seed. We can define some thresholdthr and nodes with confidence exceeding this threshold are returned by the algorithm as the nodes in the same P2P botnet as the seed node. The algorithm summary can be found in Algorithm 1. While this algorithm has cubic complexity, matrixTand vectorLare usually sparse and one can take advantage of this.
The paper also discusses theoretical grounds on which the detection method is based. It is shown that for P2P networks where each peer selects its neighbors using uniform random peer selection, the probability that two hosts in the network share a mutual contact is surprisingly high. At the same time, any biased peer selection strategy increases this probability. It is also shown that assuming uniform random peer selection, edge probability pe between any
two nodes can be computed using hypergeometric distribution, so that pe= 1− C 0 B−1−C C B−1 C
This probability rises quickly as the number of contacted nodes increases. Besides the proba-bility of edge, its weight is also important for the algorithm to work correctly. In the random
Algorithm 1 Dye-pumping algorithm. 1: function Dye Pumping(E,s,maxIter)
2: T←computeT ransitionM atrix(E)
3: textbf T¯ ←normalize(T)
4: L←[0,0, ...,0]tr initialize L as a zero vector 5: foriter= 1 :maxIter do
6: L(s)←L(s) + 1 Pump dye from the seed node
7: L← L
P
L(i) Normalize dye level vector
8: L←textbf T L¯ Distribute dye in network for one iteration
9: end for
10: output L
11: end function
peer selection model, the probability of a peer to be contacted by two other peers is (C
B)
2
and since there are B peers at total, we can write the expected capacity of edges E[Cp] as E[Cp] = (C
B)
2B= C2
B .
The expected edge weight increases as the number of contacted peers increases regardless of the botnet size. Overall, these two observations suggest that bot will be closely connected by high weight edges. Since we assume random graph model with edge probability being same for each pair of nodes, we are in fact considering Erd¨os-R´enyi model [35, 36]. It has been shown that there is a sharp threshold of pe exceeding which results in the disappearance of
isolated vertices in the graph [36]. In particular this threshold has value of lnv
v
wherevis number of nodes in the graph. This implies, that increase in the number of infected hosts in the network eases the detection of those hosts by this algorithm.
We would like to note, that while in [26] it is suggested that Erd¨os-R´enyi model is used to model random unstructured P2P network, in other related work [27, 28], Erd¨os-R´enyi model is used to model structured P2P networks. The reasoning in [26] is that peers choose their neighbors uniformly at random, therefore there is no “intentional” structure and such P2P network can be approximated by random graph model. In contrast to that, reasoning of [27, 28] is based on the similarity of degree distributions seen in the random graphs and real-world structured P2P n
![Figure 2.4: ROC curve of the detection performance of persistence measurement method. [46]](https://thumb-us.123doks.com/thumbv2/123dok_us/761626.2596414/41.892.201.701.187.751/figure-roc-curve-detection-performance-persistence-measurement-method.webp)