CRM D0004598.A4/1Rev July 2004
Evaluation of the Pilot Program
for Home School and ChalleNGe
Program Recruits
Federico E. Garcia • James L. Gasch
Jennie W. Wenger • Brian D. Ray
This document represents the best opinion of CNA at the time of issue. It does not necessarily represent the opinion of the Department of the Navy.
Distribution unlimited. Specific authority: N00014-00-D-0700.
For copies of this document call: CNA Document Control and Distribution Section at 703-824-2123.
Approved for distribution: July 2004
Henry S. Griffis, Director
Workforce, Education and Training Team Resource Analysis Division
Contents
Erratum . . . . 1 Summary . . . . 3 Background. . . 3 Findings. . . 4 Overclassification of recruits . . . 4Attrition of home school and ChalleNGe recruits . . 5
Other performance measures . . . 6
Interest in military service . . . 6
Recommendations . . . 7
Introduction . . . . 9
Background. . . 9
About home schooling . . . 10
Instruction supervisors . . . 10
Instruction location. . . 11
Home schooling under state laws . . . 11
Existing evidence about home schoolers . . . 13
About the ChalleNGe Program . . . 15
Program goals . . . 15
Post-graduation experiences . . . 16
Data and methodology . . . . 17
Sources of data . . . 17
Survey of recruits . . . 17
Youth Attitude Tracking Study (YATS) . . . 21
Survey of home school associations . . . 23
Method of analysis . . . 24
Classification of recruits . . . 24
Attrition levels. . . 25
Reasons for attrition . . . 27
Interest in military service . . . 28
Home schoolers . . . 29
ChalleNGe participants. . . 30
Other recruits . . . 31
Findings . . . . 33
Misclassification of recruits . . . 33
Why does overclassification occur?. . . 35
Why does underclassification occur?. . . 35
How do overclassified recruits behave? . . . 36
Attrition. . . 38
Home schoolers . . . 41
ChalleNGe participants. . . 43
Other recruits . . . 44
Why do recruits attrite? . . . 45
Enlistment tiers and attrition . . . 47
Other performance indicators. . . 47
Positive drug tests . . . 47
AFQT scores. . . 49
Interest in military service . . . 49
Home school youth . . . 49
ChalleNGe youth . . . 51
Effective ways to reach home schoolers . . . 52
JROTC . . . 52
Identifying home school credentials . . . 54
Enlistment incentives for ChalleNGe youth . . . 55
Recommendations . . . 56
Appendix A: Home schooling in state laws. . . . 59
Appendix B: Survey of recruits . . . . 65
Appendix C: Categorizing education credentials . . . . 71
Tier 1 . . . 71
Home school graduate . . . 71
ChalleNGe graduate with a GED. . . 73
One semester of college—academic . . . 73
One semester of college—vocational . . . 73
Private school graduate . . . 73
Public school graduate . . . 74
Tier 2 . . . 74
GED . . . 74
Occupational program certificate . . . 74
High school certificate of attendance . . . 74
Correspondence school diploma . . . 74
Tier 3 . . . 75
No high school credential . . . 75
Other education categories . . . 75
Four years of college or more . . . 75
Two years of college . . . 75
Appendix D: Weighting the sample to reflect the population . . 77
Appendix E: Survey of home school associations . . . . 79
Appendix F: Categorizing personnel losses . . . . 85
Medical . . . 86
Fitness failure. . . 86
Misconduct . . . 86
Failure to adapt. . . 87
Defective enlistment . . . 87
Other or unknown losses . . . 88
Other . . . 88
Unknown . . . 88
Appendix G: Attrition rates by educational credential . . . . . 89
Appendix H: Regression estimates of attrition . . . . 93
References . . . 103
List of figures . . . 105
Erratum
After the original publication of this interim report in November 2001, we began work on the final report on the attrition rates of homeschooled and ChalleNGe recruits. In preparation for writing the final report, we submitted a new data request to DMDC. While cleaning the new dataset, we discovered that the final report’s 12-month attrition figures did not match those from this interim report. On closer inspection, we discovered the source of the discrepancy in the datasets. As requested, DMDC matched the initial survey data to accession files from FY99 and FY00. The next step was to match the survey data to loss files from both years. In the 2001 dataset, however, DMDC matched the survey data to loss files from FY00 only; thus we used the incomplete file in writing this interim report. Because the file included no losses from FY99, reported 12-month attrition rates listed in this report are below the actual 12-month attrition rates. Moreover, the difference in actual and reported rates is largest for the Army because we surveyed many Army recruits in FY99, smallest for the Navy because we surveyed few Navy recruits in FY99, and moder-ate for the Air Force and Marines.
The differences in the data used for this interim report and the data used for the final report altered the absolute attrition rates but had little effect on the relative performance of homeschooled and Chal-leNGe recruits compared with traditional high school diploma recruits. Therefore, our fundamental conclusions stated in this interim report are unchanged by this data correction.
We discuss the differences between the 12-month attrition rates listed in this interim report and those listed in the final report in an appen-dix of the final report.1 We regret any confusion caused by this error.
1. See appendix G of Final Analysis of Evaluation of Homeschool and
Chal-leNGe Program Recruits, Jennie W. Wenger and Apriel K. Hodari,
Summary
Background
The National Defense Authorization Act for Fiscal Year 1999 directed a 5-year pilot program to treat graduates of home schools and gradu-ates of the National Guard Youth ChalleNGe Program holding Gen-eral Education Development (GED) diplomas as Tier 1 for enlistment eligibility purposes. The Department of Defense (DOD) classifies enlisted accessions into three tiers based on education cre-dentials. Tier 1 recruits are primarily high school diploma graduates (HSDGs), Tier 2 recruits are primarily GEDs, and Tier 3 recruits are high school dropouts.
Enlistment tiers are intended to reflect attrition patterns—Tier 1 having the lowest attrition. DOD standards require that at least 90 percent of accessions be Tier 1. Recruits in Tiers 2 and 3 must score at or above the 50th percentile on the Armed Forces Qualifications Test (AFQT).
This study seeks to satisfy a congressional requirement for DOD to evaluate the performance of home school graduates and ChalleNGe graduates with GEDs and recommend their permanent tier status. The Directorate for Accession Policy, Office of the Assistant Secretary of Defense (Force Management Policy) asked CNA to assess the early separation rates and interest in military service of these two groups of recruits and to identify effective ways to reach out to them.
The size of the home school student population in the United States was approximately 800,000 during the 1999-2000 school year (about 2 percent of the K–12 population). In recent years, the number of home schoolers has grown by at least 7 percent per year. Common reasons for home schooling are dissatisfaction with the local schools and promotion of religious values. Home schoolers have strong aca-demic achievement.
The ChalleNGe Program targets 16- to 18-year-old high school drop-outs and expellees. Its primary goals are to improve participants’ employment potential and life skills and provide them with GED instruction. Authorized by Congress in 1993, it consists of a 22-week residential program conducted in a quasi-military environment. In the year 2000, 26 states and territories participated in the ChalleNGe Program with a total of 4,500 graduates; the cumulative number of graduates exceeds 25,000.
To obtain information about home schoolers and ChalleNGe Pro-gram participants, we conducted three surveys. First, we administered the Survey of Recruits’ Education and Background to more than 67,000 recruits. We matched the recruit survey data to personnel files maintained by the Defense Manpower Data Center (DMDC). Sec-ond, we administered a special collection of the Youth Attitude Track-ing Study (YATS) to about 400 home schoolers and 350 ChalleNGe Program participants. Finally, we used the responses to our Survey of Home School Associations to develop a meticulous data algorithm to identify home school graduates.
The number of home school and ChalleNGe recruits was below the 5,000 annual goal for a combination of these recruits set forth by the pilot program. There were about 1,500 home school recruits (0.8 cent of the total) and 750 ChalleNGe graduates with GEDs (0.4 per-cent of the total) in the four Services combined during the year ending in February 2000.
Findings
Overclassification of recruits
According to our recruit survey, the number of recruits in Tiers 2 and 3 in each Service is significantly greater than that captured in the DMDC files. From the match of the recruit survey to the DMDC files, we found that the DMDC files overclassify 8 percent of recruits for the four Services combined. An example of overclassification is a recruit who appears as an HSDG in the DMDC files but reports to us on the survey having a GED only or no credential at all.
Supporting our finding of overclassification, recruits who appear in the DMDC files as Tier 1 but report to us that they have a GED or no credential behave like Tier 2–3 recruits in each Service. These recruits have an average 12-month attrition rate of 17 percent, com-pared to only 10 percent for recruits classified as Tier 1 in both the survey and the DMDC files.
Furthermore, overclassified recruits have a significantly lower average AFQT score than Tier 1 recruits. One-half of recruits overclassified to Tier 1 have AFQT scores of less than 50. A conservative estimate of the annual cost of the overclassification for recruiting and training replacements is $16 million.
We believe the credentials we identify in the recruit survey are more accurate than those in the DMDC files because recruits completed our survey soon after the “moment of truth”—when drill instructors press recruits to correct erroneous entries on their records, including their education records. We collected the survey by the second day of boot camp; the DMDC data are often captured months before. The Navy and the Army were not complying with the DOD standard of 10 percent for accessions in Tiers 2 and 3. After reclassifying recruits according to credentials reported on the survey, we found that during the year, recruits in Tiers 2 and 3 made up 19 percent of accessions in the Navy and 18 percent in the Army.
Attrition of home school and ChalleNGe recruits
We based our analysis on the recruit survey to avoid the credential misclassification in the DMDC files. We validated our attrition find-ings with regression analysis.
Home school graduates with AFQT scores of 50 and above have
tion levels comparable to HSDGs. At 12 percent, their average attri-tion rate is lower than that of private school graduates, only slightly higher than that of public school graduates, and more than 8 per-centage points lower than that of GEDs. Home school graduates with high AFQT scores are slightly less likely than HSDGs to leave early for misconduct and failure to adapt. Sixty-four percent of home school
recruits have an AFQT score of 50 or higher. Home school graduates with low AFQT scores, however, have relatively high attrition levels.
ChalleNGe GEDs have low attrition rates in the Army and Marine
Corps—the second and third lowest of their respective Tier 1 groups. In the Navy and Air Force, though, ChalleNGe GEDs have very high attrition rates—the highest of any education group in any tier. Although an AFQT score of 50 and above is associated with even lower attrition for ChalleNGe GEDs in the Army and Marine Corps, we did not find a large effect in the Navy and Air Force. ChalleNGe GEDs are more likely than HSDGs to separate for misconduct, failure to adapt, and defective enlistment (which includes erroneous entry, misrepresentation, and breach of contract).
The enlistment tiers do not always reflect the attrition patterns. Spe-cifically, two Tier 1 groups—one semester of college and adult educa-tion—have higher attrition than those holding a certificate from a correspondence school in each Service (a Tier 2 credential). At least one of these two groups in each Service has higher attrition than recruits holding a certificate from an occupational program or for high school attendance (also Tier 2 credentials).
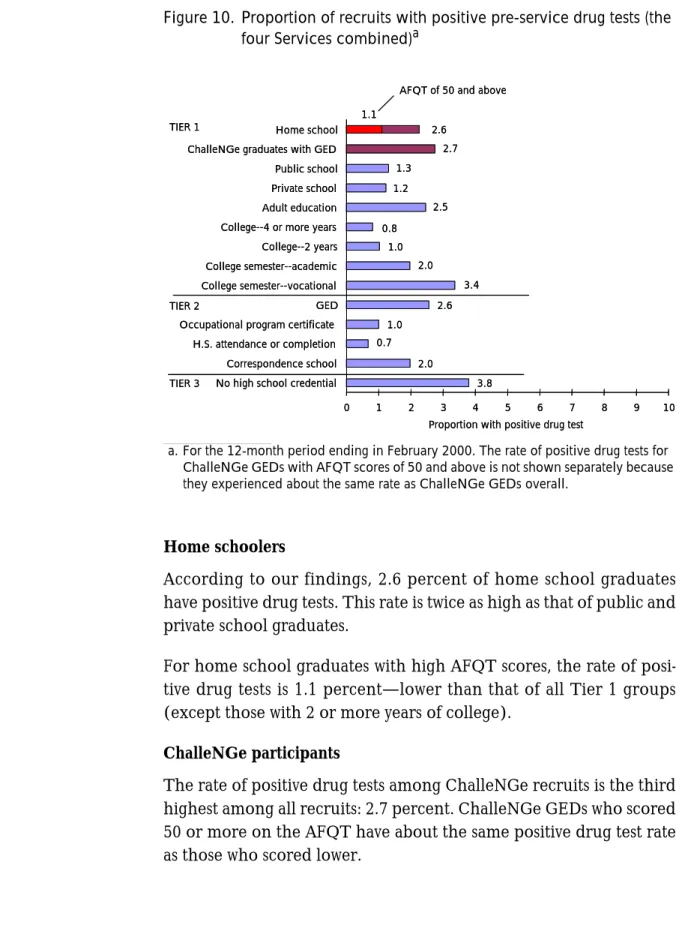
Other performance measures
Both home school and ChalleNGe GEDs have high rates of pre-ser-vice positive drug tests (2.6 percent and 2.7 percent, respectively, compared to 1.3 percent of public school graduates). Home school graduates with AFQT scores of 50 and above, however, have a lower rate of positive drug tests than public and private high school gradu-ates (1.1 percent).
The average AFQT score of both home school graduates and public school graduates is 59. ChalleNGe GEDs, on the other hand, have the lowest average AFQT score of any education category (50).
Interest in military service
Although home school youth have a low enlistment propensity for every Service, home schoolers express a higher interest in participat-ing in Junior Reserve Officers’ Trainparticipat-ing Corps (JROTC) than youth
in general. One way to boost home schoolers’ interest in military Ser-vice is to make JROTC programs available to them. A small minority of home schoolers indicated they had access to a JROTC program. In contrast to home schoolers, ChalleNGe youth—both current par-ticipants and program graduates—have an enlistment propensity for every Service that far exceeds that of the general youth population.
Recommendations
Based on our findings, we make the following recommendations:
•
DOD should consider placing home school graduates withAFQT scores of 50 and above in Tier 1, and the rest in Tier 2.
Home schoolers with high AFQT scores have low attrition, so the Services should place them in Tier 1. This recommendation is based on our 1-year tracking of the recruits and should, there-fore, be validated as the pilot program matures, enabling the tracking of recruits for a longer period.
•
Encourage JROTC units to reach out to home schoolers. TheServices should encourage JROTC units to reach out and accept qualified home schoolers. They should consider accept-ing applications from home school associations for JROTC charters.
•
The Army and Marine Corps should consider petitioning DOD to place ChalleNGe recruits in Tier 1. The Navy and Air Force should consider placing them in Tier 2. The Army and MarineCorps should seek to place ChalleNGe graduates with GEDs in Tier 1. In the Navy and Air Force, these recruits have high attri-tion, so these Services should seek to place them in Tier 2.
•
DOD should consider consolidating the oversight of educationcredentials to education specialists reporting directly to DOD.
Consolidation of the oversight of education credentials to edu-cation specialists reporting directly to DOD, rather than the individual Services, would promote more uniform standards and consistency. Education specialists working for DOD would
be more independent and in a better position to minimize mis-classifications than those reporting to the individual Services.
•
Conduct an inspection to determine the reasons for credentialmisclassification. It would be beneficial to determine the
rea-sons for the misclassification of recruits’ education credentials in the electronic personnel files. This can be done by compar-ing a sample of service (paper) records to the electronic records.
Introduction
Background
The Conference Report of the National Defense Authorization Act for Fiscal Year 1999 directed the establishment of a 5-year pilot pro-gram requiring the military Services to treat graduates of home schools and graduates of the National Guard Youth ChalleNGe Pro-gram holding General Education Development (GED) diplomas as Tier 1 for enlistment eligibility purposes [1]. The law limited the pro-gram to no more than 1,250 participants per Service per year for a combination of these two types of recruits.
The Department of Defense classifies enlisted accessions into three tiers based on their education credentials. Current DOD accession standards require that at least 90 percent of accessions be Tier 1, although the Services can set higher standards if they desire. Tier 1 recruits are primarily high school diploma graduates (HSDGs), Tier 2 recruits are primarily GEDs, and Tier 3 recruits are high school dropouts with no credentials.
The placement of home school graduates and ChalleNGe graduates with GEDs in Tier 1 is important because enlistment tiers are intended to be based on attrition characteristics—with Tier 1 recruits having the lowest attrition. HSDGs, who compose the bulk of Tier 1, have historically had relatively low attrition rates. Recruits in Tiers 2 and 3 generally have had higher attrition.
Another important reason for placing home school graduates and ChalleNGe Program graduates with GEDs in Tier 1 is the competition among the Services for Tier 1 recruits. Conversely, because the Ser-vices can bring in only a limited number of recruits in Tiers 2 and 3, these recruits are demand-constrained—only some of these appli-cants are able to join the military each year. Unless they obtain an enlistment waiver, recruits in Tiers 2 and 3 must score in the 50th or
higher percentile on the nationally normed Armed Forces Qualifica-tions Test (AFQT).
The law establishing the 5-year pilot program contained a require-ment that the governrequire-ment evaluate the program’s effectiveness. It also required a recommendation on the permanent tier status of the two types of recruits. For this purpose, the Directorate for Accession Policy, Office of the Assistant Secretary of Defense (Force Manage-ment Policy), asked CNA to assess how home school graduates and ChalleNGe graduates with GEDs compare to other recruits, particu-larly HSDGs. Specifically, they asked CNA to address the following:
•
Early separation rates•
Reasons for early separation•
Other measures of performance, such as positive results on drug tests•
Interest in military service•
Effective ways to attract qualified home school and ChalleNGe Program youth to the military.About home schooling
The first focus of our study is on home school recruits. There is no single governing body of home schoolers. Furthermore, there is no single definition of home schooling. To help delineate what consti-tutes home schooling, we conducted a nationwide survey of home school associations. The survey included questions about provision, supervision, and location of home school instruction. Our section on data and methodology in this document gives details on our survey of home school associations.
Instruction supervisors
Nearly all home school associations (98 percent) cited the parents as acceptable primary supervisors of the home instruction program. Also, 74 percent included a guardian; 51 percent, a grandparent; 27 percent, another teacher (not a member of the family); and 26 percent, a private school official. Other responses included other
relatives, a family friend, and a teacher from a public school. Respon-dents could select more than one response.
Instruction location
Virtually all home school associations cited the child’s home as an acceptable location for home instruction. However, 45 percent included another home; 31 percent, a place of worship; 24 percent, free or donated space; and 19 percent, a rented space. Furthermore, 18 percent of the associations indicated that a private school could be the primary location of the home school instruction.
To summarize, according to the home school associations, home schooling can occur in a number of locations and the instruction can be provided by a variety of individuals. This means that a wide range of situations, from a mother teaching one child in a private home to a teacher working with a group in a private school, may constitute home schooling.
Home schooling under state laws
We summarized the options and requirements home schoolers have under state laws using data collected by the Home School Legal Defense Association (as of March 2000). Appendix A contains these options and requirements in each state.
Legal options
Home schooling is legal in every state. Each state has at least one and as many as five different legal options for home schooling. We found that 34 states have an option to establish an independent home school. That is, these states allow families to home educate their chil-dren without having to be affiliated with or approved by a third party (such as a private school or the local school board).
Fifteen states allow individuals to operate a home school as a “private school.” These private schools do not need to be certified. In eight states, home schoolers have an explicit option to operate an “umbrella school”—a home school as an extension or satellite of a private school. An umbrella school may be a legally incorporated group of home school families.
Other legal options for home schooling are the use of a private tutor (seven states), the operation of a home school under a religious exemp-tion statute (six states) and under the auspices of a home school associ-ation (two states), and the provision of home instruction through an approved correspondence program (two states). A final option, avail-able only in California, is an independent study program through a public school or as a satellite of a private school.
Home schoolers have to meet a variety of state-mandated requirements concerning curriculum, notification to authorities, learning assess-ment, record keeping, and teacher qualifications.
Curriculum
Forty-three states require that specific subjects be taught in the home school program. Although most of these states specify the subject areas, other states require the same subjects as the public schools or subjects “as prescribed by the supervising program.”
Notifying authorities
Forty states require home schoolers to file a notice of intent with the local school superintendent, local school board, state department of education, or private school principal (required annually in most of these states). Other states require notification to authorities when with-drawing from a public school.
Assessment and testing
Thirty-one states have learning assessment requirements. Twenty-two of these states require standardized testing. Other states allow for the child to be evaluated by a qualified professional selected by the parents.
Record keeping
What records are home schoolers required to keep? Twenty-eight states have record-keeping requirements, including a portfolio (eight states), a transcript (six states), instruction plans (four states), and textbooks (two states).
Teacher qualifications
Twenty states require some form of teacher qualification, but most of these simply require a high school diploma, a GED, or proof that the instructor is “capable of teaching.” Eight states require a teacher certi-fication and two require a college education, but these states have other options, such as a religious exemption clause, with less stringent teacher qualifications.
In summary, in many states home school parents have several legal options to home educate their children. The legal requirements for home schoolers vary significantly across the states. The extent to which these requirements are enforced also varies significantly across the states.
Existing evidence about home schoolers
Number of home schoolers
According to a study by the U.S. Census Bureau [2], there were 790,000 home school students in the spring of 1999. A separate study by the U.S. Department of Education [3] placed the number at 850,000 for the same period. That is, home schoolers represented almost 2 percent of students in K–12 and approximately 15 percent of the privately schooled population.
Home schoolers’ grade level distribution approximates that of the general student population, according to the U.S. Department of Edu-cation study. Although the most common reasons for home schooling are dissatisfaction with the local schools and promoting religious val-ues, there are many reasons for families to home educate their children.
The home school population appears to be increasing rapidly. For example, according to another U.S. Department of Education study [4], the home school student population grew between 7 and 15 per-cent from 1995–96 to 1996–97 in the states for which reliable data were available.
Academic achievement
Based on academic test data, the National Home Education Research Institute (NHERI) found that, on average, home schoolers attained high scores on academic achievement tests. For example, home schoolers’ average scores were at or above the 80th percentile on read-ing, language, math, science, social studies, and study skills. In a review of eight separate studies, the home educated scored 8 to 35 percentile points above the average U.S. public school student on academic achievement tests [5].
Post-high-school experiences
The NHERI study found that, immediately after high school gradua-tion, home schoolers have the following experiences:
•
Military: Less than 1 percent•
Full-time, 4-year college: 25 percent•
Full-time employment: 17 percent•
Combination of education and employment: 12 percent•
Part-time employment: 10 percent•
Full-time community college: 8 percent•
Trade or business school: 2 percent•
Unknown/not defined: 25 percent.In comparison, 3 percent of all U.S. high school graduates and GED recipients entered the military (within 2 years). Twenty-two percent enrolled in a post-secondary school on a full-time basis, 34 percent went into full-time employment, and 33 percent went into part-time employment [6]. Thus, home schoolers are more likely than high school graduates and GED recipients to pursue post-secondary studies.2
2. If home schoolers for whom post-high-school experiences are unknown attend college at the same rate as other home schoolers, the percentage of home schoolers going to college full time after high school is 41 per-cent.
About the ChalleNGe Program
The second focus of our study is on graduates of the National Guard Youth ChalleNGe Program holding GEDs. The ChalleNGe Program targets “at risk” youth who are high school dropouts or expellees between the ages of 16 and 18 and who are not in trouble with the law (not on parole or probation). It consists of a 22-week residential phase conducted in a quasi-military environment, followed by a men-toring phase.
Program goals
Congress initially authorized the ChalleNGe Program in FY 1993. The stated goal of the program is to improve participants’ employment potential and life skills. Subjects covered may include financial man-agement, sex education, and drug avoidance.
Another goal of the ChalleNGe Program is to help participants— referred to as “cadets”—obtain a GED through instructor-led and computer-based GED instruction. The National Guard Bureau man-ages the ChalleNGe Program through agreements with state governors.
Cadets receive free classroom instruction, room and board, and a small weekly allowance for personal expenses. The program pays the fees for participants to take the GED exam. Cadets perform volunteer work for the local communities.
The residential phase is divided into a 2-week pre-ChalleNGe compo-nent and a 20-week ChalleNGe compocompo-nent. The objective of the pre-ChalleNGe component is to provide program staff the opportunity to identify applicants who are motivated to complete the entire pro-gram. ChalleNGe Program eligibility standards require that partici-pants be free from use of illegal substances.
The ChalleNGe Program is the only multi-state, residential youth pro-gram with a military focus. The organization is similar to military boot camp. Cadets form platoons, march, and engage in intensive physical training. After the residential program, many of the program
graduates establish a relationship with a mentor that may last for up to a year.
Twenty-six states and territories participated in the ChalleNGe Pro-gram in 2000. A total of 4,500 students graduated from the proPro-gram during the period, for a cumulative total of more than 25,000 since the inception of the program [7]. Cadets most commonly cite the desire to obtain a GED and to develop self-discipline as the main rea-sons to join the program.
Post-graduation experiences
Two years after graduation from the program, ChalleNGe youth report the following experiences [7]:
•
Military: 29 percent•
Employment: 33 percent•
A combination of employment and education: 13 percent•
Two-year college: 13 percent•
Four-year college: 7 percent•
Vocational training: 5 percent.ChalleNGe Program graduates are 9 times more likely than high school graduates and regular GED recipients to enter the military.
Data and methodology
Sources of data
To identify education credentials earned, we administered a survey to a large sample of new recruits. To assess the level of interest in military service among home school and ChalleNGe youth, we conducted a special collection of the Youth Attitude Tracking Study (YATS). Finally, to assess how military recruiters can reach out to home school graduates, we conducted a survey of home school associations.
Survey of recruits
We administered the Survey of Recruits’ Education and Background to a large sample of new recruits who enlisted during the 12-month period ending in February 2000. We pre-tested the questionnaire with about 600 recruits at the Marine Corps Recruit Depot in Parris Island, South Carolina, and at several Army basic training sites. We then administered the survey at all basic training sites for the four Services.
Recruits completed the survey during in-processing, by the second day of boot camp. This allowed us to identify those recruits whose sep-aration began on arrival at boot camp because of medical tests and disclosures they made to drill instructors. Appendix B contains a copy of the recruit survey instrument.
Why did we need a recruit survey? First, we wanted to verify the edu-cation credentials on the electronic personnel files maintained by the Defense Manpower Data Center (DMDC). The education data resid-ing on the DMDC files are often captured months before recruit training begins. In the interim, from data entry to the start of recruit training, many recruits complete education credentials—these recently earned education credentials may not appear at all in the DMDC files.
Second, each of the Services has a “moment of truth” at boot camp that gives recruits the chance to correct erroneous entries in their records. These corrections sometimes involve educational back-grounds, and we doubted these changes were reflected in the elec-tronic files.
Furthermore, we needed the recruit survey especially for identifying all home school graduates. For example, home schoolers who partic-ipate in instructor-led “umbrella schools” may erroneously appear as HSDGs on the DMDC files. Many home schoolers attend umbrella schools to enroll in courses that the parents do not feel comfortable teaching.
In addition, many home schoolers in California participate in classes and activities in public high schools and obtain a high school diploma from the school. These home schoolers would appear as HSDGs, not as home schoolers, on the personnel files. Finally, the Marine Corps codes home schoolers differently from the other Services. For all of these reasons, it was not possible to identify all home schoolers in the DMDC data.
We collected 67,091 surveys from enlisted active duty recruits—more than one-third of all recruits during the year—from each Service as follows:
•
Army: 24,172 (March 1999 to August 1999)3•
Navy: 17,547 (September 1999 to February 2000)•
Air Force: 14,877 (May 1999 to December 1999)•
Marine Corps: 10,495 (May 1999 to January 2000).Because it was impractical to review the actual paper education cre-dentials during our survey, we asked several questions about the type of credentials received. To examine attrition levels and other perfor-mance measures, we matched the recruit survey data to these DMDC
3. The U.S. Army Research Institute for the Behavioral and Social Sciences (ARI) generously integrated our survey items into their Soldier Recep-tion Survey.
personnel files: the active duty file, the active duty loss file, and the Military Entrance Processing Command (MEPCOM) edit file.4 In addition to questions concerning education credentials, the recruit survey asked about disciplinary problems in high school and pre-service smoking. It also asked for self-reported measures of per-sonal drive, responsibility, and importance given to physical fitness, among other things.
Sample
We screened out all recruits with prior service (53 individuals) from our sample. We also screened out home school recruits who entered the Navy between March 1999 (the first month of the recruit survey) and July 1999 (inclusive). We did this because of concerns that the Navy may have admitted high school dropouts claiming to be home schooled during the early months of the pilot program. The Navy issued tighter guidelines for home school accessions at the end of July 1999.
We made other minor alterations to the data. Seventy-eight individu-als had missing or out-of-range AFQT scores. To account for this, we created a variable to indicate “missing AFQT score” and assigned the mean AFQT score (58.9) to these individuals.
In addition, we recoded the records of 50 recruits who left the Service and reenlisted immediately. These individuals most likely entered officer programs. We identified these cases as continuation of service, rather than attrition.
We asked recruits in the recruit survey to indicate the type of school they attended for each finished grade from 1 to 12. We screened out 386 records for recruits who skipped this question completely. For recruits who indicated the type of school for the last year completed only, we assumed they attended the same type of school for all grades.
4. We successfully matched 96 percent of the surveys to the active duty file. Most of the unmatched surveys were for reservists, who were beyond the scope of this study.
In some cases, recruits reported attending two different types of schools in the same year. In this case, we assumed the recruit switched schools during the year and gave credit to the “new” type of school. For example, a recruit indicated “public school” for the first 10 years, but marked “public school” and “GED” for the 11th grade. In this case, we inferred that the recruit completed 10 years of public school, began but did not complete 11th grade, and then earned a GED. We were unable to assign 552 recruits to any educational category because their surveys contained other types of incomplete or contra-dictory information. For example, some of these recruits listed a diploma from a traditional high school but also indicated they have no diploma. We assigned all these recruits to an “other education” category.
How did we identify home school graduates?
We identified recruits as home school graduates if they satisfied the following four conditions:
•
Hold a diploma from parents, tutors, an association, or an umbrella school for home schooling•
Completed 12th grade at home (or graduated early after being schooled at home)•
Were not expelled from high school•
Completed 2 or more years of home schooling.We identified home school graduates this way based on the responses to our survey of home school associations (described later). We sought to avoid classifying as home schoolers individuals who were expelled or urged to leave their public high school. A general charac-teristic of home schooling is that the parents—not school or govern-ment officials—control the curriculum. Appendix C includes the detailed data algorithm we used to identify home school graduates. We counted the number of years of schooling completed at home. Of the 67,091 recruits surveyed, 1,960 had been schooled at home at some point between grades 1 and 12. Nearly half of these (817) reported only 1 year of classes at home. In comparison, 292 reported
that they completed 4 or more grade levels at home. We identified a total of 565 home school graduates in our sample.
Youth Attitude Tracking Study (YATS)
The YATS is a comprehensive, nationally representative survey of American youth aimed primarily at assessing the likelihood that they will enlist in the military. Because the available YATS data did not con-tain enough observations on our two groups of interest for us to assess their interest in military service, we conducted a special collection of the YATS.
We conducted telephone interviews with 439 home schoolers and 357 ChalleNGe Program participants (including 110 program graduates). The men and women interviewed were 16 to 21 years old at the time. We conducted the interviews in October–November 2000, two years after the pilot program placed these groups in Tier 1.
To make the samples consistent with the regular YATS, we excluded youth who were or had been in the military, or who were waiting to leave for basic training. In addition, we excluded youth attending a military service academy or participating in a college Reserve Officers’ Training Corps (ROTC) program.
To compare the home school and ChalleNGe youth with the general youth population, we combined our YATS data with the 1999 regular YATS (the latest available). We used about 60 percent of the items from the 1999 regular YATS questionnaire in our survey.5 Westat, Inc., conducted the telephone interviews as our contractor.6
Home school youth
The home school population overall is largely evangelical Christian. According to survey results in [5] and [8], 83 percent of home school-ers are evangelical Christian. Also, an estimated 80 percent of home schoolers belong to an association or support group [9].
The home school sample we obtained differed somewhat from the overall home school population. In our YATS sample of home
schoolers, 90 percent were evangelical Christian and 89 percent were affiliated with a home school association or support group. We obtained our sample of home school youth from the National Home Education Research Institute.
To reflect the characteristics of the overall home school population, we applied weights to our sample. We weighted more heavily the responses from nonevangelical Christians and those not affiliated with a home school association. See appendix D for the method we used to apply sample weights to the survey responses.
Our home school youth sample included respondents from 40 states. They represented all employment situations: currently employed, not employed but looking for work, and not employed and not looking for work (including full time secondary-level and college students).
ChalleNGe youth
Cadets. We interviewed cadets actively participating in the ChalleNGe
program in October–November 2000 whose social security numbers ended in “2” or “4.” This produced a large enough random sample to satisfy our requirement. All respondents, however, were expected to graduate from the program and earn a GED. Cadets were from each of the 24 states with an operational ChalleNGe Program at that time.
Program graduates. We also interviewed ChalleNGe Program graduates
to determine whether interest in military service changes significantly after graduation from the program. We obtained our sample of pro-gram graduates from the ChalleNGe Monitoring and Evaluation Information System (CHAMEIS), the program’s administrative
6. We made 79 telephone calls to home schoolers that did not produce complete interviews. The primary reasons were that we had incorrect or nonworking phone numbers or that the youth refused the interview or ended the interview before completion. For ChalleNGe cadets, we made 11 telephone calls that did not result in complete surveys. The pri-mary reason was that the youth was no longer in the program. Finally, we made 155 telephone calls to ChalleNGe Program graduates that did not result in interviews. The primary reasons were that we had nonwork-ing numbers, that we could not contact the youth at the number pro-vided, or that the youth was above the age limit for the interview.
database. To produce a random sample, we interviewed graduates whose social security numbers ended in “2” only. The final sample included ChalleNGe graduates in each state with a program site at the time.
Survey of home school associations
To gather information about what constitutes home schooling, we conducted a survey of home school associations in April 2000. This survey helped us identify effective ways for military recruiters to reach out to home schoolers. Appendix E contains a copy of the instrument we used for this survey.
We mailed questionnaires to the heads of all statewide associations listed on two prominent home schooling Internet sites in December 1999.7 We also mailed questionnaires to a sample of heads of local support groups from each state that had at least one of these organi-zations listed on the Internet sites.
Home school associations and support groups allow families to pool resources, swap educational materials, share ideas, and provide socialization opportunities for the children (for example, through field trips and sports events). The associations are often statewide (or cover multiple states) and may have local support groups as affiliates. We mailed 606 questionnaires; 22 surveys were returned to us as undelivered. The response rate from the remaining surveys was 51 percent.
Responses
The responses to our association survey reflect the opinions of home school leaders nationwide. The sample included organizations in all 50 states, covering large cities, small towns, and rural areas. The sample included 127 associations (21 percent) that were not affiliated with the Home School Legal Defense Association (HSLDA), the larg-est home school advocacy group.
7. The two Internet sites were Homeschool World (www.home-school.com) and A to Z Home’s Cool (www.gomilpitas.com/home schooling).
The associations were diverse in religious orientation, home school philosophy, and characteristics of the members. Of the 606 associa-tions in our sample, we identified 490 (or 81 percent) as evangelical Christian. The remaining 116 associations (19 percent) were identi-fied as something other than evangelical Christian or were not iden-tifiable in terms of religious orientation.
The response rate for the associations affiliated with the HSLDA was 52 percent. For the other associations, the response rate was 34 per-cent. That is, the non-HSLDA associations made up 13 percent of all the responses. To reflect the 21-percent representation of non-HSLDA associations in the population, here again we weighted the sample. (See appendix D for the method we used to weight the sample.)
Method of analysis
Classification of recruits
We matched our recruit survey data to DMDC personnel files and found that the educational credentials coded in the personnel files often differed from those reported by the recruits themselves.8 We believe the recruit surveys are more accurate for several reasons. First, we administered the survey by the second day of in-processing at boot camp, so we expect the information to be more up-to-date than what was reported at an earlier date. Second, recruits completed our survey soon after going through “the moment of truth,” when drill instructors press recruits to be honest about their personal records, including their education.
8. We compared the education credentials that recruits reported to us in the survey with DMDC’s two-digit education code. This code identifies home schoolers with a “25” and ChalleNGe graduates with a GED with a “27.” We also had DMDC’s alphanumeric code for education creden-tials. We found that DMDC’s numeric code was more up-to-date than the alphanumeric code. For example, many recruits classified as “high school senior” by the alphanumeric code were classified as HSDGs in the numeric code, reflecting the fact that most of the high school seniors graduated before starting boot camp.
Furthermore, we believe the education credentials in our recruit survey data to be more accurate because, as our findings will show, recruits’ AFQT scores and subsequent attrition behavior validate the self-reported education credentials. Finally, recruits had little incen-tive to misrepresent their credentials on the survey.
We separated recruits for whom the DMDC files misclassified their education credentials into “overclassified” and “underclassified.” Spe-cific definitions follow:
•
Overclassified. We identify recruits as being overclassified ifpersonnel files report a credential that puts them in a higher tier than the credential they report to us in the survey. The DMDC personnel files can overclassify recruits in one of the fol-lowing ways:
— Overclassified from Tier 3 to Tier 1. For example, a recruit appears as an HSDG in the DMDC files but reported to us on the survey as having no credential at all.
— Overclassified from Tier 3 to Tier 2. For example, a recruit appears as a GED holder in the DMDC files but reported to us in the survey as having no credential.
— Overclassified from Tier 2 to Tier 1. For example, a recruit appears as an HSDG in the DMDC files but reported to us as having a GED only.
•
Underclassified. We identify recruits as being underclassified ifthey reported to us in the survey an education credential that qualifies them for a higher enlistment tier than that appearing in the DMDC file. For example, a recruit reports to us in the survey that he has a regular high school diploma, but his elec-tronic personnel file may indicate that he has a certificate for high school attendance (a Tier 2 credential).
Attrition levels
Premature separation from military service is costly because the Ser-vices need to recruit and train replacements. Research on attrition has consistently found that early separation is higher among recruits who have failed to earn a high school diploma [10]. Enlisting HSDGs is a primary recruiting goal.
Measures of attrition
We established a baseline measure of attrition at the 12-month point, that is, we checked to see if the recruit was still in the military one year after entry. We used 12-month attrition measured in December 2000, the most recent period available. We were able to define attrition for recruits we surveyed before December 1999 only (58,951 recruits). A significant proportion of first-term attrition occurs within the first year and differences in end-of-contract attrition rates tend to be con-sistent with those observed early. Thus, our 12-month attrition rate is an appropriate performance measure.
Comparing attrition rates between two Services is not valid because we collected the recruit survey data at different times of the year for each Service. For example, the Army data cover the first 6 months of the 12-month period ending in February of 2000, whereas the Navy data cover the last 6 months.
We express the recruiting totals for the full 12-month period ending in February 2000 by making adjustments for seasonality. For each cre-dential and Service, we multiplied the number of recruits identified in the survey by the following ratio: the number of recruits identified by DMDC for the 12-month period divided by the number of recruits identified by DMDC for the same period for which we have survey data (about 6 months per Service).
Thus, for example, if one of the Services front-loaded a particular group of recruits for the period in which we have recruit survey data, the adjustment factor would prevent an unreasonably high estimate of the annual number of this group.
Because DMDC home school data from October 1998 through August 1999 for the Navy were suspect, we used a scale factor based on overall number of recruits for the 12-month period divided by the number of records in the recruit survey.9
9. We also used this scale factor to determine the total number of individ-uals holding an occupational program certificate in the Army and Marine Corps because the DMDC numbers were too small (less than 10 recruits each).
Regression analysis
To understand the factors that affect attrition, we performed regres-sion analysis. In addition to the education credential—which includes home school diplomas and graduation from the ChalleNGe Program with a GED—we controlled for other personal and back-ground variables. These variables included the following:
•
Possession of an enlistment waiver•
AFQT score•
Self-reported importance of various qualities, including patrio-tism, responsibility, and personal drive•
Self-reported levels of pre-service smoking and drinking•
Participation in high school extra-curricular activities•
Age•
Race and ethnicity•
Marital status•
Military occupation.Regression analysis allows us to examine the effect of each variable, independent of the effect of the other variables. It allows us to exam-ine the effect of a specific education credential while holding con-stant other variables.
Reasons for attrition
Recruits separate from military service before expiration of their term of enlistment for many reasons. Using the DOD separation codes, we grouped the reasons into the following categories:
•
Medical. These losses pertain to recruits who are separatedbecause of a disqualifying health problem or disability that the Service did not previously know about. Examples of disqualify-ing health problems are asthma and diabetes. They also include losses resulting from injuries and illnesses occurring during enlistment.
•
Fitness failure. This includes failure to satisfy weight and fitnessstandards.
•
Misconduct. In some cases, recruits are separated because ofdrug and alcohol abuse, desertion, and dereliction of duty.
•
Failure to adapt. This includes personality disorders andunsatis-factory performance, among other reasons.
•
Defective enlistment. This covers erroneous and fraudulent entry(such as for pre-service alcohol and drug abuse, misrepresenta-tion, and breach of contract).
•
Other and unknown loss reasons. This includes other types oflosses affecting relatively few recruits, such as family care and admission of homosexuality. It also includes losses for unknown reasons.
We should point out that the accuracy of the DOD loss codes is ques-tionable. In some cases, the assigned code reflects convenience rather than the real reason for the loss. Nevertheless, summarizing the loss codes across the Services sheds some light on why home school and ChalleNGe recruits leave early. Appendix F contains our detailed categorization of the personnel losses.
Using a DMDC data file, we identified recruits who tested positive for drugs. Recruits were tested at the MEPCOM, but the results were not known until after the recruits were in boot camp. Recruits with posi-tive drug tests received a discharge or an enlistment waiver.
Interest in military service
To assess the level of interest in military service among youth in our two groups of interest, we calculated their “enlistment propensity” from our YATS. Enlistment propensity measures the proportion of youth who answered “Definitely” or “Probably” when asked: “How likely it is that you will be serving in the military or a specific Service within the next few years?”
Education credentials of recruits
The military Services enlisted 183,895 non-prior-service active duty recruits in the year ending in February 2000 (the period for which we had recruit survey data). The numbers by Service were as follows:
•
Army: 69,093•
Navy: 52,404•
Air Force: 30,796•
Marine Corps: 31,602.The overall numbers of recruits who are home school graduates and ChalleNGe graduates with GEDs are very small. Based on our recruit survey for the year ending in February 2000, all Services combined enlisted 1,533 home school graduates (0.8 percent of the total) and 752 ChalleNGe GEDs (0.4 percent of the total).
The combined number of home school and ChalleNGe recruits was well below the 5,000 annual goal (1,250 per Service) put forth by the law establishing the pilot program. Table 1 shows the distribution of education credentials under each tier for enlisted recruits in each Service according to our survey and DMDC files.
Home schoolers
The percentage of non-prior-service enlisted accessions composed of home schoolers in each Service for the year ending in February 2000 follows (in descending order):
•
Navy: 1.2 percent•
Air Force: 1.0 percent•
Army: 0.6 percentChalleNGe participants
The percentage of accessions made up of ChalleNGe GEDs in each Service follows (again in descending order):
•
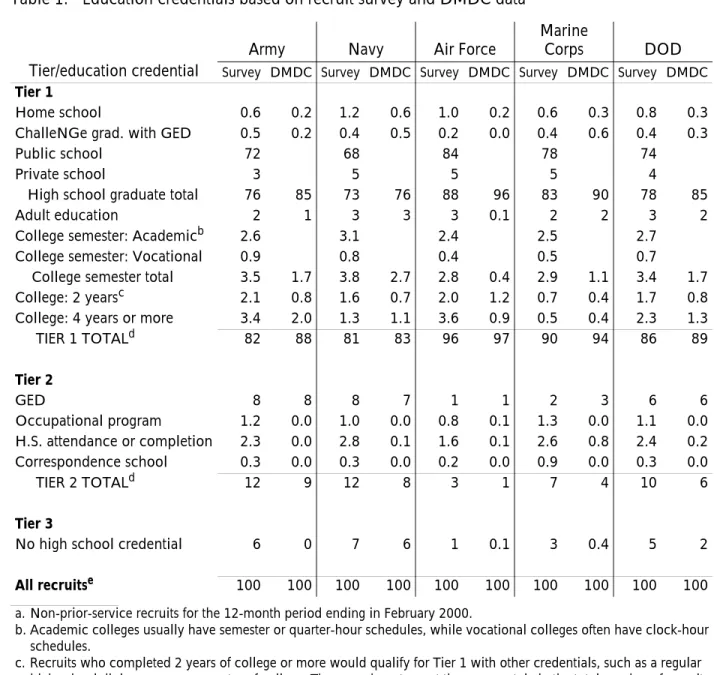
Army: 0.5 percentTable 1. Education credentials based on recruit survey and DMDC dataa
Army Navy Air Force Marine Corps DOD
Tier/education credential Survey DMDC Survey DMDC Survey DMDC Survey DMDC Survey DMDC
Tier 1
Home school 0.6 0.2 1.2 0.6 1.0 0.2 0.6 0.3 0.8 0.3
ChalleNGe grad. with GED 0.5 0.2 0.4 0.5 0.2 0.0 0.4 0.6 0.4 0.3
Public school 72 68 84 78 74
Private school 3 5 5 5 4
High school graduate total 76 85 73 76 88 96 83 90 78 85
Adult education 2 1 3 3 3 0.1 2 2 3 2
College semester: Academicb 2.6 3.1 2.4 2.5 2.7
College semester: Vocational 0.9 0.8 0.4 0.5 0.7
College semester total 3.5 1.7 3.8 2.7 2.8 0.4 2.9 1.1 3.4 1.7
College: 2 yearsc 2.1 0.8 1.6 0.7 2.0 1.2 0.7 0.4 1.7 0.8
College: 4 years or more 3.4 2.0 1.3 1.1 3.6 0.9 0.5 0.4 2.3 1.3
TIER 1 TOTALd 82 88 81 83 96 97 90 94 86 89 Tier 2 GED 8 8 8 7 1 1 2 3 6 6 Occupational program 1.2 0.0 1.0 0.0 0.8 0.1 1.3 0.0 1.1 0.0 H.S. attendance or completion 2.3 0.0 2.8 0.1 1.6 0.1 2.6 0.8 2.4 0.2 Correspondence school 0.3 0.0 0.3 0.0 0.2 0.0 0.9 0.0 0.3 0.0 TIER 2 TOTALd 12 9 12 8 3 1 7 4 10 6 Tier 3
No high school credential 6 0 7 6 1 0.1 3 0.4 5 2
All recruitse 100 100 100 100 100 100 100 100 100 100
a. Non-prior-service recruits for the 12-month period ending in February 2000.
b. Academic colleges usually have semester or quarter-hour schedules, while vocational colleges often have clock-hour schedules.
c. Recruits who completed 2 years of college or more would qualify for Tier 1 with other credentials, such as a regular high school diploma or one semester of college. Thus, we do not count them separately in the total number of recruits. d. Totals may not add to the precise number because of rounding.
e. The number of accessions for this 12-month period includes 1,562 recruits (less than 1 percent of the total) for whom we had incomplete education credential data.
•
Navy: 0.4 percent•
Marine Corps: 0.4 percent•
Air Force: 0.2 percent.Other recruits
According to our recruit survey, the Army and the Navy were not com-plying with the DOD-established goal of up to 10 percent of acces-sions in Tiers 2 and 3. During the year, recruits in Tiers 2 and 3 made up 12 and 6 percent of the Army’s accessions, respectively. In the Navy, recruits in Tiers 2 and 3 represented 12 and 7 percent.
In the Air Force, recruits in Tiers 2 and 3 made up 3 and 1 percent of the total. In the Marine Corps, recruits in Tiers 2 and 3 made up 7 and 3 percent. Furthermore, in the Air Force and Marine Corps, GEDs represented less than one-third of Tier 2. In the Army and the Navy, GEDs made up about two-thirds of Tier 2.
The Air Force has the highest percentage of HSDGs (88 percent), fol-lowed by the Marine Corps (83 percent). In the Army and the Navy, 76 and 73 percent of recruits are HSDGs, respectively.
The number of enlisted recruits with college degrees is small. Recruits with 2 years of college make up from less than 1 percent of the total in the Marine Corps to 2 percent in the Army. Recruits with 4 years of college or more make up from less than 1 percent of the total in the Marine Corps to 4 percent in the Air Force.
Findings
Misclassification of recruits
According to our survey, many recruits who are listed as Tier 1 in the personnel files should be classified as Tier 2 or 3.10 From the match of the recruit survey to the DMDC personnel files, we found that per-sonnel files overclassify 8 percent of recruits for the four Services combined. On the other hand, personnel files underclassify 2 per-cent of recruits (see figure 1).11
The degree of overclassification to Tier 1 varies by Service. In the Navy, 8 percent of all recruits are overclassified into Tier 1—the high-est rate of the four Services. The Air Force overclassifies the fewhigh-est recruits into Tier 1, 4 percent. The Army and Marine Corps overclas-sify 5 percent and 7 percent of recruits into Tier 1, respectively. Most recruits overclassified to Tier 1 report to us in the survey that they have a Tier 2 credential, often a GED.
Overclassification to Tier 2 is highest in the Army, involving 3 percent of recruits. It is lowest in the Air Force, where only 0.1 percent of recruits are placed in Tier 2 incorrectly. The Navy and Marine Corps each overclassifies 1 percent of recruits into Tier 2.
10. The Military Enlistment Processing Reporting System (MEPRS) collects and documents information about applicants, including their educa-tion credentials. The Military Entrance Processing Command (MEP-COM) maintains the MEPRS.
11. We also observed within-tier misclassification in some cases. That is, the education credential in the DMDC files did not match the credential they reported to us in the survey, but both credentials qualified the recruit for the same enlistment tier. For example, a recruit appeared as an HSDG in the DMDC files, but reported to us in the survey having an adult education diploma.
Underclassification of recruits’ education credentials also occurs, although to a smaller degree than overclassification. Underclassifica-tion is highest in the Navy, affecting 3 percent of recruits. The Army underclassifies 1 percent of recruits. The Air Force and the Marine Corps have the lowest underclassification rates, each slightly less than 1 percent.
Although both the recruit survey and the DMDC file are likely to con-tain occasional errors, we expect random errors would produce about equal amounts of overclassification and underclassification. Here again we point out that, when the two sources disagree, we believe the recruit surveys are more accurate for two main reasons. First, we col-lected the recruit survey data by the second day of boot camp so we expect the information to be more accurate than what was reported at an earlier date. Second, recruits completed our survey soon after going through “the moment of truth,” when recruits are pressed to be honest about their personal records, including their education.
Figure 1. Percentage of recruits whose education credentials are mis-classified in the DMDC filesa
a. For the year ending in February 2000. 0 4 8 12 16 20
DOD Overall Army Navy Air Force Marine
Corps
Percentage of recruits misclassified
Underclassified (total)
Overclassified from Tier 3 to Tier 2 Overclassified from Tier 2 to Tier 1 Overclassified from Tier 3 to Tier 1
0 4 8 12 16 20
DOD Overall Army Navy Air Force Marine
Corps
Percentage of recruits misclassified
Underclassified (total)
Overclassified from Tier 3 to Tier 2 Overclassified from Tier 2 to Tier 1 Overclassified from Tier 3 to Tier 1
Why does overclassification occur?
Although it is possible that some of the overclassification constitutes fraud on the part of recruits and recruiters, we are not able to deter-mine to what extent this is the case. Another possible reason for over-classification from Tier 2 to Tier 1 is the proliferation of alternative education credentials from an ever-increasing array of institutions. Alternative credentials are not always easy to distinguish from regu-lar high school diplomas. For example, some states issue GED diplo-mas that look exactly like regular high school diplodiplo-mas. In some cases, the only difference is a set of digits on the document whose sig-nificance is not readily apparent.
Why would states issue such confusing education credentials? One possible reason is that states have an economic incentive to make as much of the workforce as possible appear to have regular high school diplomas. Investors may consider such statistics when choos-ing a locality for startchoos-ing or relocatchoos-ing a business.
Why does underclassification occur?
One possible explanation for personnel files to underclassify recruits is that some survey respondents exaggerate their educational attain-ment. However, we find mostly the opposite: recruits report having lower levels of education than personnel files indicate.
A second possible explanation for underclassification is that the DMDC data are often captured months before the start of basic train-ing. Therefore, the education data in the DMDC files may not always be up-to-date.12
12. We assume that all recruits DMDC identified as high school seniors earned a high school diploma. If some of these recruits actually dropped out of high school, this would help explain the overclassifica-tion. However, this does not explain the degree of overclassification we find because it affects less than 1 percent of the sample and, almost cer-tainly, most of these recruits finished high school before starting boot camp.
How do overclassified recruits behave?
How big a problem is recruit overclassification? If recruits who are overclassified to Tier 1 behave like recruits who report having Tier 1 credentials, then overclassification has minimal policy implications. We find, however, that recruits overclassified to Tier 1 do not behave like others in Tier 1—they behave like recruits in Tiers 2 and 3. This is very important for two reasons. First, it has significant policy impli-cations. Second, it validates our use of the recruit survey to identify education credentials.
Attrition of overclassified recruits
We find that recruits who appeared in the DMDC files as Tier 1 but reported to us that they have a GED or no credential had higher attrition than recruits classified as Tier 1 in both the recruit survey and DMDC files.
For the four Services combined, the 12-month attrition rate for recruits overclassified to Tier 1 is 17 percent (see figure 2). For recruits classified as Tier 1 in both the survey and the DMDC files, the attrition rate is only 10 percent. Furthermore, we found that the attri-tion rate of recruits overclassified to Tier 1 is as high as that of high school dropouts.
Attrition for recruits overclassified to Tier 1 is relatively high in each Service. In the Navy, recruits overclassified to Tier 1 have an attrition rate that is 10 percentage points higher than that of “true” Tier 1 recruits. In the Air Force and Marine Corps, the difference is 5 per-centage points, and in the Army, it is almost 1.5 perper-centage points.
AFQT scores of overclassified recruits
Recruits whom the DMDC files identify as Tier 1, but who report to us in the survey that they have a GED or no credential, also fail to look like Tier 1 recruits in terms of their AFQT scores. We find that these overclassified recruits had a significantly lower average AFQT score than recruits who appeared as Tier 1 in the DMDC files and in the recruit survey (see figure 3).
Figure 2. Twelve-month attrition rates for recruits overclassified to Tier 1 in the DMDC filesa
a. Tracked through December 2000.
Figure 3. AFQT scores of recruits our survey identified in Tiers 2–3a
a. Non-prior-service accession who entered in the 12-month period ending in February 2000. 27 12 17 17 7 12 10.3 17 8.9 10 0 5 10 15 20 25 30 35 40 DOD overall
Army Navy Air Force Marine
Corps
12
-month attrition rates
Recruits overclassified to Tier 1
Recruits in Tier 1 in both the survey and DMDC file
27 12 17 17 7 12 10.3 17 8.9 10 0 5 10 15 20 25 30 35 40 DOD overall
Army Navy Air Force Marine
Corps
12
-month attrition rates
Recruits overclassified to Tier 1
Recruits in Tier 1 in both the survey and DMDC file
0 2 4 6 8 10 31-39 40-49 50-59 60-69 70-79 80-89 90-99 AFQT score
Number of recruits (in 1,000s)
0 2 4 6 8 10 31-39 40-49 50-59 60-69 70-79 80-89 90-99 AFQT score
Forty-nine percent of recruits overclassified to Tier 1 have AFQT scores of less than 50. These recruits would not qualify for Tier 2–3 enlistment.
Cost of recruit overclassification
Overclassification of recruit education credentials is costly. It involves the Services bringing in recruits with higher attrition than other recruits in the same Tier. Based on a notional $30,000 cost of recruiting and training replacements, overclassification costs DOD $16 million a year. This is likely to be a conservative estimate because it is based on 1-year attrition rates. The cost is higher if the attrition rate gap of over-classified recruits gets wider over time.
Overclassified recruits’ low AFQT scores are also costly. Recruits with weak academic preparation impose a readiness cost because they are less trainable. Other things equal, they are also likely to be less produc-tive at work.
To summarize, recruits whom the DMDC files identify as Tier 1 but who report to us in the survey that they have a GED or no credential at all
do not behave like Tier 1 recruits. These overclassified recruits have
signif-icantly higher attrition and lower AFQT scores than Tier 1 recruits. Overclassification of recruits costs DOD at least $16 million a year.
Attrition
Figures 4 through 8 show the 12-month attrition rates for recruits in the different education categories for the four Services combined and in each branch. Our findings corroborate the importance of education credential as a screening tool for military applicants.
Although overall DOD attrition rates based on the recruit survey do not differ dramatically from those based on the DMDC files, there are notable differences for some education categories in specific Services. The findings we show next are based on the recruit survey to avoid the credential misclassification in the DMDC files.13 Appendix G provides the attrition rates by education credential for each Service.
13. As we indicated earlier, it is not valid to compare attrition rates across the Services based on our recruit survey data because we administered the recruit survey at different times of the year in each Service.
Figure 4. Twelve-month attrition rates—the four Services combineda
a. Non-prior-service recruits tracked through December 2000.
Figure 5. Twelve-month attrition rates—Armya
a. Non-prior-service recruits tracked through December 2000. The Army attrition rate for home school graduates with AFQT scores of 50 and above is not shown separately because they experienced about the same attrition rate as home school graduates overall. 17 11 14 12 15 11 13 16 8 10 15 17 21 14 17 21 0 5 10 15 20 25 30 35 40
No high school credential Correspondence school H.S. attendance or completion Occupational program certificate GED College semester--vocational College semester--academic College--2 years College--4 or more years Adult education Private school Public school ChalleNGe graduates with GED Home school
12-month attrition rates AFQT of 50 and above
361; 565 1,063 51,149 2,941 1,529 106; 253 1,091 1,765 451 3,182 757 1,020 205 2,722 Sample size (n) TIER 2 TIER 3 TIER 1 17 11 14 12 15 11 13 16 8 10 15 17 21 14 17 21 0 5 10 15 20 25 30 35 40
No high school credential Correspondence school H.S. attendance or completion Occupational program certificate GED College semester--vocational College semester--academic College--2 years College--4 or more years Adult education Private school Public school ChalleNGe graduates with GED Home school
12-month attrition rates AFQT of 50 and above
361; 565 1,063 51,149 2,941 1,529 106; 253 1,091 1,765 451 3,182 757 1,020 205 2,722 Sample size (n) TIER 2 TIER 3 TIER 1
AFQT of 50 and above
7 5 11 9 10 11 12 9 5 10 8 9 3 10 0 5 10 15 20 25 30 35 40 No high school credential
Correspondence school H.S. attendance or completion Occupational program certificate GED College semester--vocational College semester--academic College--2 years College--4 or more years Adult education Private school Public school ChalleNGe graduates with GED Home school
12-month attrition rates 8 154 570 18,875 854 485 32; 80 415 543 183 1,305 300 205 60 933 Sample size (n) TIER 2 TIER 3 TIER 1
Figure 6. Twelve-month attrition rates—Navya
a. Non-prior-service recruits tracked through December 2000.
Figure 7. Twelve-month attrition rates—Air Forcea
a. Non-prior-service recruits tracked through December 2000. The Air Force attrition rate for ChalleNGe GEDs with AFQT scores of 50 and above is not shown separately
19 27 17 20 24 17 16 24 32 30 26 21 18 29 26 35 0 5 10 15 20 25 30 35 40 No high school credential
Correspondence school H.S. attendance or completion Occupational program certificate GED College semester--vocational College semester--academic College--2 years College--4 or more years Adult education Private school Public school ChalleNGe graduates with GED Home school
12-month attrition rate
AFQT of 50 and above
112; 200 250 11,414 876 528 35; 88 316 660 167 1,513 173 330 51 1,351 Sample size (n) TIER 2 TIER 3 TIER 1 19 27 17 20 24 17 16 24 32 30 26 21 18 29 26 35 0 5 10 15 20 25 30 35 40 No high school credential
Correspondence school H.S. atte