Munich Personal RePEc Archive
Foreign Direct Investment, Domestic
Investment and Green Growth in
Nigeria: Any Spillovers?
Adejumo, Akintoye and Asongu, Simplice
January 2019
Online at
https://mpra.ub.uni-muenchen.de/101924/
1
A G D I Working Paper
WP/19/078
Foreign Direct Investment, Domestic Investment and Green Growth in
Nigeria: Any Spillovers?
1Forthcoming book chapter in International Business, Trade and Institutional Sustainability. W. Leal Filho et al. (eds.)
Akintoye V. Adejumo
Department of Economics, Obafemi Awolowo University, Ile-Ife, Nigeria
E-mails: adejumoakinvic@gmail.com,vadejumo@oauife.edu.ng
Simplice A. Asongu
African Governance and Development Institute, P. O. Box, 8413, Yaoundé, Cameroon
E-mails: asongusimplice@yahoo.com, asongus@afridev.org
2
2019 African Governance and Development Institute WP/19/078
Research Department
Foreign Direct Investment, Domestic Investment and Green Growth in Nigeria: Any Spillovers?
Akintoye V. Adejumo & Simplice A. Asongu
January 2019
Abstract
Globally, investments in physical and human capital have been identified to foster real economic growth and development in any economy. Investments, which could be domestic or foreign, have been established in the literature as either complements or substitutes in varying scenarios. While domestic investments bring about endogenous growth processes, foreign investment, though may be exogenous to growth, has been identified to bring about productivity and ecological spillovers. In view of these competing–conflicting perspectives, this chapter examines the differential impacts of domestic and foreign investments on green growth in Nigeria during the period 1970-2017. The empirical evidence is based on Auto-regressive Distributed Lag (ARDL) and Granger causality estimates. Also, the study articulates the prospects for growth sustainability via domestic or foreign investments in Nigeria. The results show that domestic investment increases CO2 emissions in the short run while foreign investment decreases CO2 emissions in the long run. When the dataset is decomposed into three sub-samples in the light of cycles of investments within the trend analysis, findings of the third sub-sample (i.e. 2001-2017) reveal that both types of investments decrease CO2 emissions in the long run while only domestic investment has a negative effect on CO2 emissions in the short run. This study therefore concludes that as short-run distortions even out in the long-run, FDI and domestic investments has prospects for sustainable development in Nigeria through green growth.
Keywords: Investments; Productivity; Sustainability; Growth
3
1. Introduction
The continuous debate on the gains of foreign direct investment (FDI) and trade in the literature has made it impossible to isolate the effects of FDI on growth. While domestic investments are primarily geared towards the growth and development of local economies, the insufficiency of this form of investment has caused most developing economies to continually position themselves to attract FDI. However, the presence of FDI for local economic benefits has continuously attracted arguments in the literature. For instance, some studies have seen FDI and trade as catalysts for economic growth, augmenting physical and human capital and promoting efficiency in the production of goods and services (Feder 1983; Ram 1985; Salvatore and Hatcher 1991; Makki and Somwaru, 2014). Conversely other studies have either seen FDI as a threat to resource allocation and the existence or development of industries within host economies (Boyd and Smith, 1992; Narula and Martin, 2003; Lehnert, Bemamoun and Zhao, 2013; Bende-Nabende, 2017). For instance, according to Smarzynska (2004), Multinational Enterprises (MNEs) are mostly located strategically in highly productive industries; thereby, masking the genuine spillovers. It could be such that MNEs may force less productive domestic firms to exit and then increase their share of investment; thus, causing host economies to superficially pass the productivity test.
Theoretical discourse on the bearing of the FDI-growth nexus has been contested especially within the neoclassical growth doctrines. For instance, the exogenous growth theorists perceive FDI more as income-stimulating rather than stimulating long-run growth. Therefore, the exogenous growth theorist upheld that, if FDI will drive any long-run growth, it will be because it has affected population growth and technological progress positively (Solow 1957; De Mello 1997). However, the differing perspective of the endogenous growth theory posited that FDI can drive growth through spillover effects and positive externalities in outputs. Specifically, spillover possibilities via FDI gains within host economies could stem from FDI fostering innovations and entrepreneurship, building human capital through technological diffusion, as well as the introduction of new management and organizational systems. Thus, irrespective of the ideologies surrounding the FDI-growth nexus, there is a consensus on the plausibility of FDI fostering and generating high-growth opportunities. However, FDI stimulating growth remains contingent on
4
the absorptive capacity of the host economy; as well as whether FDI causes or crowds out domestic investment.
Empirically, studies have ascertained the roles of FDI in either stimulating domestic investment (Makki and Somwaru, 2014); or generating positive spillovers (Lall1980; Rodriguez-Clare1996; Markusen and Venables 1999; Lin and Saggi2004). Also, some studies have examined the differential contributions of FDI and domestic investment in stimulating development. While some have found support for FDI (Borensztein, Gregorio, and Lee, 1998; Balasubramanyam, Salisu, and Sapsford, 1996); some others have adduced otherwise for domestic investments (Aitken and Harrison, 1999). Irrespective of the direction of thought, the central focus, especially for African economies is development. And even more recently is the issue of sustainable development: that is, the development that thrives while engendering posterity. Thus, following the global emphasis on the post-2015 agenda, certain intrigues are brought to the fore which include: the extent to which FDI is desirable in an economy; the environmental effects of the presence of FDI; the threshold for the presence of FDI within a host economy; and the extent to which FDI is performing vis-à-vis domestic investments? (Agosin and Machado, 2005; Halicigolu, 2009; Lee, 2010; Omri, 2013; Asongu, 2018).
Following these intrigues is the need to mainstream the FDI-growth nexus within the framework of sustainable development. This calls for a more challenging discourse beyond the traditional economic growth. Incidentally, the focus of sustainable development is tilted towards not just growth for development but green growth. These are growth processes that reduce environmental degradation and hazards to human posterity. While some strands in the literature are trending in this regard (Lee, 2013; Omri, Nguyen and Rault, 2014; Omri and Khaoli 2014a Shabbaz et al.
2015, Asongu, 2018), studies focusing on Nigeria to articulate the problem statement are scant. Therefore, despite these theoretical and empirical issues on the FDI-growth nexus, the direction of interest within this chapter is nipped within the sphere of sustainable development in Nigeria. Hence, the chapter conducts an assessment of the differential capacities of FDI and domestic investments to generate positive spillovers for sustainable development2. Specifically, beyond
2
In a robustness check of the objective, through causal estimates, an assessment of the of growth FDI and domestic investment are stimulating is ascertained. Specifically, the study ascertains if the presence of investments brings
5
the traditional emphasis on economic growth for development, this chapter hinges on which investments bring about sustained growth for sustainable development, otherwise known as green growth.
The rest of the chapter is structured as follows. The theoretical, empirical and Nigeria-centric stylized literature is covered in Section 2 while Section 3 discusses the data and methodology. The empirical results are disclosed in Section 4 whereas Section 5 concludes with implications and future research directions.
2. Literature Review
2.1. Theoretical Transfer Channels for Investment and Sustainable Development
Overtime, development economists have been positive on FDI driving economic growth; which in turn is capable of generating spillovers. Spillovers are said to occur in the case of FDI when the entry of MNEs brings about productivity increase to domestic firms and MNEs do not fully internalize the value of these benefits (Smarzynska, 2004). Therefore, Multinational Enterprises (MNEs) are seen as agents that increase competition in the host economy, transfer modern technology, and help achieve a more efficient allocation of resources. According to Blomstrom and Kokko (1998), dimensions to which FDI spillovers can occur include productivity spillovers and market access (export) spillovers and agglomeration (firm clusters). Basically, productivity spillovers occur when local firms as a consequence of the presence of MNEs are more efficient in production.
According to Smarzynska (2004), spillovers can take on different forms (See figure 1). It can occur through demonstration effects. Specifically, this is when domestic firms increase their efficiency by adopting technologies of MNEs operations in domestic firms, either as paid workers or through observation. Another form of spillover is apparent through linkage effects. The linkage spillover which could be backward or forward stems from the relationship that local firms establish. Local firms could work in consonance with MNE’s as either subsidiaries or suppliers (backward linkages) or customers of intermediate inputs produced by MNEs subsidiaries (forward linkages) (Lall 1980; Rodriguez-Clare1996; Markusen and Venables 1999; Lin and Saggi 2004). Also, positive spillovers could occur via competitive effects. Firstly, MNEs
about economic, productive and sustainable growth. Also, the causal estimates ascertains if the presence of FDI stimulates domestic investments.
6
can act as competitive entrants with the aim of fostering more efficient utilization of domestic resources by local firms through superior technology (Das, 1987; Wang and Blomstrom, 1992; Blomstrom and Ari Kokko, 1998). Secondly, the presence and utilization of advanced technologies can stimulate domestic efforts to come up with ingenious innovations. Thirdly, given the need for technological absorption and internalization, local firms will have to invest in human and physical capital; thereby raising productivity levels to match MNEs (Damijanet al, 2003; Crespo and Fontoura, 2007). However, as appealing as this competitive effect sounds, there are challenges of loss of market shares for local firms which could equally impede the quantum of income retained within the local economy; as well as associated ecological issues from technological utilization; thereby questioning the benefits that could emanate from the presence of MNEs for local industries.
Therefore, following the spillover expectation of positive effects, the notion of development for sustainability raises issues on possible negative effects either from domestic financing or FDI. These issues are embedded in the spiral pollutant effect of production technologies on the environment; as well as its direct effects on market share and indirect effects on social and human development. For instance, Lee (2014) noted that FDIs are considered as one of the major factors that could lead to environmental degradation. Also, some other studies have equally advanced similar arguments (Smarzynska and Wei, 2001; Xing and Kolstad, 2002; Eskeland and Harrison, 2003; He, 2006; Zhang, 2011). The notion of sustainability in this study amongst other components emphasizes green growth: a concept which denotes the means by which the current economy can make the transition to a sustainable economy while reducing pollution and greenhouse gas emissions, minimizing waste and inefficient use of natural resources, maintaining biodiversity, and strengthening energy security (OECD, 2010). Theoretically, the
Environmental Kuznets Curve (EKC) hypothesis expands on the green growth concept. The EKC advances income growth as a tool for achieving green growth and therefore posits a non-linear (inverted-U) relationship between the environment and growth (i.e. Kuznets shape nexus) (Panayotu, 1993). With regard to FDI, other theories emphasizing green growth have been put forward. It is worthwhile to discuss some of them. First, the Pollution Haven Hypothesis
7
actions and inactions, especially when they downplay environmental issues through relaxed or non-enforced regulations (Copeland and Taylor, 1994; Cole, 2004).
Boost National Income
Source: Author.
Fig. 1: Mechanisms of Investments for Sustainable Development
Investments Productivity spillovers Labour turnover effect Linkage effect Demonst-ration effect Competiti -ve effect Export spillovers Increase (Reduce) in Market/Income Share Agglomeration Spillovers/Outcomes
FDI-led Positive Spillovers
FDI-led Negative Spillovers
Improve (Reduce) Social Welfare- Human Capital Development Ecological Improvement (Degradation)
Implications for Sustainable Development
Foreign Direct Investment
Domestic Investment Domestic-led Decline/Recession Domestic-led Economic Growth
8
Second, the Industrial Flight Hypothesis postulates that foreign firms decide to move their capital to local economies where environmental issues are ignored in order to reduce production costs (Asghari, 2013). Third, there is the Pollution Halo Hypothesis which advances the perspective that foreign firms prefer to function in economies that are environmentally conscious and apt (Zarsky, 1999). Beyond these hypotheses is the Porter-Palmer’s argument on environmental laws in domestic economies bringing about compliance cost; such that FDI could serve as a vehicle for stimulating innovations for clean technologies, especially when expected benefits outweigh costs (Porter, 1991; Porter and Van der Linde, 1995; Palmer et al, 1995).
The aim of investments, whether domestic or foreign, is to bring about positive outcomes such as growth, development and even sustainable development. From the context of Figure 1, if domestic investments yield positive outcomes, economic growth will occur, which through appropriate income redistribution, development will occur. And if the components of sustainable development, which are income growth (economic), ecological sustainability (environment) and human welfare (social), are mainstreamed into the process of development, sustainable development will be assured. However, just like FDI, if domestic investments do not yield the required positive results, development and its sustainability will be affected; and this will be reflected via reduced income, ecological degradation and decreased human and social welfare. Thus, the implications of total investments for economic sustainability cannot be undermined given the differing possible outcomes.
2.2. Empirical Literature
Several papers in developed and developing economies have conducted studies with regard to FDI and economic growth, productivity growth and green growth. In addition to the outcomes of local activities and domestic investments bringing about economic growth, Hsiao and Shen (2003) explained how economic growth could act as a stimulant for attracting FDI in developing countries.
The role of FDI in bringing about economic growth and stimulating domestic investment or otherwise, has been continually discussed in the literature. For instance, Balasubramanyam, Salisu and Sapsford (1996) revealed the growth enhancing effects of FDI over domestic
9
investments, which was made possible via the pursuit of export promotion policies by developing economies. For instance, several studies have shown that open economies grow faster (Dollar, 1992; Sachs, 1995; Rodriguez and Rodrik, 1999; Lipsey, 2002). Also, Barrel and Pain (2007) emphasized that positive effects of FDI and trade on economic growth may simply reflect the fact that FDI is attracted to countries that are expected to grow faster and follow open-trade policies. Furthermore, Borensztein, Gregorio, and Lee (1998), from a panel of 69 developing countries, asserted that FDI is an important vehicle of technology transfer, and that it contributes more to economic growth than domestic investment. Furthermore, Makki and Somwaru (2014) found a strong evidence for sixty-six developing economies, where a positive relationship between FDI and trade in promoting economic growth; as well as FDI stimulating domestic investment. The FDI-growth nexus in these economies was enhanced by human capital development, sound macroeconomic policies and institutional stability. Incidentally, Adams (2009) found an initial crowding out effect of FDI on domestic investment for Sub-Saharan African countries; however, this trend reverses in a latter period. Adams noted that for FDI to complement domestic investment and economic growth there is the need for FDI to be targeted at specific sectors that require it. Also, just like Makki and Somwaru (2004), he emphasized the cooperation between government and MNEs to fostering mutual benefits, as well as the role of human capital especially as regards the absorption capacity of local firms. Beyond these, several panel studies established causality that is uni-directional (Lee, 2010); bi-directional (Choe, 2003; Pao and Tsai, 2011; Omri, 2013) and neutral (Herser et al, 2008).
FDI, through spillover effects has been argued to basically generate productivity growth. In addition, FDI is seen to set the pace for domestic investment with regards to favourable investment climates, technology externalities, and learning effects (Feder, 1983; Ram, 1985; Salvatore 1991; Grossman and Kruerger, 1991; 1995). But Gorg and Greenway (2004) posit that empirical evidence to support positive spillovers are difficult and somewhat illusionary, given that foreign firms protect their assets. For instance, Girma, Greenway and Wakelin (2001) found no intra-industry spillovers. They also established that foreign firms were more productive than domestic firms. Also, Aitken and Harrison (1999) found that spillovers are limited to domestic firms where foreign investments are present within the Venezuelan economy while, Smarzynska
10
(2004) revealed that spillovers at firm levels are associated with projects of shared domestic and foreign ownership but not with fully owned foreign investments in the Lithuanian economy.
Quite a number of studies have also been conducted on the FDI-green growth nexus. We discuss some in what follows:
Grimes and Kentor (2003) noted that in developing economies, the presence of FDI in the energy sector is prominent. This is reflected in the significant effects to the growth of carbon dioxide emissions; while domestic investment has no significant effect on CO2 emissions. Also, employing causality estimates on low, middle and high-income countries, Haffmann et al. (2005) found a unidirectional causality from FDI to energy emissions in middle-income countries; and a uni-directional relationship from CO2 emissions to FDI in low-income countries; while no causal relationship was apparent for high income countries, just like the Gulf Corporation Countries (GCC) (Al-mulali and Tang, 2013). Similarly, Aliyu (2005) revealed that in OECD and non-OECD countries, while foreign outflows impacted the environment positively, foreign inflows impacted the environment negatively. Shabbaz et al. (2015) investigated the non-linear relationship between FDI and environmental degradation for high-, middle- and low-income countries. They found that the environmental Kuznets curve exists and FDI increases environmental degradation; thus validating the pollution heaven hypothesis (PHH) exists. Also, a bidirectional causality was seen between CO2 emissions and foreign direct investment in the global panel. Similarly, Lee (2010) found a bi-directional relationship between FDI and energy pollutants for the Malaysian economy. The PHH was also found to be valid in China (Zhang, 2008; Beak and Koo, 2009; Bao et al, 2011; Cole et al 2011; Wang et al 2013),Taiwan (Chang and Wang, 2009) and in the short-run in India (Beak and Koo, 2009). In addition, Pao and Tsai found the evidence of EKC in BRIC (Brazil, Russia, India and China). However, in contrast to the PHH hypothesis, some studies analyzed the effects of FDI on CO2 emissions; and found that FDI improves environmental quality due to the use of energy efficient technology (Tamazian and Rao, 2010; and Lan et al, 2012; Al-mulali and Tang, 2013).
For sub-Saharan African countries, Kivyiro and Arminen (2014) noted that FDI lead to increase in CO2 emissions and causality runs from FDI to CO2 emissions. Keho (2016) provides empirical evidence on ECOWAS countries which supports the environmental Kuznets curve for four
11
countries (Cote d’Ivoire, Gambia, Mali and Niger). Also, economic growth and population contribute to environmental degradation. Incidentally, the effect of FDI on CO2 emissions is contingent on trade openness. This effect is positive and increases with the degree of trade openness in Burkina Faso, Gambia and Nigeria, suggesting that trade and FDI are complementary in worsening environmental quality. The effect of FDI decreases with trade in Ghana, Mali and Togo while in the cases of Benin, Niger, Senegal and Sierra Leone, FDI has no significant long-run effect on CO2 emissions. Specifically in Nigeria, Ominiyi and Adayi (2017) analyzed the impact of FDI on environmental sustainability. The findings were consistent with the PHH where FDI contributes to CO2 emissions. This is attributed to the activities of resource- extracting industries which cause pollution in Nigeria. They also found that population growth leads to environmental degradation because most Nigerians are poor and depend on the environment for their livelihood thereby aiding depletion. Also, similar to the findings of Abdu (2013), Ominiyi and Adayi (2017) found that growth in GDP spurs environmental sustainability, despite the low level of industrialization in Nigeria. Maku et al (2018) has revealed that GDP has an insignificant positive influence on CO2 emission while FDI and energy consumption also have an insignificant negative impact on CO2 emission in Nigeria.
Overall, our literature review suggests that the empirical results of the previous studies are inconclusive. This inconclusiveness can be traceable to, inter alia: differences in the techniques of analysis and lack of adequate information on the direction of causality, especially for Nigeria. The causal segregation and comparison of these growths has not been quite articulated in the literature. This is pertinent because while drawing and implementing policies for development, the role of peculiar growth context stands different vis-à-vis investment feedbacks. For instance, while economic growth is geared towards income distribution, productivity growth concentrates on efficiency; while sustainable growth emphasizes on posterity. Therefore, the directions of influence of different growth indices vis-a-vis investments are invaluable for policy decisions in Nigeria which is still developing. Also, an overview of previous studies concentrated mainly on FDI impact on the environment and downplays the effects that could equally emanate from domestic investments. Therefore, since both investments dictate the pace of economic activities within a local economy, they will be both considered as determinants of environmental sustainability in this study. This will also reduce the challenge of omitted variable bias.
12
2.3. Foreign Direct Investment and Domestic Investment in Nigeria
For the past two decades, FDI in form of foreign capital inflow to sub-Saharan African (SSA) countries has been ranked lowest; especially when compared to other regions. For instance, countries in SSA receive capital inflow that are 13 times lower than those flow to East Asia and Pacific in 2015 (UNCTAD, 2018). In 2013, the EY report revealed that South Africa and Kenya, Nigeria were listed as the countries where FDI was highest. With investment projects in excess of more than 60 projects, Nigeria led Ghana in the West African region. The EY report noted that despite a minor decrease in FDI projects in 2013 in Nigeria, the country’s remains an attractive place for investors especially given the size of the economy.
According to the United Nations Conference on Trade and Development (UNCTAD) World Investment Report (2017), FDI flows to Africa fell by 3 percent- precisely from $61 billion in 2015 to $59 billion in 2016. The overall decline of FDI flows to the continent has been greatly attributed to weak commodity prices, especially oil to which Nigeria is mainly dependent. However, statistics revealed that in 2017, inflows into West Africa grew by about 12%. With a total of $11.4 billion foreign investments in the region, it was majorly driven by Nigeria’s oil
sales and Ghana’s hydrocarbons and cocoa processing projects which amounted to $4.4 billion
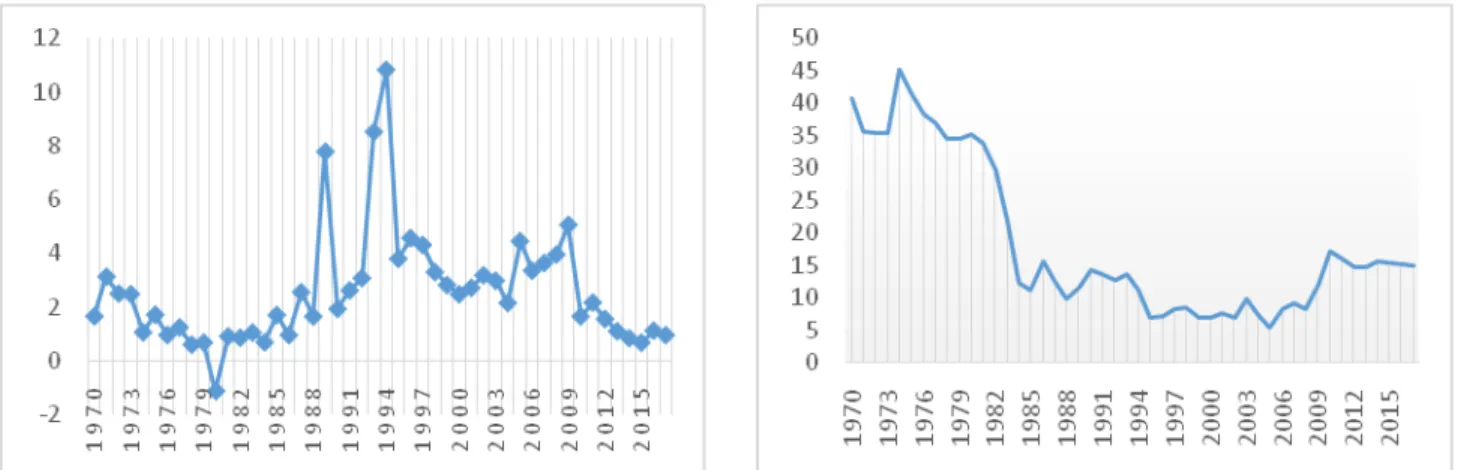
and $3.5 billion, respectively. Despite the fact that Nigeria remains among the first-three recipients of FDI in SSA, the capital inflow is not so reflected in the contributions of FDI to GDP in the country. From Figure 2 and 3, the contribution of FDI to GDP when compared to domestic investments in Nigeria remains considerably low.
Source: World Development Indicators (2018)
Figure 2: FDI Contribution to GDP
Source: International Financial Statistics (2010)(for:1970-1981) World Development Indicators (2018) (for:1982-2017)
13
Figure 3: Contribution of Domestic Investment to GDP
From Figure 3, with an average contribution of 40%-45%, domestic investment was a major contributor to the GDP in Nigeria especially during the early 1970s and 1980s. This is majorly attributed to the agrarian nature of the Nigerian economy then; which sustained and financed domestic investments within the economy before the oil boom. But a sharp decline is noticed in domestic investments from 1981 through, although with a slight rise in the mid-1980s, domestic investment’s contribution remained low at an average of 15%; and even contributed as low as 10% in the mid-1990s. Although, there has been a slight increase since the early 2000s, with a contribution of about 20% in 2010; however, this contribution remains low when compared to the early 1970s.
The trend analysis of both investments in Nigeria reveals an interesting pattern. From the 1970s to 1985, while FDI contributed less than 3% to GDP, domestic investments contributed an average of 40%. With the exception of 1991 and 1997 where FDI fell sharply, FDI contributed as high as 8% to 10% between 1986 and 1999. By the year 2000 when FDI fell to 2%, domestic investments had started picking-up again to about 15% in 2010. In fact, except between 2003 and 2006 where FDI contributed about 3%, between 2009 and 2016, FDI has been dwindling to almost 0.5% in 2015; while domestic investment has risen gradually during that period in Nigeria. This pattern in contributions of FDI versus DI suggests a substitute-complementary type of relationship. However further empirical analysis is worthwhile in order to provide more causal insights. In all, the UNCTAD (2018) report has predicted increases in FDI inflows in Africa. This prediction is strengthened by the recent signing of the African Continental Free Trade Area (AfCFTA) by 44 African countries; and even the anticipation is higher in Nigeria, given an expectation in the improvement of commodity prices like oil.
3. Methodology
3.1. Data and Variable Definition
In order to assess the spillovers and investment outcomes in Nigeria, the paper employs the Auto-regressive Distributed Lag (ARDL) estimation procedure and causality tests. Specifically, in order to uncover the existence of a relationship and direction of causality between investments and sustainability in Nigeria, this paper utilized annual data covering the period 1970-2017 by
14
disaggregating the time period into three-time horizons3. The choice of the variables and time period is informed by the behaviour of the series of the focal variables: FDI and Domestic Investment (DI). It is worthwhile to note that all-time series variables are transformed into natural logarithms to avoid heteroskedacticity and spurious results. The sources and the description of the variables used in this paper are presented in Table 1 below:
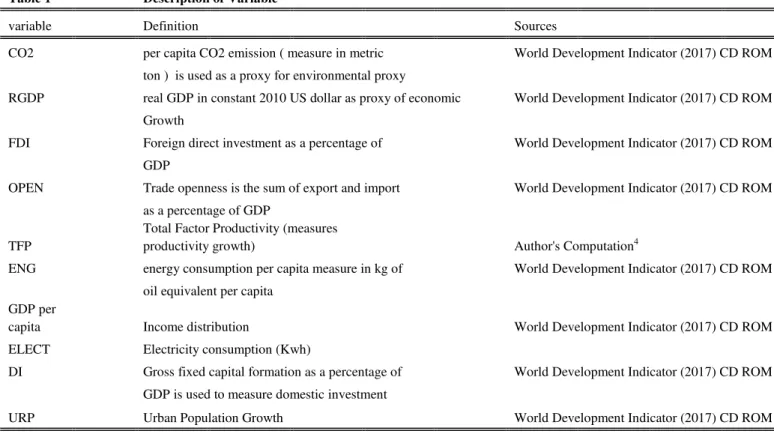
Table 1 Description of Variable
variable Definition Sources
CO2 per capita CO2 emission ( measure in metric World Development Indicator (2017) CD ROM ton ) is used as a proxy for environmental proxy
RGDP real GDP in constant 2010 US dollar as proxy of economic World Development Indicator (2017) CD ROM Growth
FDI Foreign direct investment as a percentage of World Development Indicator (2017) CD ROM GDP
OPEN Trade openness is the sum of export and import World Development Indicator (2017) CD ROM as a percentage of GDP
TFP
Total Factor Productivity (measures
productivity growth) Author's Computation4
ENG energy consumption per capita measure in kg of World Development Indicator (2017) CD ROM oil equivalent per capita
GDP per
capita Income distribution World Development Indicator (2017) CD ROM
ELECT Electricity consumption (Kwh)
DI Gross fixed capital formation as a percentage of World Development Indicator (2017) CD ROM GDP is used to measure domestic investment
URP Urban Population Growth World Development Indicator (2017) CD ROM
3.2 The ARDL Bound Testing
Overtime, a number of econometric techniques have been employed in different studies such as Enger and Granger (1987), Johansen (1988), Johansen and Juselius (1990), fully modified OLS of Phillip and Hansen (1990) and Johansen (1996), among others, to estimate the relationships between the variables. Thus, to explore the relationship between investment and sustainable
3
The time horizon is splitted based on the cycles of investments within the trend analysis. Thus, the first is 1970-1985; the second is 1986-2000; and the third is 2001-2017.
4
The simple growth-accounting exercise to estimate the growth rate of the TFP (the Solow residuals) See Adejumo, O.O. and Adejumo, A.V. (2017). An Analysis of Human Capital Development And Productivity Growth- Case Study, Nigeria. Review of Innovation and Competitiveness, 3 (3), 61-84. Preuzeto https://hrcak.srce.hr/187210
15
development growth in Nigeria within the period of 1970-2017, this study utilizes the Auto-Regressive Distributed Lag Estimates (ARDL) bounds test approach proposed by Pesaran et al.
(2001). This approach is justified to have numerous advantages over other cointegration approaches5. The unrestricted error correction model (UECM) version of the ARDL model is presented as follows:
Where ∆ is the first difference operator, α, β,∅, ᴪ, ω, ⱷ, π and Ω are the coefficient estimates of the chosen variables; μ is error term; p, q, r, s, t, u, v and w are the optimal lag lengths selected based on the optimal length selection criteria. Pesaran et al. (2001) suggest an F-test for joint significance of the coefficients of the lagged level of variables. For example, the null hypothesis
of no long run relationship between the variables is is
tested against the alternative hypothesis of
cointegration . Pesaran et al. (2001) computed two sets
of critical values (lower and upper critical bounds) for a given significance level. A lower critical bound is applied if the regressors are I(0) and the upper critical bound is used for I(1). If the F-statistic exceeds the upper critical value, I(1), the null hypothesis will be rejected in favour of the alternative hypothesis and thus, we concluded that there is long run relationship. If the F-statistics falls below the lower critical bound, we cannot reject the null hypothesis of no cointegration. However, if the F-statistics lies between the lower and upper critical bounds, inference will be inconclusive.
3.3 Causality Test
To make this paper robust and increase its predictive power, this study equally determines the direction of causality among the variables using vector error correction model (VECM). Engle
5
This approach is found to be applicable irrespective of the order of integration of variables, evades the need for pre-testing the integration order of variables, allows the variables to have different optimal lag length, possibility of deriving a dynamic unrestricted error correction model from the approach via a simple linear transformation and it integrates both the short run dynamics and long run dynamics together without loss of any long run information (see Halicioglu, 2008; Kohler, 2013; Sung et al, 2017 among others).
16
and Granger (1987) asserted that once there is existence of long run relationship between variables, then there must Granger causality in at least one direction. Though, they cautioned that Granger causality test conducted in the first difference variables by means of a VAR might be misleading in the presence of cointegration; thus, inclusion of an additional variable to the VAR system which is the error correction term will help to test the long run relationships between the variables. Thus, this paper determines the possible short run and long run causality among the variables using this technique which is the best alternative technique to capture this causality and the augmented form of the Granger causality test involving the error correction term is formulated in a multivariate pth order vector error correction model as follows:
(2) It should be note that (1-L) is the lag operator used to explain the amount of lags include in the VAR and
(ECt-1) denotes the error correction term. Thus, this paper utilises the Granger causality derived for equ
(2) above to check for the statistical significance of the lagged differences of the variables for each vector; which is a measure of short run casuality. While, the coefficient of the lagged error correction term represents the long run causality6.
In all, the ARDL estimate was used to determine the type and degree of relationship that exist between FDI and green growth; and between DI and green growth. However, cutting down on the number of control variables in the ARDL model, the equation (2) which is the VECM-Granger model endogenizes five selected variables. This is with the aim of ascertaining if FDI stimulates DI; as well as ascertaining the prospects for sustainable development vis-à-vis growth channels which include economic growth (GDP), productivity gowth (TFP) and green-growth (CO2).
3.4. Model stability
The issue in econometric techniques of testing the stability of estimated coefficient has denegrated into a controversial discussions among researchers with no consensus on the appriopriate technique to determine the stability of estimated coefficients. Bahmani and
6
For detail discussion of this econometric technique see Enger and Granger (1987), Narayan and Symth (2006), Halicioglu (2009) and Kohler (2013) among others
17
Chomsisemgphet (2002) argued that existence of a cointegration among the estimated long run coefficients is not a sufficient condition to conclude that the estimated coefficients are stable and different stability tests have been employed in the empirical literature such as Chow (1960), Brown et al. (1975), Hansen (1992) and Hansen and Johansen (1993). Hence, this paper utilises Brown et al. (1975) stability test which incorporates cumulative sum and cumulative sum of squares tests based on the recursive regression residuals. These tests also include the dynamics of the short-run to the long-run through the residuals with a graphical plot showing that the cumulative sum and cumulative sum of squares statistics fall inside the critical bounds of 5% significance which also provide information about the confirmation of the stability of the coefficients of the ARDL regression .
4. Empirical Evidence and Discussion
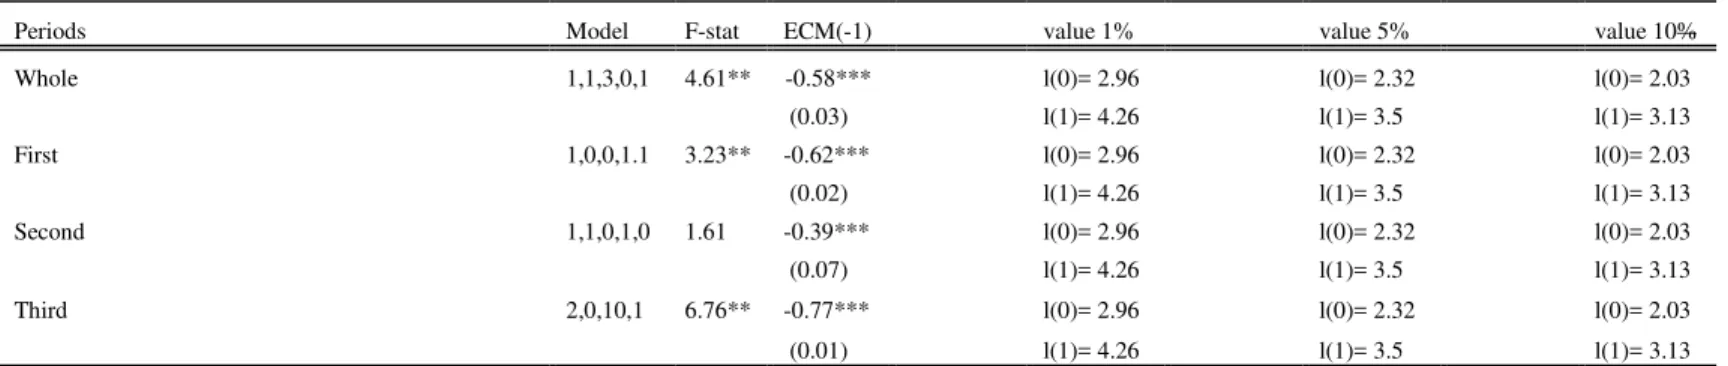
Prior to estimating the long run relationship between the investment spillovers in Nigeria, it is of paramount to check the stationarity of all variables, that is, to ascertain the order of integration of all the variables to avoid spurious results using Dickey and Fuller (1981) and Phillip-Perrons (1988) unit root testing procedures7. Having verified the stationarity of all variables, this paper proceeds to confirm the existence of long run cointegration relationship among the variables using Pesaran et al. (2001) bounds test. It is imperative to first determine the optimal lag length using different selection criteria due to sensitivity of F-statistics to the numbers of lags8. Table 2 presents the ARDL bounds test along with the error correction models. The results show that the computed F-statistics are greater than the upper critical bounds generated by Pesaran et al. (2001) at 5% and 10% significant levels which lead to the rejection of null hypothesis of no cointegration in favour of alternative hypothesis at both significant levels. This findings confirm the presence the of cointegration between the variables in the whole time periods, first and the third period but inconclusive results is reported only in the second period since the computed F-statistic fall within the upper and lower critical values at 5% level of significant. However, there
7
The results of the unit root test show that all variables are stationary at first difference with both constant and trend, except some variables that were found to be stationary at level. It should be noted that the results are not presented in this paper, but are available upon request
8
The results of the lag selection criterion used for each time period varies and they produce conflicting results. Hence, this paper employs the Akaike Information Criterion and the Schwartz Information Criterion (SIC) as the appropriate optimal lag length over the other alternatives due to their consistency and parsimonious in lag length selection, to avoid losing a lot of degree of freedom. However, to conserve space, the results are not presented in this paper
18
is no evidence of cointegration between these variables in the second period since the computed F-statistic fall below the upper and lower critical values at both 5% and 10 % significant levels.
Interestingly, the results of the error correction terms are negative and statistically significant in all the time periods and this implies that the error correction terms corroborates with the established cointegration results which lead us to conclude that changes in carbon emissions are corrected for at different significant levels for each time period. The results equally show that the magnitude of the adjustment coefficients reported in each time period varies with the fastest adjustment speed recorded in third period only.
It is also important to note that the ECTs have the expected signs that are also within the acceptable theoretical interval (Asongu, El-Montasser and Toumi, 2016). Accordingly, whereas an ECT at equilibrium is zero, an ECT that is not zero implies that linkage pairs have deviated from the long term equilibrium. Therefore, the ECT helps to adjust and partially restore the long-run nexus. The underlying restoration is contingent on two main factors, notably, the ECT: (i) displays a negative sign and (ii) is within an interval of 0 and 1 which is necessary for the stability of the error correction mechanism (Asongu, 2014a, 2014b, 2014c). Moreover, a positive ECT implies a deviation from the equilibrium. Hence, a negative sign reflects the restoration of the long term nexus after an exogenous shock. Within this framework, in determining the speed at which the equilibrium is reinstated, an ECT of 1 reflects full adjustment while an ECT of zero implies no adjustment.
Table 2: Estimated ARDL9 Cointegration Test Results
Periods Model F-stat ECM(-1) value 1% value 5% value 10%
Whole 1,1,3,0,1 4.61** -0.58*** l(0)= 2.96 l(0)= 2.32 l(0)= 2.03 (0.03) l(1)= 4.26 l(1)= 3.5 l(1)= 3.13 First 1,0,0,1.1 3.23** -0.62*** l(0)= 2.96 l(0)= 2.32 l(0)= 2.03 (0.02) l(1)= 4.26 l(1)= 3.5 l(1)= 3.13 Second 1,1,0,1,0 1.61 -0.39*** l(0)= 2.96 l(0)= 2.32 l(0)= 2.03 (0.07) l(1)= 4.26 l(1)= 3.5 l(1)= 3.13 Third 2,0,10,1 6.76** -0.77*** l(0)= 2.96 l(0)= 2.32 l(0)= 2.03 (0.01) l(1)= 4.26 l(1)= 3.5 l(1)= 3.13
Note: *** and ** represents significant at 5% and 10% levels respectively. Values in brackets represent the probability values
9
19
The results of the long run and short run ARDL are presented in Table 3 below. The results show that the effect of FDI on CO2 emission is negative and statistically significant in case of whole, second and third periods only10 but a positive insignificant relationship is reported in the first period. The empirical finding of a positive relationship between FDI and CO2 emission is not surprising given the initial influx of most foreign investment in the primary sector during the oil boom; and most industries that dominated this sector produced highly pollution-intensive goods. However, the error correction estimates and subsequent periods reveal that the positive relations even out overtime. This tendency rejects the PHH position of downplaying green growth through inefficient technologies as far as CO2 emissions are concerned. But, the findings show that domestic investment, though insignificant in the long-run, positively influences CO2 in all the time periods11 with the exception of the third period only. This indicates that challenges to green growth are more, on the path of domestic investments. Although, it is expected that as FDI impacts the efficiency of domestic investments in the long-run; which may explain the negative effects of domestic investments on CO2 in the third period.
The effect of real GDP on CO2 is negative and statistically significant in the case of whole time period and third period only12 but an insignificant positive relationship is reported in first and second periods only. However, in the short-run, real GDP has significant positive influences on CO2 emissions thus indicating the presence of EKC effects. The effect of trade openness and electricity consumption on CO2 is positive and insignificant in second and third only but negative significant findings are reported for trade openness in first and whole period only13. The
10
The empirical finding of the negative relationship between these variables suggest that the influx of foreign investors into the country attracts more clean technology, expertise and promote energy efficiency thereby improving the environmental quality of the country. These findings also confirm the pollution-halo hypothesis and the findings are consistent with the empirical results of Doytch and Uctum (2016), Zhang and Zhou (2016) and Sung et al (2017) among others.
11
The empirical findings of positive relationships between domestic investment and CO2 emission show that as domestic investment increases, it leads to an increase in CO2 emission due to lack of concern among the domestic investors on the environmental quality of lives of the citizens because most investors are profit-driven ( see Omri et al; 2014, Hakimi and Hamdi; 2016 and Beladi et al; 2016 among others )
12
The negative findings in these two periods imply that increase in economic growth experienced in these periods eventually led to a reduction in CO2 emission which could be attributed to the introduction of sound environmental laws and policies. Also, the results validate the environmental Kuznets Curve (EKC) Hypothesis.
13
The negative relationships between trade openness and CO2 imply that as the government liberalizes the trade regime; this gives an opportunity to import more pollution-intensive goods from abroad. Thus, an increase in trade
20
estimated coefficient of urban population shows a positive and significant relationship with CO2 emission in all the time periods but negative insignificant findings are recorded in first period only. Energy use shows a positive and insignificant association with CO2 emission in the case of the whole, first and second periods only but a negative significant relationship is exclusively reported in third period.
Estimating the long run relationship between investment and sustainable growth without considering the short run dynamics between these variables is not sufficient enough. Thus, this study also considers the short run relationship between these variables over time. The impact of FDI on CO2 is negative and statistically insignificant only in whole, second and third periods but a positive insignificant relationship is recorded in first period only; which is consistent with the long-run analysis. Also, just like in the long-run, the results of domestic investment and real GDP show that they are positively significant in influencing CO2 emission in the short run in the case of all time periods but a negative and significant relationship is found between domestic investment and CO2 in the third period only. Similarly, trade openness and electricity generation are reported to be negative and statistically insignificant in whole and first period only but positive insignificant findings are reported only in the second and third periods. This indicates that trade openness and electricity generation have an insignificant but gradual increasing effect on green growth. The estimated coefficient of urban population growth has a positive and significant effect on CO2 emission in whole and third period only but insignificant effects in first and second periods. The results also show that there is a positive and insignificant short run relationship between energy use and CO2 emission in all the time periods.
openness tends to improve environmental quality by lowering the growth of energy pollutants (see Shahbaz et al; 2011 and Kohler; 2013).
21
Table 3: ARDL Estimates
Dependent Whole First second Third
variable CO2 Coeff Coeff Coeff Coeff
long run FDI -0.435** 0.14 -0.197** -0.239* DI 0.082 0.214 0.166 -1.130* RGDP -1.575** 1.013 0.112 -0.335** OPEN -0.267 -0.551 0.098 0.048 ELECT -1.135** -1.204 0.572 0.655 UPG 2.582*** -6.308 1.915** 6.287* ENG 1.907 5.695 0.309 -2.850* short run FDI -0.234 0.064 -0.262 -0.266 DI 0.139** 0.097*** 0.221*** -0.258** RGDP 0.261** 0.46*** 0.014** 0.374** OPEN -0.238 -0.251 0.13 0.054 ELECT -0.589 -0.547 0.761 0.731 UPG 1.341* 2.906 2.547 7.015* ENG 2.572 2.591 0.411 3.18 Diagnostic Normality 0.087 0.3524 0.245 0.365 Serial 0.102 7.165 0.109 0.3826 ARCH 0.252 0.888 0.445 0.832 RAMSEY 2.86 0.063 0.432 0.322 CUSUM14
STABLE STABLE STABLE STABLE
CUSUMQ15 STABLE STABLE STABLE STABLE
Note *** and ** represent significant at 5% and 10% levels respectively
The results of the diagnostic tests such as serial correlation, functional form, normality and Heteroskedacticity are also reported in Table 3. The results show that all the estimated coefficients are statistically significant and there are no serial correlations. Also, the stability of the model is confirmed with the test of CUSUM and CUSUMQ used to assess the recursive residue in the mean and variance respectively for the whole time period16
14 See appendix 15 See appendix 16
The plots of the graph of the CUSUM and CUSUMQ tests are not presented in this paper but they are available upon request.
22
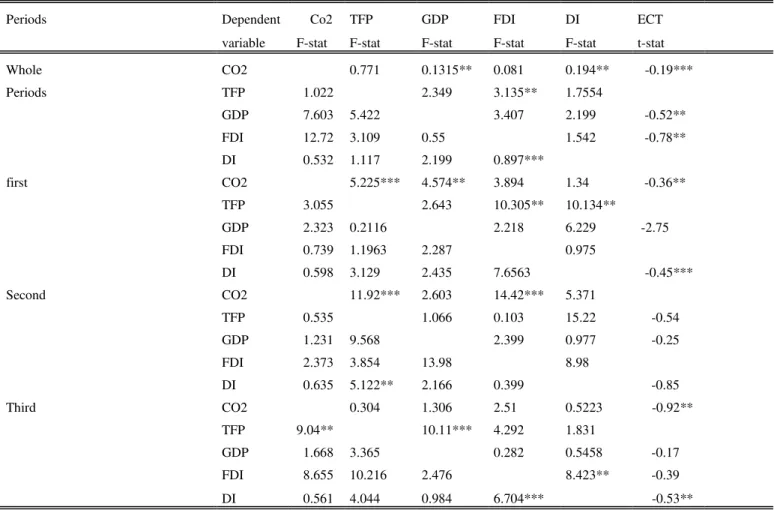
Having confirmed that the existence of long run relationship between the variables, then, this paper examines the direction of causality between five variables in each time horizon using vector error correction model (VECM) by verifying the causal effect through the significance of the coefficient of the lagged error correction term and the joint significance of the lagged differences of the explanatory variables using the Wald test. The results of the causality test are presented in Table 4. In the case of the whole period, the results show that there are unidirectional Granger casual relationships in the short run: from GDP to CO2 emission, from domestic investment to CO2 emission, FDI to domestic investment and FDI to TFP. This finding implies that changes in GDP and domestic investment cause changes in the CO2 emission, thereby emphasizing EKC effects; and changes in foreign direct investment cause domestic investment and TFP in the short run. However, there is no evidence of bidirectional or feedback effect between these variables. The statistically significant coefficient of the error correction term confirms the results of the bound tests.
In the case of first period, the results show that there is unidirectional causal nexus in the short run: from TFP to CO2, GDP to CO2, domestic investment to TFP and domestic investment to FDI. The significance of these findings implies that changes in TFP and GDP cause changes in CO2 and change in domestic investment causes FDI but no evidence of feedback effect is reported in this period. Also, the long run causality is supported by the coefficient of the lagged error correction term which reported negative and statistically significant between the variables in this period. In the case of the second period, there is also evidence of unidirectional causal flow: from TFP to CO2, FDI to CO2 and TFP to domestic investment. This finding implies that changes in both TFP and FDI cause changes in CO2. However, there is no evidence of long run causality between the variables due to insignificance of the error correction term and this findings also confirm the bound test result that show no long run relationships. In the third period, there is evidence of unidirectional causal nexus running from CO2 to TFP, GDP to TFP, domestic investment to FDI and FDI to domestic investment. These findings also show that there is evidence of bidirectional causality relationships between foreign direct investment and domestic investment. Also, the statistically significant negative coefficient of the error correction terms shows that there is a long run relationship between the variables and these results is in consonance with the bound test results. In summary, the results show that Granger causality
23
running from other variables to CO2 emission is common in all the time horizons and there is only evidence of bidirectional causality effect between foreign direct investment and domestic investment in third period only.
Table 4: Granger Causality Estimates
Periods Dependent Co2 TFP GDP FDI DI ECT
variable F-stat F-stat F-stat F-stat F-stat t-stat
Whole CO2 0.771 0.1315** 0.081 0.194** -0.19*** Periods TFP 1.022 2.349 3.135** 1.7554 GDP 7.603 5.422 3.407 2.199 -0.52** FDI 12.72 3.109 0.55 1.542 -0.78** DI 0.532 1.117 2.199 0.897*** first CO2 5.225*** 4.574** 3.894 1.34 -0.36** TFP 3.055 2.643 10.305** 10.134** GDP 2.323 0.2116 2.218 6.229 -2.75 FDI 0.739 1.1963 2.287 0.975 DI 0.598 3.129 2.435 7.6563 -0.45*** Second CO2 11.92*** 2.603 14.42*** 5.371 TFP 0.535 1.066 0.103 15.22 -0.54 GDP 1.231 9.568 2.399 0.977 -0.25 FDI 2.373 3.854 13.98 8.98 DI 0.635 5.122** 2.166 0.399 -0.85 Third CO2 0.304 1.306 2.51 0.5223 -0.92** TFP 9.04** 10.11*** 4.292 1.831 GDP 1.668 3.365 0.282 0.5458 -0.17 FDI 8.655 10.216 2.476 8.423** -0.39 DI 0.561 4.044 0.984 6.704*** -0.53**
Note *** and ** represent significant at 5% and 10% levels respectively
5. Concluding Implications and Future Research Directions
The study has examined the differential capacities of FDI and domestic investments to drive green growth in Nigeria. The results show that domestic investment increases CO2 emissions in the short run while foreign investment decreases CO2 emissions in the long run. When the dataset is decomposed into three sub-samples in the light of cycles of investments within the trend analysis, findings of the third sub-sample (i.e. 2001-2017) reveal that both types of investments decrease CO2 emissions in the long run while only domestic investment has a negative effect on CO2 emissions in the short run. Therefore, the result showed that FDI inflows has not hampered green growth over the study period, thereby causing a rejection of the pollution
24
haven hypothesis in Nigeria as far as CO2 emissions are concerned. But via positive insignificant effects on pollution, domestic investments and GDP has challenged green growth in Nigeria; thus indicating EKC effects.
Also, the study was able to articulate that FDI caused (stimulates) domestic investment over the study period; however, there was no reverse causality in this regard. Finally, this study was able to ascertain the causality between FDI and the different growth indicators. While FDI was seen to cause productivity growth in Nigeria, the causality estimates revealed neutrality effects for economic growth and green growth. However, the uni-directional causality result was consistent with the ARDL estimates of a flow from domestic investments to the green growth.
In all, given the outcome of the most recent period, this study indicates that positive spillovers for CO2 emissions abound via FDI for Nigeria and even domestic investments which appears to dominate total investments in Nigeria. This study therefore concludes that as short-run distortions even out in the long-run, FDI and domestic investments has prospects for sustainable development in Nigeria through green growth. However, exploring some other components of green growth like land use, oil exploration may affirm or refute this conclusion.
25
References
Adams, S. (2009). Foreign direct investment, domestic investment, and economic growth in Sub-Saharan Africa. Journal of policy modeling, 31(6), 939-949.
Agosin, M. R., & Machado, R. (2005). Foreign investment in developing countries: does it crowd in domestic investment?. Oxford Development Studies, 33(2), 149-162.
Asghari, M., (2013). Does FDI promote MENA Region’s environmental quality? Pollution Halo or Polltion Have hypothesis. International Journal of Scientific Research in Social Sciences, 1(6), 92-100.
Asongu, S. A., (2014a). “Correcting inflation with financial dynamic fundamentals: which adjustments matter in Africa?” Journal of African Business, 15(1), pp. 64-73.
Asongu, S. A., (2014b). “Does money matter in Africa? New empirics on long- and short-run effects of monetary policy on output and prices”. Indian Growth and Development Review, 7(2), pp. 142–180.
Asongu, S. A., (2014c). “Linkages between investment flows and financial development: causality evidence from selected African countries”, African Journal of Economic and Management Studies, 5(3), pp. 269-299.
Asongu, S. A., El-Montasser, G., & Toumi, H., (2016). “Testing the Relationships between Energy Consumption, CO2 Emissions and Economic Growth in 24 African Countries: A Panel ARDL Approach”, Environmental Science and Pollution Research, 23(7), pp. 6563–6573.
Asongu, S. A., (2018). CO2 emission thresholds for inclusive human development in
Sub-Saharan Africa, Environmental Science and Pollution Research. DOI:
10.1007/s11356-018-2626-6.
Bahmani-Oskooee, M., & Chomsisengphet, S. (2002). Stability of M2 money demand function in industrial countries. Applied Economics, 34(16), 2075-2083.
Balasubramanyam, V. N., Salisu, M., & Sapsford, D. (1996). Foreign direct investment and growth in EP and IS countries. The economic journal, 92-105.
Beak, J. and Koo, W. W. (2009). A Dynamic Approach to FDI-Environment Nexus: The case of China andIndia. Journal of International Economic Studies 13(2): 1598-2769.
Bende-Nabende, A. (2017). Globalisation, FDI, regional integration and sustainable
development: theory, evidence and policy. Routledge.
Blomström, Magnus, Robert E. Lipsey, and Ksenia Kulchycky. 1988. U.S. and Swedish direct investment and exports. In Trade policy issues and empirical analysis, ed. Robert E. Baldwin, 259–97. Chicago: University of Chicago Press
Borensztein, E., De Gregorio, J., & Lee, J. W. (1998). How does foreign direct investment affect economic growth? 1. Journal of international Economics, 45(1), 115-135.
26
Boyd, John, H. and Smith, B. D., (1992). Intermediation and equilibrium allocation of investment capital: Implication for economic development. Journal of Monetary Economics, 30, 409-432.
Brown, R.L., Durbin, J., Evans, J.M., 1975. Techniques for testing the constancy of regression relations over time. Journal of the Royal Statistical Society, Series B 37, 149–163
Choe, J. I. (2003). Do foreign direct investment and gross domestic investment promote economic growth?. Review of Development Economics, 7(1), 44-57.
Chow, G., 1960. Test of equality between sets of coefficients in two linear regressions. Econometrica 28, 591–605.
Crespo, N., & Fontoura, M. P. (2007). Determinant factors of FDI spillovers–what do we really know? World development, 35(3), 410-425.
Damijan, J. P., Knell, M., Majcen, B., & Rojec, M. (2003). The role of FDI, R&D accumulation and trade in transferring technology to transition countries: evidence from firm panel data for eight transition countries. Economic systems, 27(2), 189-204.
De Mello Jr, L. R. (1997). Foreign direct investment in developing countries and growth: A selective survey. The Journal of Development Studies, 34(1), 1-34.
Dollar, D. “Outward Oriented Developing Economies Really Do Grow More Rapidly: Evidence from 95 LDCs, 1976–85.” Economic Development and Cultural Change 40(1992): 523–44. Engle, R., Granger, C., 1987. Cointegration and error correction representation: estimation and testing. Econometrica 55, 251–276.
Eskeland, G. S. and Harrison, A. E. (2003). Moving to greener pastures? Multinationals and the Pollution Haven Hypothesis, Journal of Development Economics 70, 1–23
Feder, G. (1983). On exports and economic growth. Journal of development economics, 12(1-2), 59-73.
Girma, S., Greenaway, D., & Wakelin, K. (2001). Who benefits from foreign direct investment in the UK?. Scottish Journal of Political Economy, 48(2), 119-133.
Grimes, P. and Kento, J. (2003). Exporting the greenhouse: Foreign Capital Penetration and CO2 Emissions 1980–1996. Journal of World-Systems Research, (2), 261-275.
Grossman, G., Krueger, A., 1991. Environmental impacts of a North American free trade agreement. National Bureau of Economics Research Working Paper, No. 3194, NBER, Cambridge.
27
Grossman, G. M. and Krueger, A. B., (1995). Economic growth and the environment. Quarterly Journal of Economics, 110, 353-77.
Görg, H., & Greenaway, D. (2004). Much ado about nothing? Do domestic firms really benefit from foreign direct investment? The World Bank Research Observer, 19(2), 171-197.
Halicioglu, F. (2009). An econometric study of CO2 emissions, energy consumption, income and foreign trade in Turkey. Energy Policy, 37(3), 1156-1164.
Hansen, B.E., (1992).Tests for Parameter Instability in Regressions with I(1) Processes.JournalofBusinessandEconomicStatistics10,321–335.
Hansen, H., & Johansen, S. (1993). Recursive estimation in cointegrated VAR-models (Vol. 1). Copenhagen: Institute of Mathematical Statistics, University of Copenhagen.
He, J. (2006). Pollution haven hypothesis and environmental impacts of foreign direct Investment: the case of industrial emission of sulfur dioxide (SO2) in Chinese province.
Ecological Economics, 60, 228-245.
Herzer, D., Klasen, S. and Nowak-Lehmann, F. D. (2008), In search of FDI-led growth in developing countries: The way forward. Economic Modeling: 25, 793–810.
Johansen, S.,1988.Statistical Analysis of Cointegrating Vectors. Journal of Economic Dynamics and Control12,231–254.
Johansen,S., (1996. Likelihood-Based Inference in Cointegrated Vector Auto Regressive Models. Seconded, Oxford University Press, Oxford.
Johansen, S., Juselius, K., (1990).Maximum Likelihood Estimation and Inference on Cointegration—with Application to the Demand for Money. Oxford Bulletin of Economics and Statistics 52, 169–210.
Keho Yaya (2016).Trade Openness and the Impact of Foreign Direct Investment on CO2 emissions: Econometric Evidence from ECOWAS Countries. Journal of Economics and
Sustainable Development Vol. 17, No 18; ISSN (Paper)2222-1700 ISSN (Online)2222-2855
Kuznets, S., 1955. Economic growth and income inequality. American Economic Review 45, 1– 28.
Lederman, D. (2011). International trade and inclusive growth: a primer for busy policy analysts. The World Bank.
Lee, G. C., (2010). Foreign direct investment pollution and economic growth: Evidence from Malaysia. Applied Economic, 41, 1709-1716.
Lin, Ping and Saggi, Kamal (2004).Multinational Firms and Backward Linkages: A Survey and a Simple Model. Unpublished manuscript, Lingnan University and Southern Methodist University, 2004.
28
Lipsey, Robert E. (2003). Home and Host Country Effects of FDI. National Bureau of Economic Research Cambridge, MA) Working PaperNo. 9293, October 2002.
Makki, S. S., & Somwaru, A. (2004). Impact of foreign direct investment and trade on economic growth: Evidence from developing countries. American Journal of Agricultural
Economics, 86(3), 795-801.
Maku Olukayode, Adegboyega Emmanuel Soliu, Oyelade Aduralere Opeyemi (2018). The Impact of Foreign Direct Investment on CO2 Emission in Nigeria (1980 - 2014).International Journal of Scientific & Engineering Research Volume 9, Issue 2, February-2018 2061 ISSN 2229-5518
Narayan, P.K., Singh, B., 2007. The electricity consumption and GDP nexus for the Fiji Islands. Energy Economics 29, 1141–1150.
Narayan, P.K., Smyth, R., 2006. Higher education, real income and real investments in China: evidence from Granger causality tests. Education Economics 14, 107–125.
Omri, A. and Kahouli, B., 2014a. The nexus between foreign investment, domestic capital andeconomic growth: Empirical evidence from the MENA region. Research in Economics 68,257-263.
Omri, A. Nguyen, D K and C. Rault (2014). Causal interactions between CO2 emissions, FDI, and economic growth: Evidence from dynamic simultaneous equation models. Economic Modelling, 42, 382-389.
Pesaran, M. H., Shin, Y., & Smith, R. J. (2001). Bounds testing approaches to the analysis of level relationships. Journal of applied econometrics, 16(3), 289-326.
Porter, M. (1991), “America’s Green Strategy”, Scientific American Vol. 264(4), pp 168.
Porter, M. and van der Linde, C. (1995). Toward a new conception of the environment competitiveness relationship. Journal of Economic Perspectives, 9, 97-118.
Palmer, K et al (1995), “Tightening Environmental Standards: The Benefits-Cost or the No-Cost Paradigm?” Journal of Economic Perspectives.Vol. 9(4), pp 119-132.
Panayotou T. (1993), ‘Empirical tests and policy analysis of environmental degradation at differentstages of economic development’.WEP 2-22 Working Paper No. 238, International Labour Office, Technology and Employment Programme, Geneva.
Ram, R. (1985). Exports and economic growth: Some additional evidence. Economic
29
Rodrıguez-Clare, Andre´s. “Multinationals, Linkages, and Economic Development.” American Economic Review, September 1996, 86(4), pp. 852–73
Rodriguez, F., and D. Rodrik. “Trade Policy and Economic Growth: A Skeptic’s Guide to the Cross-Country Evidence.” Working Paper, National Bureau of Economic Research,Cambridge, MA, 1999.
Salvatore, D., & Hatcher, T. (1991). Inward oriented and outward oriented trade strategies. The
Journal of Development Studies, 27(3), 7-25.
Sachs, J., and A. Werner. “Economic Reform and the Process of Global Integration.” Brookings Papers on Economic Activity 1(1995):1–118.
Shahbaz, M., Nasreen, S., Abbas, F., & Anis, O. (2015). Does foreign direct investment impede environmental quality in high-, middle-, and low-income countries?. Energy Economics, 51, 275-287.
Smarzynska, B. K. and Wei, S. J. (2001) Pollution havens and foreign direct investment: dirty sector or popular myth? NBER Working Paper No. 8465.
Smarzynska Javorcik, Beata. 2004. "Does Foreign Direct Investment Increase the Productivity of Domestic Firms? In Search of Spillovers through Backward Linkages." American Economic Review, 94 (3): 605-627.DOI: 10.1257/0002828041464605
Solow, R. M. (1957). Technical change and the aggregate production function. The review of
Economics and Statistics, 39(3), 312-320.
UNCTAD (2018), World Investment Report – Investment and New Industrial Policies, Geneva: UNCTAD
Xing, Y. and Kolstad, C. (2002). Do lax environmental regulations attract foreign investment? Environmental and Resource Economics, 21, 1-22.
Zhang, Y. J. (2011). The impact of financial development on carbon emissions: an empirical analysis in China. Energy Policy, 39, 2197-2203.
30
Appendix
GRAPHICAL REPRESENTATION OF CUSUM AND CUSUMQ WHOLE PERIOD (1970-2017) -0.4 -0.2 0.0 0.2 0.4 0.6 0.8 1.0 1.2 1.4 15 20 25 30 35 40 45
CUSUM of Squares 5% Significance
-20 -15 -10 -5 0 5 10 15 20 15 20 25 30 35 40 45 CUSUM 5% Significance FIRST PERIOD (1970-1985) -0.4 0.0 0.4 0.8 1.2 1.6 75 76 77 78 79 80 81 82 83 84 85
CUSUM of Squares 5% Significance
-0.4 0.0 0.4 0.8 1.2 1.6 75 76 77 78 79 80 81 82 83 84 85 CUSUM of Squares 5% Significance
SECOND PERIOD (1986-2000) -10.0 -7.5 -5.0 -2.5 0.0 2.5 5.0 7.5 10.0 1991 1992 1993 1994 1995 1996 1997 1998 1999 2000 CUSUM 5% Significance -0.4 0.0 0.4 0.8 1.2 1.6 90 91 92 93 94 95 96 97 98 99 00
31 THIRD PERIOD (2001-2017) -10.0 -7.5 -5.0 -2.5 0.0 2.5 5.0 7.5 10.0 07 08 09 10 11 12 13 14 15 16 17 CUSUM 5% Significance -0.4 0.0 0.4 0.8 1.2 1.6 04 05 06 07 08 09 10 11 12 13 14 15 16 17 CUSUM of Squares 5% Significance