Original Research Paper
Developing crash modification factors for roundabouts
using a cross-sectional method
Mohammad Nour Al-Marafi
*, Kathirgamalingam Somasundaraswaran,
Ron Ayers
School of Civil Engineering and Surveying, Faculty of Health, Engineering and Sciences, University of Southern Queensland, Toowoomba, QLD 4350, Australia
h i g h l i g h t s
Estimation of crash frequency at roundabouts using negative binomial (NB) error distribution.
Application of the cross-sectional method to develop crash modification functions.
Significant risk factors that raise safety issues at roundabouts were investigated.
a r t i c l e i n f o
Article history:Received 14 June 2018 Received in revised form 9 October 2018
Accepted 15 October 2018 Available online xxx Keywords:
Safety performance Generalised linear models Crash modification factors Cross-sectional method Roundabouts
a b s t r a c t
The objective of the current study was to evaluate traffic and geometric features and their influences on the safety performance of roundabouts by developing suitable crash modi-fication factors (CMFs). The cross-sectional method can be applied as an alternative method to estimate the CMFs when before-and-after studies are impractical to apply, e.g., lack of data from the period after implementing treatments. To accomplish the study objective, CMFs were derived from generalised linear models (GLMs), i.e., negative binomial (NB) regression, using data collected on regional roundabouts in Toowoomba City, Australia. Six years of crash data from 49 roundabouts included all recorded crashes as well as traffic and geometric features for the entire roundabouts. Several candidate models were developed using the GLMs. Five models were selected based on statistical signifi-cance, goodness-of-fit (GOF) measures, and cumulative residual (CURE) analysis. The re-sults show that increasing the number of entry lanes, entry width, entry radius, traffic volume, circulatory roadway width, weaving width, and speed limit have positive effects on roundabout safety. On the other hand, increasing the number of legs, number of exit lanes, exit width, exit radius, weaving length, central island diameters, and presence of fixed object on a central island have negative effects on roundabout safety. The study shows that quantifying the risk factors can support road safety stakeholders to identify safety improvements at roundabouts more effectively and efficiently.
©2019 Periodical Offices of Chang'an University. Publishing services by Elsevier B.V. on
behalf of Owner. This is an open access article under the CC BY-NC-ND license (http://
creativecommons.org/licenses/by-nc-nd/4.0/).
*Corresponding author. Tel.:þ962 778 523 524.
E-mail addresses:[email protected](M.N. Al-Marafi),[email protected](K. Somasundaraswaran),[email protected]
(R. Ayers).
Peer review under responsibility of Periodical Offices of Chang'an University.
Available online at
www.sciencedirect.com
ScienceDirect
journal homepage: www .kea ipublishing.com/jtte
https://doi.org/10.1016/j.jtte.2018.10.012
2095-7564/©2019 Periodical Offices of Chang'an University. Publishing services by Elsevier B.V. on behalf of Owner. This is an open
1.
Introduction
Roundabouts are usually associated with a positive impact on traffic safety compared to other types of at-grade in-tersections. Thus, the road authorities are considering roundabouts as the preferred choice over the other types of
traffic control such as stop signs and traffic signals (Polders
et al., 2015). In particular, roundabouts have a low number of potential conflict points and their geometry motivates to reduce the vehicle speeds to where it helps to reduce the delay and reduces the number of decision points for road
users (Daniels et al., 2011). In regional areas where the traffic
volume through an at-grade intersection is moderate the use of roundabouts has increased as an effective way of controlling traffic.
In Australia, roundabouts have been used widely in both urban and rural areas. However, with the number of round-abouts increasing in regional areas, it is important to make sure that both existing and new roundabouts are safer for the road users. In particular, there is a need to consider the traffic and geometric characteristics of roundabouts that signifi-cantly affect both crash frequency and severity.
The main objective of the current study is to estimate crash modification factors (CMFs) to identify the safety performance for various traffic and geometric characteristics at round-abouts in Toowoomba City. To accomplish this objective, initially, crash prediction models (CPMs) were developed using a negative binomial (NB) distribution with a log-linear function. In addition, several goodness-of-fit (GOF) statistics were employed to evaluate the suitability of the models. The study results apply to those regional roundabouts with similar geometric and traffic conditions.
The remainder of the study is organized as follows. The second section presents the previous studies related to the development CPMs and CMFs. The third section describes the data used in the analysis. The fourth section presents model development. The fifth section describes the CMFs estimation. The last section draws conclusions from the analysis per-formed in this study.
2.
Literature review
A number of studies have been conducted to investigate the effects of the geometric elements and traffic conditions on
safety at roundabouts (Anjana and Anjaneyulu, 2014; Daniels
et al., 2011; De Brabander and Vereeck, 2007; Farag and Hashim, 2017; Kamla et al., 2016). In order to better under-stand crash causes and contributing factors, the researchers have paid considerable attention to developing different analytical approaches. The generalized linear model (GLM) approach (i.e., Poisson and negative binomial (NB) models) have proven to be a reliable method to reveal the relationship between the road crashes and explanatory variables. This is due to the fact that Poisson and NB distributions are able to describe adequately the random, non-negative, discrete, and typically sporadic events which are characteristics of crash
frequency (Abdel-Aty and Radwan, 2000; Ackaah and Salifu,
2011; Hadi et al., 1995).Abdel-Aty and Radwan (2000)stated
that the Poisson distribution has some limitations, such that
it is not able to handle the over-dispersion. The
phenomenon of“over-dispersion”occurs when the observed
variance is greater than the mean. In contrast, NB distribution does not require the assumption of observed
variance being equal to the mean (Anjana and Anjaneyulu,
2014; Chin and Quddus, 2003; Kamla et al., 2016). In such a
case,Kamla et al. (2016)developed a crash prediction model
(CPM) using NB distribution to investigate the impacts of roundabout geometric and traffic characteristics on safety.
Similar to this study,Daniels et al. (2011)employed Poisson
distribution to identify the safety performance at
roundabouts. In these studies, the NB or Poisson
distributions were selected for safety analysis based on the dataset type, i.e., NB when the dataset was over-dispersed and Poisson when it was not.
Kim and Choi (2013)identified the major factors associated with road crashes at roundabouts in South Korea. In this study, NB distribution models were applied to analyse the impact of contributory factors on road safety using data from 14 roundabouts, where a total of eleven explanatory variables were examined. The results showed that six
explanatory variables have significant impacts on
roundabout safety including: number of approaches,
circulating lane width, entry width, flare length, flare width, and circulating lane radius. Likewise, five explanatory variables have no significant impacts on roundabout safety including: inscribed circle diameter, central island diameter, number of entering lanes, entry lane radius, and number of circulating lanes. It is worth mentioning that this study has some limitations such as the use of a small sample size.
Kamla et al. (2016) investigated the traffic and geometric characteristics and their impacts on the frequency of crashes, where crash records from a total of 70 roundabouts were used. The results indicated that the crash frequency tended to increase as the traffic volume and inscribed circle diameter increased.
Crash modification factors (CMFs) identify the change in road safety (crash frequency) resulting from implementing a particular treatment. This treatment may be in the form of design modification, change in traffic operations, or any countermeasures. The recognition of any change in geometric design features or traffic operation will increase or decrease crash frequency. There are several methods to estimate CMF values and these methods vary from a before-and-after study with a comparison group to relatively more sophisticated methods such empirical Bayes (EB) and full Bayes (FB) methods. These methods include estimating safety perfor-mance based on safety data before-and-after a specific
treat-ment is impletreat-mented on either one or several sites (Shahdah
et al., 2014). The EB and FB methods can be used to control for regression-to-mean (RTM) bias associated with observational
studies (Gross et al., 2010; Hanley et al., 2000; Persaud and
Lyon, 2007; Wood et al., 2015). Although EB and FB methods
are considered as the more preferred methods for
estimating CMFs, there are some practical limitations associated with these methods such as countermeasures or treatment implementation dates should be known to determine the before-and-after evaluation periods, sufficient years have to pass after treatments are implemented, and it Please cite this article as: Al-Marafi, M.N et al., Developing crash modification factors for roundabouts using a cross-sectional
is difficult to distinguish safety effects when more than one
treatment has been implemented at a specific site (Hauer,
1997; Persaud et al., 2010; Wood et al., 2015). Alternative safety evaluation methods are required to overcome these limitations, but they should be able to address RTM bias that is common to observational studies.
The cross-sectional method has been widely used in the
recent years to overcome these issues (Anjana and
Anja-neyulu, 2014; Gross et al., 2010; Li et al., 2010; Park et al., 2015; Wu and Lord, 2016). In this method, the value of a CMF can be estimated directly from the coefficient of the variable associ-ated with the proposed treatment. Thus, it is not necessary to have data on a specific treatment before-and-after imple-mentation compared to other methods. It is worth mentioning that the cross-sectional method does not take into account the effects of factors that are not included in the analysis, i.e.,
external causal factors (Gross et al., 2010; Hauer, 2013).
Another criticism is that a sufficient sample size is especially required when large explanatory variables are included in the
developed model.Park et al. (2015) and Wood et al. (2015)
evaluated the treatment effectiveness using both an EB observational before-and-after method and a cross-sectional method. The studies concluded that the results from the cross-sectional method seem to be consistent with the EB
method results. However,AASHTO (2010)indicated that the
cross-sectional method might be appropriate when
observational before-and-after studies are not practical due to data restrictions (e.g., crash data in the before period are not available).
Ideally, it is not logical to assume a systematic safety effect for all treated sites with different characteristics. For instance, greater benefits of safety improvements may be obtained at the sites with high traffic volume. Thus, as a part of the cross-sectional method, a crash modification function (CMFunction) formula can be developed to estimate the variation in the values of CMF with different sites characteristics. This method has already investigated by researchers to estimate the effects
of safety improvements (Elvik, 2011; Gross et al., 2010; Gross
and Donnell, 2011; Lee et al., 2015; Park et al., 2015; Sacchi et al., 2014). However, it should be pointed out that there are few studies that have investigated the effects of safety im-provements at roundabouts through using CMFunctions.
3.
Data preparation
The current study is conducted using the crash data from 49 roundabouts in Toowoomba City, Australia. The selected roundabouts consist of 47 single-lane roundabouts and two multi-lane roundabouts. For each roundabout, the observed crashes, traffic volume, and geometric features were collected
for the years 2010e2015. Crash data was obtained from the
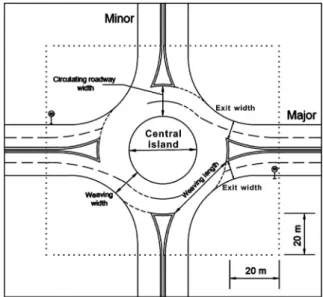
Department of Transport and Main Roads (DTMR), Queens-land. This data consisted of information about each crash such as crash time, location, severity level, persons involved, traffic control type, and speed limit. Fatal and injury crashes that occurred at the roundabout area and within 20 m measured towards upstream from the give way line were
included in the dataset, as shown inFig. 1. Fatal and injury
crashes were selected to increase the significant to the
analysis, so the damage only type crashes were removed from the dataset.
Traffic volume data for selected roundabouts was also obtained from the jurisdiction road authorities such as Too-woomba Regional Council and Department of Transport and Main Roads, Queensland. Road geometric features were collected from historical design records, site visits, and Google Earth.
The datasets were divided into two groups. The first group of data was used to develop the crash prediction models based
on three years (2010e2012). The second group was used for
validation of the models against additional years (2013e2015)
of crash data for the same roundabouts used in the develop-ment of the models. This validation was used to evaluate the
models'capability to predict crashes across time. Twenty-one
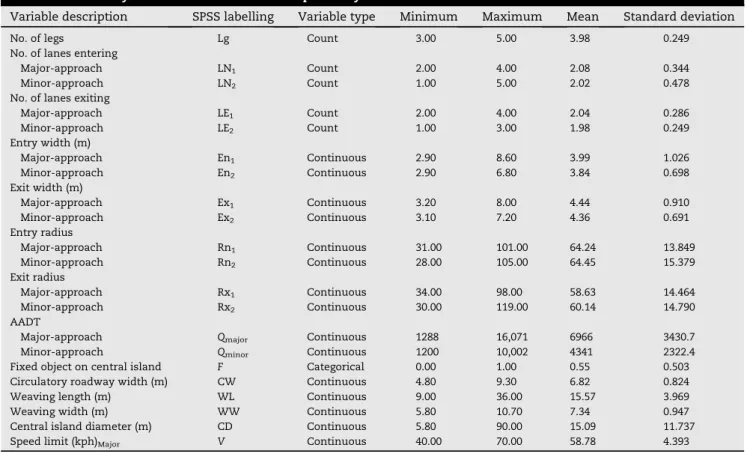
explanatory variables describing traffic and road geometry were used in modelling as the most common factors which have been associated with road crashes at the roundabouts. A statistical summary of the explanatory variables considered in the development of safety models and the manner in which
they are defined in the datasets is shown inTable 1.
Likewise, the roundabout geometric features include number of lanes entering and exiting, width of entry and exit lane, average radius of entry and exit path, width of circula-tory roadway, length and width of weaving section, and cen-tral island diameter, and other associated elements are
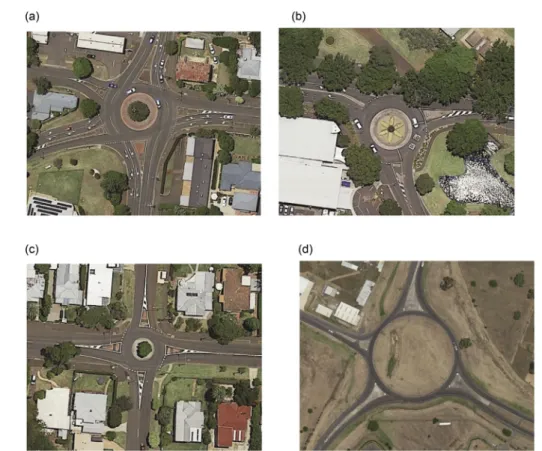
identified inFigs. 1 and 2. The examples of roundabout layouts
that were used in the study are presented inFig. 3.
4.
Model development
4.1. Model selection and estimation
The CPMs were developed using a generalized linear model-ling (GLM) approach. Two types of GLM were identified for use in this study: negative binomial (NB) and Poisson distribu-tions. As mentioned previously, these two types are more
appropriate to analysing crash data (Abdul Manan et al., 2013;
Lord and Mannering, 2010). In order to find which of these two models was suitable for estimating safety outcomes, the study adopted the over-dispersion assumption. The phenomenon of
“over-dispersion”occur when the observed variance is greater
than the mean of the datasets. Initially, the distributions of crash counts were assumed to follow a negative binomial distribution that deals with over-dispersion within the data-sets. This assumption has been tested based on the value of
the deviance divided by the degree of freedom (df) as well as
the value of the Pearson chi-square (x2) divided by the degree
of freedom (df). If the result of these tests lies between 0.8 and 1.2, the NB model assumption will be accepted. Also, if it is out of this range the Poisson model will be used instead of NB
model (Abdul Manan et al., 2013).
The general form of the predicted model by using Poisson
or NB model assumption for theith roundabout can be written
in the form of Eq.(1).
Npre;i¼Qmajor;ia1 Qminor;ia2 e
b0þP
n
j¼1
bjXij
(1)
whereNpre.iis predicted crash frequency atith roundabout,
Qmajor,iandQminor,iare annual average daily traffic (AADT) on
major and minor approach atith roundabout, respectively,Xij
is explanatory variablejatith roundabout, anda1,a2,b0, andbj
are model parameters.
Initially, the correlation among the explanatory variables were tested as they were useful to prevent the use of strongly correlated variables together within a model, i.e., strong cor-relation variables would strongly affect the other parameters in the same model. In particular, any two explanatory
vari-ables whose correlation test had between 0.49 and þ0.49
(moderate correlation) was proposed in modelling. In addition, the variable parameters were considered to be sta-tistically significant at 0.1 significance level (using 90% confidence).
The data analysis and model development was undertaken
using SPSS software version 23 (IBM Corp, 2015). Different
models were developed and fitness of results was assessed
Table 1eSummary statistics of roundabout's explanatory variables.
Variable description SPSS labelling Variable type Minimum Maximum Mean Standard deviation
No. of legs Lg Count 3.00 5.00 3.98 0.249
No. of lanes entering
Major-approach LN1 Count 2.00 4.00 2.08 0.344
Minor-approach LN2 Count 1.00 5.00 2.02 0.478
No. of lanes exiting
Major-approach LE1 Count 2.00 4.00 2.04 0.286 Minor-approach LE2 Count 1.00 3.00 1.98 0.249 Entry width (m) Major-approach En1 Continuous 2.90 8.60 3.99 1.026 Minor-approach En2 Continuous 2.90 6.80 3.84 0.698 Exit width (m) Major-approach Ex1 Continuous 3.20 8.00 4.44 0.910 Minor-approach Ex2 Continuous 3.10 7.20 4.36 0.691 Entry radius Major-approach Rn1 Continuous 31.00 101.00 64.24 13.849 Minor-approach Rn2 Continuous 28.00 105.00 64.45 15.379 Exit radius Major-approach Rx1 Continuous 34.00 98.00 58.63 14.464 Minor-approach Rx2 Continuous 30.00 119.00 60.14 14.790 AADT
Major-approach Qmajor Continuous 1288 16,071 6966 3430.7
Minor-approach Qminor Continuous 1200 10,002 4341 2322.4
Fixed object on central island F Categorical 0.00 1.00 0.55 0.503 Circulatory roadway width (m) CW Continuous 4.80 9.30 6.82 0.824
Weaving length (m) WL Continuous 9.00 36.00 15.57 3.969
Weaving width (m) WW Continuous 5.80 10.70 7.34 0.947
Central island diameter (m) CD Continuous 5.80 90.00 15.09 11.737 Speed limit (kph)Major V Continuous 40.00 70.00 58.78 4.393
Fig. 2eEntry and exit path radius.
based on the confidence level and the correlation values between the variables. Furthermore, a comparison of the developed models was performed using goodness-of-fit (GOF) measures including Akaike information criterion (AIC) and Bayesian information criterion (BIC). The smaller of the AIC and BIC values was considered better than the other
models with higher values (Abdul Manan et al., 2013; Cafiso
et al., 2010). After several trials of a different combination of variables, five models were identified and estimated using negative binomial (NB) error structure with log link function. The estimated regression parameters for the selected road
safety models for the roundabouts are presented inTable 2.
It is worth mentioning that some main explanatory variables (e.g., traffic volume on major approach) showed slightly stronger correlation with the other variables. Due to
this correlation these variables have ap-value higher than 0.1.
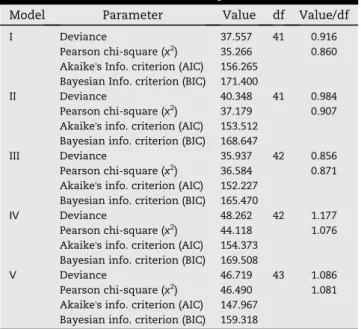
The deviance and Pearson chi-square (x2) statistics divided
by its degrees of freedom (df) were estimated to be 0.916 and 0.860 for model I, 0.984 and 0.907 for model II, 0.856 and 0.871
for model III, 1.177 and 1.076 for modelⅣ, and 1.086 and 1.081
for modelⅤrespectively as shown inTable 3. Specifically, the
values of these two tests are within the allowable range (i.e., 0.8 and 1.2) implying that the NB distribution assumption is acceptable.
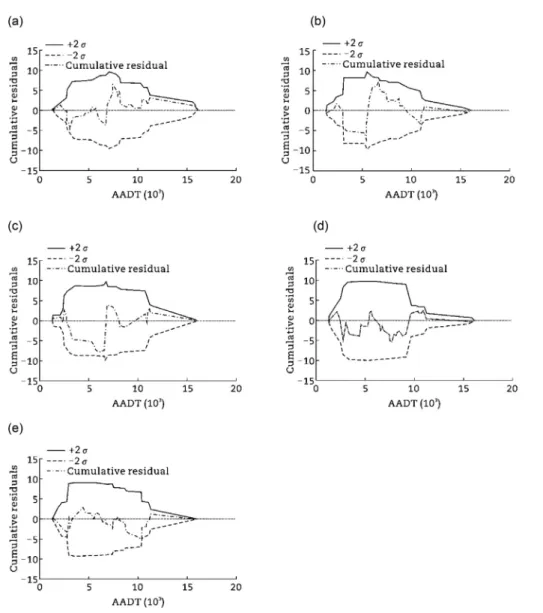
The GOF for the selected models was also investigated using the cumulative residuals (CUREs) plot. This method needed to achieve two conditions to indicate that the model fitted the data well: 1) the curve lies within two standard
de-viations (þ2sand 2sboundaries) of the mean and 2) the
curve oscillate around zero.Fig. 4shows the CURE plot, as a
function of AADT, for all selected models. As noted in this figure, the CURE curve for all selected models are within the standard deviation boundaries which mean that all models are fitting the data well.
4.2. Model validation
The validation measures were used in this study to assess the
models'ability to predict road crashes over additional years.
Four performance measures were used to validate the models including the mean squared prediction error (MSPE), mean absolute deviation (MAD), mean squared error (MSE), and
FreemaneTukey R-squared coefficient (R2
FT). These
perfor-mance measures can be calculated using the following
equa-tions (Washington et al., 2005).
MSPE¼1nX n i¼1 y0iyi 2 (2) MSE¼n1pXn i¼1 y0iyi 2 (3) MAD¼1 n Xn i¼1 y0iyi (4) R2 FT¼ Pni¼1ðG iG 0 Þ2Pn i¼1be 2 i Pni¼1ðG iG0Þ2 (5)
Fig. 3eExamples of roundabout layouts (Google Earth, 2018). (a) 5-legged roundabout. (b) 3-legged roundabout. (c) First
wherey0iis predicted crashes number atith roundabout,yiis
observed crashes number at ith roundabout, n is sample
size of database, p is number of model parameters, Gi is
FreemaneTukey transform of yi ðGi¼ p þffiffiffiffiyi
ffiffiffiffiffiffiffiffiffiffiffiffiffi
yiþ1
p
Þ, G0 is
sample mean of Gi, bei is FreemaneTukey deviate at ith
roundabout (bei¼Gi ffiffiffiffiffiffiffiffiffiffiffiffiffiffiffi 4y0 iþ1 p ).
MSPE is used to determine the variance of the difference between observed crashes and predicted crashes results. In addition, it is typically employed to evaluate error associated with a validation dataset. MSE is typically employed to evaluate error associated with an estimation dataset. Ideally, MSPE and MSE results can be used to reveal whether the
models are over-fitted (MSPE > MSE) or under-fitted
(MSPE < MSE) (Bissonette and Cramer, 2008; Washington
et al., 2005; Young and Park, 2013). When the values of MSPE and MSE are similar, this indicates that the validation data-set fit the developed model similar to the estimation datadata-set. The MAD value provides a measure of the average magnitude of the prediction variability. In general, a smaller value (closer to zero) of MSPE, MAD, or MSE refers to lower
pre-diction error. Likewise, the higher values ofR2
FT indicate a
better prediction performance and vice-versa (Washington
et al., 2005).
Table 4shows the results of the validation tests for the
estimation dataset (2010e2012) and the validation dataset
(2013e2015). The models were developed using the
estimation dataset. The values of MSPE using validation dataset and MSE using estimation dataset are similar for all developed models, which represents a high level of transferability of the models. The same result was obtained for MAD where the estimation data and the validation data are similar for all developed models,
whereas, the R2
FT test results were slightly lower for the
validation data than that for the estimation data. This could be due to the difference of the datasets used to estimate and validate the models.
Table 2eNegative binomial parameter estimates for selected models.
Parameter Model I Model II Model III ModelⅣ ModelⅤ
b p-valueb b p-valueb b p-valueb b p-valueb b p-valueb
Intercept 15.930 0.000 15.471 0.000 10.618 0.000 10.616 0.003 12.606 0.000 Lg e e 0.467 0.121 e e e e e e LN1 e e e e e e 0.564 0.000 e e LN2 e e e e 0.022 0.233 e e e e LE1 0.338 0.008 e e e e e e e e LE2 e e e e e e e e 0.079 0.267 En1 e e e e e e e e 0.307 0.000 En2 e e e e 0.367 0.004 e e e e Ex1 0.068 0.000 e e e e e e e e Ex2 e e e e e e 0.005 0.108 e e Rn1 e e e e 0.032 0.000 Rn2 e e 0.035 0.000 e e Rx1 e e e e e e 0.020 0.000 e e Rx2 e e e e 0.024 0.000 e e e e Qmajor 0.241 0.117 1.163 0.000 0.403 0.063 0.954 0.000 0.438 0.004 Qminor 1.121 0.000 e e 0.915 0.000 e e 0.923 0.000 Fc e e 0.052 0.103 e e e e e e CW e e e e e e 0.063 0.208 e e WL e e 0.010 0.006 e e e e e e WW 0.305 0.033 e e e e e e e e CD 0.005 0.001 0.012 0.037 0.020 0.000 e e e e V 0.038 0.057 0.023 0.138 e e e e e e Dispersion (k) 0.208a e 0.110a e 0.200a e 0.220a e 0.203a e Note:
a Computed based on the Pearson chi-square. bSignificance at 0.1 level.
c Fixed object is 1 if present and is 0 if not present.
Table 3eGoodness-of-fit tests for predicted models.
Model Parameter Value df Value/df
I Deviance 37.557 41 0.916
Pearson chi-square (x2) 35.266 0.860
Akaike's Info. criterion (AIC) 156.265 Bayesian Info. criterion (BIC) 171.400
II Deviance 40.348 41 0.984
Pearson chi-square (x2) 37.179 0.907
Akaike's info. criterion (AIC) 153.512 Bayesian info. criterion (BIC) 168.647
III Deviance 35.937 42 0.856
Pearson chi-square (x2) 36.584 0.871
Akaike's info. criterion (AIC) 152.227 Bayesian info. criterion (BIC) 165.470
Ⅳ Deviance 48.262 42 1.177
Pearson chi-square (x2) 44.118 1.076
Akaike's info. criterion (AIC) 154.373 Bayesian info. criterion (BIC) 169.508
Ⅴ Deviance 46.719 43 1.086
Pearson chi-square (x2) 46.490 1.081
Akaike's info. criterion (AIC) 147.967 Bayesian info. criterion (BIC) 159.318
5.
Estimating crash modification factors
5.1. Crash modification function
CMFunction method was employed in this study to estimate the road safety effect for each explanatory variable that was used in developing the CPMs at roundabouts. More specif-ically, this method was applied based on the parameter of the explanatory variable associated with the proposed treatment type. In this method, the value of CMF was estimated for a
particular treatment type (i.e., variable) using Eq.(6)as follows
(Lord and Bonneson, 2007).
CMFi¼ebiðXiXibÞ (6)
whereXiis observed value for the variablei,Xibis base
con-dition for the variablei,biis model parameter for the variablei.
A CMF value of 1.0 represents no effect on safety, while CMF above 1.0 indicates a treatment resulting in a higher number of crashes. In contrast, a CMF below 1.0 indicates a treatment resulting in lower crash numbers.
The standard error (SE) of the CMF for each treatment type
was also calculated using Eq. (7) as follows (Bahar, 2010;
Harkey et al., 2008; Park et al., 2015).
SEi¼
ebiðXiXibÞþSEbiebiðXiXibÞSEbi
2 (7)
where SEiis standard error of the CMFi, SEbiis standard error of
the model parameterbi.
It should be noted that when the value of standard error equals 0.1 or less, this indicates that a CMFunction result is more reliable. The base condition values in this study were adopted from previous studies as well as the mean values of an individual explanatory variable. By definition, the base condition can be defined as the condition associated with CMF value 1.0.
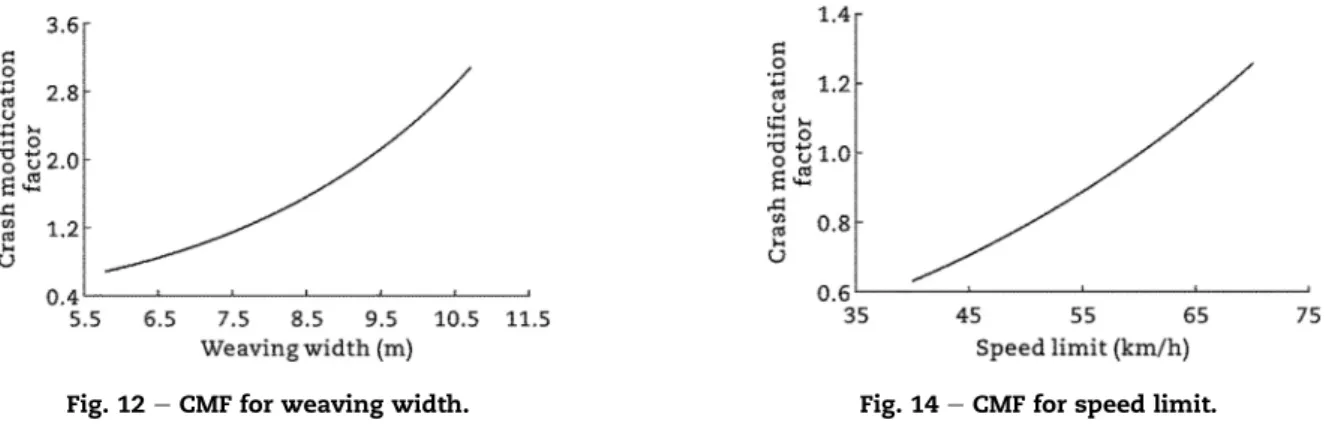
Table 5shows the CMFunctions used to estimate the values of CMF for safety effects of the traffic and geometric elements of a roundabout. CMFunctions were derived from the
developed models (i.e., Models IeⅤ) based on the presence of
the explanatory variable and the goodness-of-fit for the model. It can be noted that the models were developed
based on the total entry lanes on major and minor
approaches. Consequently the associated regression
parameters (i.e., 0.564 for major and 0.022 for minor) have been doubled for both major and minor approaches. Therefore, the regression parameters were divided by two to estimate the CMFs for the number of entry lanes based on
each entry approach (Li et al., 2010; Lord and Bonneson,
2007). The same method was used for exit lanes on major
and minor approaches, where the associated regression parameters have been doubled.
5.2. Discussion of CMF results
The following sections discuss the safety effects of different traffic and geometric elements based on the values of CMF.
5.2.1. Number of legs
The 4-legged roundabout was adopted as a base condition to estimate CMFs. The results revealed that the 5-legged round-about was associated with more crashes than 3-legged and legged roundabouts. When the roundabout changed from 4-legged to 3-4-legged the number of crashes reduced by 37% and in the same way when the number of legs increased from 4-legged to 5-legged the number of crashes increased by 60%. This result was expected because the traffic volume and vehicle in-teractions at roundabouts will increase after adding more legs. A similar result has also been concluded in previous studies (Kim and Choi, 2013; Shadpour, 2012). It should be pointed out that the number of roundabout legs should preferably be limited to 4, as increased conflicts occur at multi-lane roundabout exits.
5.2.2. Number of entry lanes
The results indicate that the number of entry lanes was associated with more crashes for both major and minor ap-proaches. For instance, after adding one entry lane on a major approach or a minor approach, probability of crashes in-creases by 25% and 1%, respectively. It can be noticed that the effect of the number of entry lanes at a major approach is found to be more significant than at a minor approach and this
is probably due to the difference in traffic volume.Turner et al.
(2009) also concluded that the multiple entry lanes are associated with greater crash frequency. In general, the number of entry roundabout lanes provided on major or minor approaches should be limited to the minimum number that meets the required capacity and operating requirements for the traffic volumes.
5.2.3. Number of exit lanes
The results indicate that road crashes increased by 18% and 4% after adding one exit lane on a major approach and a minor approach, respectively. This result was expected because the number of conflict points increases at the multi-lane en-trances and exits when compared to the single-lane condi-tions. Therefore, the number of exit lanes should be limited by the number of circulating lanes to prevent the conflict be-tween the merging and diverging vehicles.
5.2.4. Entry width
The results show that wider entry width at major and minor approaches was associated with higher road crash numbers
Table 4 e Perfo rma nce measu res for all pre dicted mode ls. Perform ance meas ure Mode l I Mode l II Model III Mode l Ⅳ Mode l Ⅴ 20 10 e 2012 a 2013 e 20 15 b 2010 e 2012 a 20 13 e 2015 b 2010 e 2012 a 2013 e 2015 b 2010 e 2012 a 2013 e 2015 b 20 10 e 2012 a 2013 e 2015 b MSPE e 1.639 e 2.240 e 2.021 e 2.229 e 1.710 MSE 1.942 e 2.253 e 2.596 e 2.280 e 1.873 e MAD 0.944 0.966 0.915 1.070 0.940 0.963 1.013 0.974 0.923 0.929 R 2 FTð % Þ 56.1 43.7 57.1 31.4 58.7 46.7 55.6 39.3 59.8 47.6 Note: a Calculated based on estimation dataset 2010 e 2012. b Calculated based on validation dataset 2013 e 2015.
compared with narrow width. This result is possible because the wider entry width is associated with higher vehicles speed at the entry of the roundabout. Designers should therefore aim to make entry lane widths no wider than necessary. Furthermore, the entry width must be able to accommodate
the path of entering design vehicles. Fig. 5 represents the
effect of entry width on road safety for both minor and major approaches.
5.2.5. Exit width
The study was also examined the effect of exit width in major and minor approaches at the roundabouts. The results revealed that a wider exit width for both major and minor approaches increased road safety. This result is possibly because the wider exit width increases comfort for drivers to exit the roundabout safely and to ensure that the exit width accommodates the swept path of the design vehicle (AUSTROADS, 2015). In roundabout design it is usually desirable to reduce entry width and entry path radius to
slow vehicles, but to allow for vehicles to accelerate on the exit. Thus, the width of the exit must usually be wider than
the entering width. Fig. 6 shows the relationship between
exit width and road safety, where the exit width on minor approaches appears to have less impact on road safety compared to exit width on major approach.
5.2.6. Entry radius
The entry radius or entry path radius is one of the most important factors among geometric parameters at a
round-about, since it affects both safety and capacity (Montella et al.,
2012). A large entry path radius usually results in faster entry
speeds and results in additional road crashes. The larger entry path radius for both minor and major approach is associated
with more road crashes at roundabout as shown in Fig. 7.
Also, it can be noticed from the figure that the effect on CMF values of entry path radius for both minor and major approach is roughly the same.
Fig. 5eCMF for entry width. Fig. 6eCMF for exit width.
Table 5eEstimated CMFs using a cross-sectional method.
Roundabout feature Base valuea CMFunction SE of model parameterb
Lg 4 legs e0:467ðLg4Þ 0.050
LN1 2 lanes per approach e0:282ðLN12Þ 0.021
LN2 2 lanes per approach e0:011ðLN22Þ 0.014
LE1 2 lanes per approach e0:169ðLX12Þ 0.028
LE2 2 lanes per approach e0:040ðLX22Þ 0.236
En1 4.2 m e0:307ðEn14:2Þ 0.106 En2 4.2 m e0:367ðEn24:2Þ 0.030 Ex1 4.2 m e0:068ðEx14:2Þ 0.005 Ex2 4.2 m e0:005ðEx24:2Þ 0.065 Rn1 60 m e0:032ðRn160Þ 0.010 Rn2 60 m e0:035ðRn260Þ 0.008 Rx1 60 m e0:020ðRx160Þ 0.010 Rx2 60 m e0:024ðRx260Þ 0.014
Qmajor 7000 veh/d ðQmajor=7000Þ0:438 0.034
Qminor 4000 veh/d ðQminor=4000Þ0:923 0.033
F 0 (no object) e0:052ðF0Þ 0.272 CW 7 m e0:063ðCW7:0Þ 0.197 WL 15 m e0:01ðWL15Þ 0.069 WW 7 m e0:305ðWW7:0Þ 0.143 CD 15 m e0:02ðCD15Þ 0.015 V 60 kph e0:023ðV60Þ 0.040 Note:
a Adopted from previous studies and from mean values of individual covariates. bCMFunction result is more reliable when the SE equals or less than 0.10.
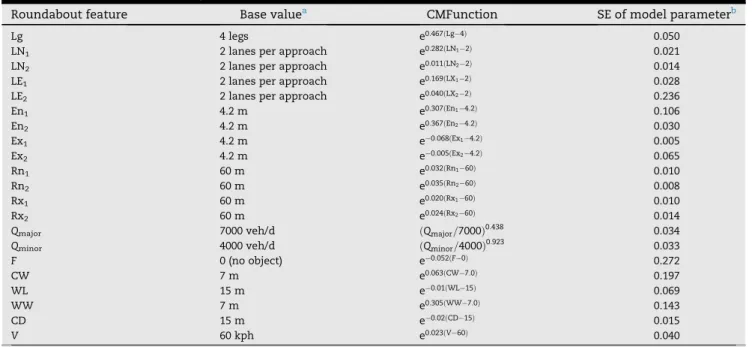
5.2.7. Exit radius
A smaller exit radius results in increased safety risk for both major and minor approaches at roundabouts. As mentioned early, the exit from the roundabout must be as comfortable and easy for a driver as possible. Entries of roundabouts are designed to decrease vehicle speeds, whilst exiting should be able to allow the vehicles to increase speed out of the circu-lating roadway. Thus, the exit radius should generally be greater than entry radius for safety and operational issues at roundabouts. The study found that a higher exit radius is
associated with less crash risk as shown inFig. 8. For instance,
at the major approach, the percent of crash reduction after increasing exit radius by 10 m was 18%. This result agrees
with the previous study done byAnjana and Anjaneyulu (2014).
5.2.8. Traffic volume (AADT)
Highway Safety Manual (AASHTO, 2010) uses traffic volume as
a significant predictor in studying road safety. In this study, the base condition for a major approach was adopted at 7000 vehicles per day and for a minor approach at 4000 vehicles per day. These values were adopted based on
the mean values of traffic volumes in the dataset. Fig. 9
shows that the crash risk increases with increasing traffic volumes. The results also show that the volume on the minor approach has a larger impact on safety than major approach at high traffic volumes. This may be due to the difference in geometric characteristics (i.e., lane width, number of lane, etc.) between minor and major approaches.
5.2.9. Fixed object
Fixed objects like trees may be placed within a central island area, provided it is large enough to ensure that clear zone
requirements are met and the sightlines for drivers are not obstructed. In most cases, these fixed objects can be placed on the central island to reduce the entry speed of the vehicles and
enhances the driver's attention approaching the roundabout.
The study found that roundabouts with fixed objects have about 5% less crashes than roundabouts without fixed objects. 5.2.10. Circulatory roadway width
The circulating roadway is the portion of roundabout between the inscribed circle and the central island used by vehicular
traffic, as shown in Fig. 1. The circulating roadway width is
recommended to be about 1.0e1.2 times the entry width to a
roundabout (Montella et al., 2012). However, a wider
circulatory roadway width should be avoided, especially at a single-lane roundabout, where drivers may think that two vehicles are allowed to drive side by side within the
roundabout.Fig. 10shows that the wider circulatory roadway
width is associated with greater crash risk at roundabouts. 5.2.11. Weaving length
A weaving section is a dynamic portion in the roundabout, where vehicles carry out one or more lane changes to com-plete merging and diverging operations. The two significant parameters in the analysis of weaving sections, based on road safety and capacity, are weaving length and weaving width (Golob et al., 2004). This study has also investigated the impact of weaving length on road safety. The results revealed that an increase in weaving length results in a decrease in crash risk. This result was reasonable because a long distance of weaving length decreases the probability of crashes as a result of sufficient space and time to complete merging or diverging
operations. Fig. 11 illustrates the relationship between
weaving length and road safety.
Fig. 7eCMF for entry radius.
Fig. 8eCMF for exit radius.
Fig. 9eCMF for traffic volume (AADT).
Fig. 10eCMF for circulatory roadway width.
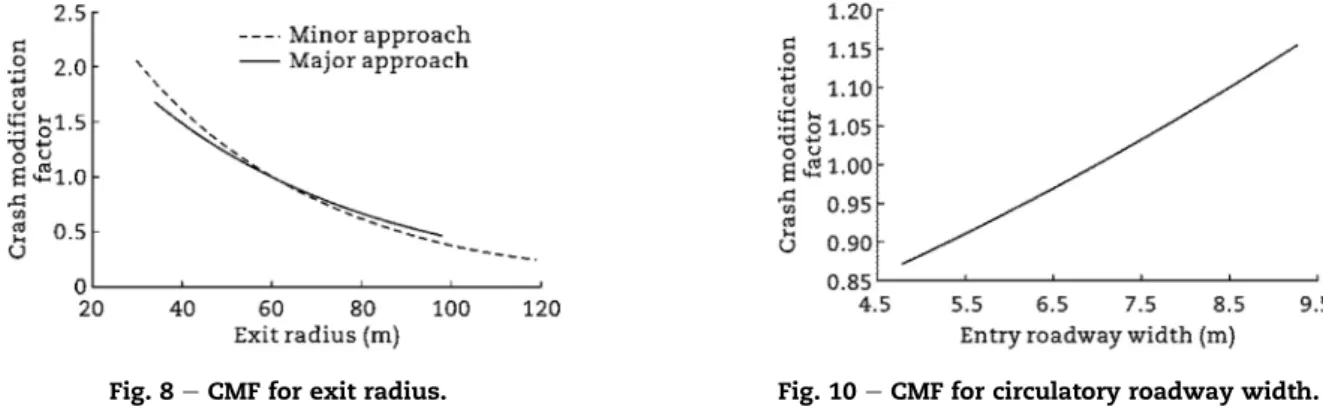
5.2.12. Weaving width
As mentioned previously, one source of vehicles conflicts at the roundabout is the weaving section, where the merge and diverge occur between vehicles. The impact of weaving width on road safety was investigated in this study. The results showed that a wider weaving width results in an increase in
crash risk, as shown inFig. 12. The wider weaving width, as in
the circulatory roadway width, can lead to attempts by vehicles to pass each other, resulting in high speed driving and therefore increased risk.
5.2.13. Central island diameter
The geometry of a central island should be designed to reduce high entry speeds to the roundabout. Likewise, the shape of central islands should preferably be circular because changes in curvature of the circulating carriageway lead to a variance in speeds and increases the complexity for drivers. Wider central island diameters are preferable, as it reduces of entry vehicle speeds. This is due to a reduction of the angle formed
between the circulating and entering vehicle paths
(AUSTROADS, 2015). The base condition in this study was an island diameter of 15 m and this value was adopted based on the mean values of the central island diameters in the
dataset.Fig. 13shows that the wider central island diameter
roundabout was associated with lower crash risk. A similar
result has been concluded byKim and Choi (2013).
5.2.14. Speed limit
Speed limit is one of the most important parameters that
significantly affect road safety at roundabouts (AUSTROADS,
2015). Ideally, lower operating speeds at roundabouts are
associated with increased driver reaction time and thus
reduce the number and severity of road crashes that do occur. In this study, the speed limits on major approaches were analysed and estimated the CMF values as shown in
Fig. 14. The results indicated that the crash risk increases as posted speed limit increases. For instance, a 10 km/h increase in speed limit leads to a 26% increase in the expected number of crashes.
6.
Summary and conclusions
The main objective in the current study is to evaluate the safety performance of different roundabout elements using a cross-sectional method. In this study, safety performance models are developed to predict the total number of crashes (i.e., fatal and injury crashes) at roundabouts in regional areas based on measurable explanatory variables. The negative binomial (NB) distribution with a log-function has been used to estimate the model parameters. The crash data used in this study observed over a six-year period from 49 roundabouts in the Toowoomba City, Australia. Five models were identified as recommended models based on statistical significance, GOF measures and CURE analysis. It is worth mentioning that the cross-sectional method used in this study does not consider crash risks that would be attributed to external causal factors. However, this method is a viable alternative method that can be adopted in cases where observational before-and-after studies are not practical due to data restrictions, e.g., dates of treatment installation are unknown or installation of more than one treatment at the same time to an entity. The results indicated that several roadway traffic and geometric elements affect the safety at roundabouts. It was found that increasing
Fig. 11eCMF for weaving length.
Fig. 12eCMF for weaving width.
Fig. 13eCMF for central island diameter.
the number of legs, number of exit lanes, exit width, exit radius, weaving length, central island diameters, and the presence of a fixed object on a central island are associated with increased total crash frequency. On the other hand, increasing other variables such as number of entry lanes, entry width, entry radius, traffic volume, circulatory roadway width, weaving width, and speed limit are associated with reduced total crash frequency.
Some limitations to the current study must be taken into consideration. It is clear that the study models were esti-mated based on a sample of roundabouts in one particular city and can therefore not claim to be adequate for all roundabout in other situations. Hence, the values of CMF in this study are only applicable to those roundabouts with similar geometric and traffic conditions, i.e., within the range of the datasets used.
Further work may be needed to extend the present study. It is important to estimate the safety effects (i.e., CMFs) based on various severity levels and crash types. From this it may be possible to identify the impact of various treatment types on crash type and severity. In addition, studying additional roundabout geometric and operational features would extend the scope of the future studies to improve the overall safety at roundabouts.
Conflict of interest
The authors do not have any conflict of interest with other entities or researchers.
Acknowledgments
The first author gratefully acknowledges the financial support from a Tafila Technical University scholarship for carrying out his PhD study at the University of Southern Queensland. The authors acknowledge the data support by the Department of Transport and Main Roads and Toowoomba Regional Council.
r e f e r e n c e s
Abdel-Aty, M.A., Radwan, A.E., 2000. Modeling traffic accident occurrence and involvement. Accident Analysis&Prevention 32 (5), 633e642.
Abdul Manan, M.M., Jonsson, T., Varhelyi, A., 2013. Development of a safety performance function for motorcycle accident fatalities on Malaysian primary roads. Safety Science 60, 13e20.
Ackaah, W., Salifu, M., 2011. Crash prediction model for two-lane rural highways in the Ashanti region of Ghana. IATSS Research 35 (1), 34e40.
American Association of State Highway and Transportation Officials (AASHTO), 2010. Highway Safety Manual, first ed. American Association of State Highway and Transportation Officials, Washington DC.
Anjana, S., Anjaneyulu, M.V.L.R., 2014. Development of safety performance measures for urban roundabouts in India. Journal of Transportation Engineering 141 (1), 04014066.
AUSTROADS, 2015. Guide to Road Design Part 4b: Roundabouts. Report AGRD04B/15. AUSTROADS, Sydney.
Bahar, G., 2010. Methodology for the Development and Inclusion of Crash Modification Factors in the First Edition of the Highway Safety Manual. Transportation Research Board, Washington DC.
Bissonette, J.A., Cramer, P.C., 2008. Evaluation of the Use and Effectiveness of Wildlife Crossings. Transportation Research Board, Washington DC.
Cafiso, S., Di Graziano, A., Di Silvestro, G., et al., 2010. Development of comprehensive accident models for two-lane rural highways using exposure, geometry, consistency and context variables. Accident Analysis&Prevention 42 (4), 1072e1079.
Chin, H.C., Quddus, M.A., 2003. Applying the random effect negative binomial model to examine traffic accident occurrence at signalized intersections. Accident Analysis & Prevention 35 (2), 253e259.
Daniels, S., Brijs, T., Nuyts, E., et al., 2011. Extended prediction models for crashes at roundabouts. Safety Science 49 (2), 198e207.
De Brabander, B., Vereeck, L., 2007. Safety effects of roundabouts in Flanders: signal type, speed limits and vulnerable road users. Accident Analysis&Prevention 39 (3), 591e599.
Elvik, R., 2011. Developing an accident modification function for speed enforcement. Safety Science 49 (6), 920e925.
Farag, S.G., Hashim, I.H., 2017. Safety performance appraisal at roundabouts: case study of Salalah City in Oman. Journal of Transportation Safety and Security 9 (1), 67e82.
Golob, T.F., Recker, W.W., Alvarez, V.M., 2004. Safety aspects of freeway weaving sections. Transportation Research Part A: Policy and Practice 38 (1), 35e51.
Gross, F., Persaud, B., Lyon, C., 2010. A Guide to Developing Quality Crash Modification Factors. U.S. Department of Transportation, Washington DC.
Gross, F., Donnell, E.T., 2011. Caseecontrol and cross-sectional
methods for estimating crash modification factors:
comparisons from roadway lighting and lane and shoulder width safety effect studies. Journal of Safety Research 42 (2), 117e129.
Hadi, M.A., Aruldhas, J., Chow, L.F., et al., 1995. Estimating safety effects of cross-section design for various highway types using negative binomial regression. Transportation Research Record 1500, 169e177.
Hanley, K., Gibby, A., Ferrara, T., 2000. Analysis of
accident-reduction factors on California State highways.
Transportation Research Record 1717, 37e45.
Harkey, D.L., Council, F., Srinivasan, R., et al., 2008. Accident Modification Factors for Traffic Engineering and ITS Improvements. NCHRP Report 617. Transportation Research Board, Washington DC.
Hauer, E., 1997. Observational Before-After Studies in Road Safety. Pergamon Press, Oxford.
Hauer, E., 2013. Even perfect regressions may not tell the effect of interventions. In: Transportation Research Board 92nd Annual Meeting, Washington DC, 2013.
IBM Corp, 2015. IBM SPSS Statistics for Windows. Version 23. IBM Corp, Armonk.
Kamla, J., Parry, T., Dawson, A., 2016. Roundabout accident prediction model: random-parameter negative binomial approach. Transportation Research Record 2585, 11e19.
Kim, S., Choi, J., 2013. Safety analysis of roundabout designs based on geometric and speed characteristics. KSCE Journal of Civil Engineering 17 (6), 1446e1454.
Lee, C., Abdel-Aty, M., Park, J., et al., 2015. Development of crash modification factors for changing lane width on roadway segments using generalized nonlinear models. Accident Analysis&Prevention 76, 83e91.
Li, X., Lord, D., Zhang, Y., 2010. Development of accident modification factors for rural frontage road segments in Texas using generalized additive models. Journal of Transportation Engineering 137 (1), 74e83.
Lord, D., Bonneson, J., 2007. Development of accident
modification factors for rural frontage road segments in Texas. Transportation Research Record 2023, 20e27.
Lord, D., Mannering, F., 2010. The statistical analysis of crash-frequency data: a review and assessment of methodological alternatives. Transportation Research Part A: Policy and Practice 44 (5), 291e305.
Montella, A., Turner, S., Chiaradonna, S., et al., 2012. Proposals for improvement of the Italian roundabout geometric design standard. Procedia-Social and Behavioral Sciences 53, 189e202.
Park, J., Abdel-Aty, M., Lee, J., et al., 2015. Developing crash modification functions to assess safety effects of adding bike lanes for urban arterials with different roadway and socio-economic characteristics. Accident Analysis&Prevention 74, 179e191.
Persaud, B., Lyon, C., 2007. Empirical Bayes beforeeafter safety studies: lessons learned from two decades of experience and future directions. Accident Analysis & Prevention 39 (3), 546e555.
Persaud, B., Lan, B., Lyon, C., et al., 2010. Comparison of empirical Bayes and full Bayes approaches for beforeeafter road safety evaluations. Accident Analysis&Prevention 42 (1), 38e43.
Polders, E., Daniels, S., Casters, W., et al., 2015. Identifying crash patterns on roundabouts. Traffic Injury Prevention 16 (2), 202e207.
Sacchi, E., Sayed, T., El-Basyouny, K., 2014. Collision modification functions: incorporating changes over time. Accident Analysis &Prevention 70, 46e54.
Shadpour, E., 2012. Safety Effects of Roundabouts. Laurier Centre for Economic Research and Policy Analysis, Wilfrid Laurier University, Waterloo.
Shahdah, U., Saccomanno, F., Persaud, B., 2014. Integrated traffic conflict model for estimating crash modification factors. Accident Analysis&Prevention 71, 228e235.
Turner, S., Roozenburg, A.P., Smith, A., 2009. Roundabout Crash Prediction Models. NZ Transport Agency Research Report 386. NZ Transport Agency, Wellington.
Washington, S.P., Persaud, B.N., Lyon, C., et al., 2005. Validation of Accident Models for Intersections. FHWA-RD-03-037. U.S. Department of Transportation, Washington DC.
Wood, J.S., Donnell, E.T., Porter, R.J., 2015. Comparison of safety effect estimates obtained from empirical Bayes beforeeafter study, propensity scores-potential outcomes framework, and regression model with cross-sectional data. Accident Analysis&Prevention 75, 144e154.
Wu, L., Lord, D., 2016. Investigating the influence of dependence between variables on crash modification factors developed using regression models. In: Transportation Research Board 95th Annual Meeting, Washington DC, 2016.
Young, J., Park, P.Y., 2013. Benefits of small municipalities using jurisdiction-specific safety performance functions rather than the highway safety manual's calibrated or uncalibrated safety performance functions. Canadian Journal of Civil Engineering 40 (6), 517e527.
Mohammad Nour Al-Marafi obtained his
master's degree in transportation
engineer-ing from the University of Jordan, Amman,
Jordan in 2014 and his bachelor's degree in
civil engineering from Tafila Technical Uni-versity, Jordan in 2011. Mohammad is currently studying a doctorate degree in transport engineering at the Faculty of Health, Engineering and Sciences, University of Southern Queensland, Australia. Prior to migrating to Australia in 2016, he worked as a lecturer at Tafila Technical University, Jordan for two years.
Dr. Kathirgamalingam Somasundar-aswaranobtained his PhD degree from the Yokohama National University, Japan, mas-ter degree from the Asian Institute of Tech-nology, Bangkok, Thailand, and bachelor degree from the University of Peradeniya, Sri Lanka. He is a chartered professional engi-neer in Australia. Soma is currently working as senior lecturer in transport engineering at
the School of Civil Engineering and
Surveying, University of Southern Queens-land, Australia, and teaching a range of road and transportation engineering courses. His research interests include road safety, traffic studies and pavement rehabilitation.
Prof. Ron Ayersobtained his master of en-gineering, bachelor of engineering and bachelor of science degrees from the Uni-versity of New South Wales, Australia. Ron retired from full time involvement in the School of Civil Engineering and Surveying,
University of Southern Queensland,
Australia, in 2013, after 37 years of teaching and research in transportation, construction and management, and serving various pe-riods as Head of Civil Engineering, and dean of the Faculty of Health, Engineering and Sciences. His current research interests include pavement management and materials, road safety and transport planning,