W
WO
O
R
R
K
K
I
I
N
N
G
G
PA
P
A
P
P
E
E
R
R
N
N
O
O
.
.
2
2
0
0
7
7
The Impact of Banking Development on the
Size of the Shadow Economy
Niloy Bose, Salvatore Capasso and Martin Wurm
October 2008
University of Naples Federico II University of Salerno Bocconi University, Milan
CSEF - Centre for Studies in Economics and Finance–UNIVERSITY OF SALERNO 84084 FISCIANO (SA) - ITALY
W
W
OR
O
RK
KI
IN
NG
G
P
P
AP
A
PE
ER
R
N
NO
O
.
.
2
2
07
0
7
The Impact of Banking Development on the Size of
the Shadow Economy
Niloy Bose
, Salvatore Capasso
and Martin Wurm
Abstract
This paper employs data on 119 countries for the period 1999/2000 to 2004/2005 to examine the impact of banking development on the size of shadow economies. The main results indicate that an improvement in the development of the banking sector is associated with a smaller shadow economy in a wide cross-section of countries. In addition, both depth and efficiency of the banking sector matter equally in reducing the size of a shadow economy. These stylized results are robust under a variety of specifications and controls for simultaneity bias.
JEL classification: H, G
Keywords: Shadow Economy, Banking Development.
Department of Economics, University of Wisconsin, Milwaukee. Corresponding author: Dr. Niloy Bose, Department of Economics, University of Wisconsin, Milwaukee, Bolton Hall, P.O. Box: 413, Milwaukee, WI 53201, USA, Tel: +1 414 229 6132; Fax: +1 414 229 3860; Email: nbose@uwm.edu
Table of contents
1. Introduction
2. Data
2.1. The Size of the Shadow Economy
2.2. Measures of Financial Market Development 2.3. Other Control Variables
3. Results 3.1. Basic OLS 3.2. Sensitivity Analyses 3.3. Endogeneity 4. Conclusions References Appendix
1
Introduction
The existence of a shadow economy has potentially serious implications for economic perfor-mance and public revenues. Public finances can suffer as the tax base shrinks, thus weakening the government’s capacity to generate revenue. Growth prospects can be compromised by encumbrances to doing business due to lack of infrastructure. For these reasons a substantial volume of research has been directed towards understanding the factors that contribute to the size of a shadow economy.
By its very nature, the underground economy is difficult to study empirically. Nevertheless, there has been a good deal of progress on developing techniques to quantify its size and importance. Whilst disagreement persists regarding the appropriate methodology1, the general conclusion is that the
extent of informal activity is substantial across countries. According to Schneider (2007), between 1999 and 2005, underground activities did account for nearly 16 % of GDP in the OECD nations. The equivalent numbers are far larger (about 35 %) in the emerging and developing countries. A similar conclusion has been reached by Lack´o (1998), Alm, Mart´ınez-V´azquez and Schneider (2004) and Kazemier (2005)).
For most part, the existing literature focuses on various aspects of public policy and public ad-ministration as creating incentives to participate in underground activities. Included among these are burden, complexity, perceived fairness of tax systems, the burden of social security contributions, the extent of bureaucracy and regulations, and the incidence of corruption and rent seeking (e.g. Schneider (1994), Loayza (1996) Johnson et al. (1998a, 1998b), Friedman et al. (2000), Schneider (2007))2. Without undermining the importance of any of these factors we focus on another
deter-minant – the level of financial development – that has received relatively much less attention both in empirics and in theory.
Our focus on financial development is anchored in a simple economic argument. For example, consider an individual who, for purposes of production or consumption, seeks a certain amount of credit from a market that is plagued with informational frictions between borrowers and lenders. Before applying for a loan, an agent must decide how much of her current income to declare publicly. While this declared income is subjected to taxation, it can either be used as collateral or it can serve as a signal to lenders about the creditworthiness of a prospective borrower. Accordingly, the amount of declared income along with other characteristics of the credit market would jointly determine the probability of obtaining credit together with its terms and conditions. Naturally, one would expect
1For a discussion of the various available estimation methods see Schneider and Enste (2002)
that in a low state of financial development that is characterized by scarcity of loanable funds, lack of competition among financial intermediaries, high level of financial repression and limited ability of lenders to collect and process information, an increase in the size of one’s publicly declared income is likely to have a smaller impact on the terms and conditions of lending than what would transpire in an advanced state of credit market development. Consequently, an individual would be less prone to declare her income and/or wealth in a low state of financial development, thus giving rise to a larger shadow economy.
The above idea complements a small body of research that suggests possible connections between the credit market and the size of a shadow economy. For example, Dabla-Norris and Feltenstein (2005) construct a computable dynamic general equilibrium model for the purpose of estimating the impact of taxes on underground activities and other macroeconomic phenomena in Pakistan. Their numerical results suggest that an increase in taxes may not only cause firms to operate underground, but, in doing so, may also lead to a reduction in the amount of collateral in the formal sector, and with this a reduction in the volume of loans and subsequent investment in that sector. Straub (2005) proposes a theoretical analysis where an agent’s decision to participate in a formal versus informal credit market is shaped by the interaction between the cost of entry into formality and the relative efficiency of formal versus informal credit mechanism. In a similar vein, Antunes and Cavalcanti (2007) argue that an agent’s occupational choice – being either a worker, a formal or an informal entrepreneur – is influenced by entry barriers (regulation costs) and credit market imperfections.
Simple economic intuition together with the views expressed by above researchers provides us with sufficient reason to undertake a formal empirical investigation into the relationship between the level of credit market development and the size of a shadow economy. Our analysis is based on data for 119 countries from 1999/2000 to 2004/2005. We naturally control for those variables that have already been identified in the literature as determinants of an underground economy. In addition, we pay attention to the “sensitivity” issue arising from initial conditions and conditioning variables while also recognizing and correcting potential endogeneity bias in our financial development indicators. The main results of our analysis suggest that:
(1) An improvement in the development of the banking sector is associated with a smaller shadow economy in a wide cross-section of countries. This result is robust to a variety of specifications and is neither driven by multi-colinearity nor endogeneity of the financial variables.
(2) At a disaggregated level, both the depth of the banking sector and its efficiency matter equally in reducing the size of a shadow economy.
The remainder of this paper is organized as follows. Section 2 briefly describes the data. In Section 3 we report the baseline regression results together with the results from the sensitivity and endogeneity tests. Section 4 concludes with some remarks.
2
Data
2.1
The Size of the Shadow Economy
It is difficult to measure the size of a shadow economy by its concealed nature. To obtain an estimate, researchers have used various approaches and each approach has its own strengths and weaknesses (please refer to Schneider and Enste (2000) for a detailed overview). Out of several available options, we draw our information on the size of shadow economies for 119 countries for the period 1999/2000 to 2004/2005 from the most comprehensive estimates proposed by Schneider (2007). His original study provides estimates for 145 countries. However, we are unable to consider the full list due to limited information on other control variables. In the data appendix, we include the list of countries and a brief description of the methodology employed to estimate the size of a shadow economy.
2.2
Measures of Financial Market Development
Our main hypothesis suggests that availability of credit together with the terms and conditions of lending are important determinants of the size of a shadow economy. Thus, it seems appropriate to focus on indicators of banking development. Existing literature suggests a number of variables that capture depth and inefficiencies of a banking system. We focus on seven such variables that are commonly used and extract information on these variables from two data sources – the financial database compiled by Beck, Demirg¨u¸c-Kunt and Levine (2000, 2006, henceforth, BDL) and the World Bank World Development Indicators (WDI). Next, we follow the methodology proposed by Calomiris and Beim (2001) and use these variables to construct two indices which correspond to a measure of banking depth and a measure of banking inefficiency3. In particular, we construct
the index of banking depth on the basis of annual averages of three variables - credit provided to the private sector, total domestic credit provided by the banking sector and liquid liabilities (M3), all as percentage of GDP. Each of these variables is used to measure the volume of lending by the
banking sector (see e.g. Levine and Zervos (1998)). Whereas, we construct the index of inefficiencies present in the banking sector on the basis of annual averages of four variables - bank overhead costs, the net interest margin, the lending-deposit rate spread, and the value of central bank assets as percentage of both central and private bank assets (see e.g. Barth, Caprio and Levine (2002)). In practice, the terms and conditions of lending are influenced by a number of factors such as the level of financial repression, the extent of informational friction in the credit market, the quality of banking regulations etc. The overall effect of these factors usually is visible in the value of these four variables. Finally, to capture the overall quality of a banking system, we create a composite index of banking development by averaging the scores of the above two indices. We include all three indices in our analysis to evaluate the impact of banking development both at an aggregated and at a disaggregated level.
2.3
Other Control Variables
A firm or an individual going underground is able to avoid taxation, labor costs and other regulatory burdens that are present in the official sector. At the same time, a decision to go underground comes at a cost of being excluded from various public services. Also, there exists a chance of being detected by the authority, and, hence facing punishment for going underground. Accordingly, policy, institutional, and regulatory variables such as the burden, fairness, and the complexity of tax system, the extent of bureaucracy and regulation, the effectiveness of the rule of law, and the burden of social security contribution (e.g. Schneider (1994), Loayza (1996) Johnson et al. (1998a, 1998b), Friedman et al. (2000), Schneider (2007)) have received much attention in the literature as potential determinants of underground activities. Naturally, we control for these variables. We do so by including the Heritage Foundation Regulatory Freedom Index, the Heritage Foundation Fiscal Freedom Index, the World Bank Regulatory Quality Index, the World Bank Rule of Law Index, and the Transparency International Corruption Perception Index as control variables. In addition, we use a number of other factors such as the level of economic development, degrees of openness, and other proxies of financial development to check robustness of our results. The detail descriptions and sources of these variables are included in the data appendix.
3
Results
3.1
Basic OLS
We begin by regressing the average size of shadow economies for the period 1999/2000 -2004/2005 against the averages of the overall measure of banking development for a cross-section of 119 countries. As additional controls, we include average scores of the Regulatory Freedom Index, the Fiscal Freedom Index, the Regulatory Quality Index, the Rule of Law Index, and the Corruption Index. At this stage we do not attempt to control for endogeneity and estimate our empirical model using ordinary least squares. As summarized in the first column of Table 1, our findings suggest that banking development has a significant impact in reducing the size of shadow economies. For instance, a one-point increase in the index of banking development causes the size of shadow econ-omy as fraction of GDP to decrease by roughly 0.35 percentage points. For a clearer picture, we further disaggregate the overall measure of banking development and include the index of banking depth and the index of banking inefficiencies separately in the regression. The results (column 2 of Table 1) indicate that both indicators of banking development have a significant impact on the size of shadow economy. A one-point increase in banking depth leads to a 0.115 percentage point decrease in the size of the unofficial sector. Similarly, a one-point increase in banking inefficiencies results in a 0.251 percentage point increase in the size of the shadow economy.
As noted earlier, we constructed indices of banking development on the basis of seven commonly used financial indicators. While these composite indices conveniently convey an overall picture, they say little about the relative importance of these seven indicators in reducing the size of a shadow economy. In addition, one cannot exclude the possibility that there could exist other financial indicators with significant explanatory power. Accordingly, we repeat the baseline regression by including a wider list of banking sector indicators, one at a time, in place of our composite index of banking development. Instead of reporting all the results, we only report the relevant coefficients in Table 2. The results indicate that the coefficients of all three measures of banking depth assume the correct sign and are significant at one percent level. Three out of four variables that we used to construct the index of inefficiencies in the banking industry - public bank assets, the interest rate spread and the net interest margin - appear significant at a minimum of five percent level with expected signs. In comparison, the remaining variables have insignificant impact on the size of a shadow economy.
power for the size of shadow economy. We do not interpret this result to say that other control variables are of little significance. We suspect that the source of this result lies in the fact that institutional variables such as regulatory quality and the rule of law are correlated to each other. When we include each measure separately4, all of them appear significantly and with correct signs
as identified in the existing literature. Only when all of them are included simultaneously, the rule of law remains significant alone. Such a result is not uncommon in the literature (see e.g. Johnson et al. (1998a) or Friedman, et al. (2000)).
Finally, we find that the size of the shadow economy is positively correlated with the fiscal freedom index. While this result may appear counter-intuitive at the surface, it need not be the case. The existing literature (e.g. Friedman, et al. 2000) suggests that it is the low quality of governance which creates incentives for individuals to go underground thus causing a reduction in the tax revenue. Since the Heritage Foundation Fiscal Freedom Index is at least partly based on the tax revenue, we are not surprised to observe a positive correlation between the value of this index and the size of shadow economies. We, however, recognize that this result does not provide a sufficient basis for drawing any definite conclusion about the relation between the tax burden and the size of the shadow economy. For that, one would require a more detailed picture of the fiscal system that includes not only the information about the tax rates, but also the information about various options for legal tax avoidances5. Here, we refrain from undertaking such a detail exercise and simply use the Fiscal Freedom Index as a broad control for the fiscal measures in the pursuit of capturing the effects of banking development on the size of shadow economies.
[TABLE 1. HERE] [TABLE 2. HERE]
3.2
Sensitivity Analyses
To check the robustness of our findings we conduct a number of sensitivity tests. To begin with, we recognize that our measures of banking development could be highly correlated giving rise to a potential multi-collinearity bias in our estimates. In fact, Table 3 suggests that the correlations between the banking indicators are of substantial magnitude. Therefore this issue requires further attention. As a remedy we turn to a well-established technique – the Principal Component Analysis
4These results are not reported.
(Hotelling (1933), Pearson (1901)). The primary objective of this exercise is to reduce the dimen-sionality of a set of highly correlated variables, such as our banking measures, by expressing their common variation through so-called principal components. These principal components are orthog-onal to each other so that each of them measures a particular aspect of banking quality. Based on the Kaiser-criterion (Kaiser (1960)) and the screeplot we focus on the first two principal components of our seven variables, which together account for nearly 77% of the total variation in the data. In Table 4 we report the factor scores of our banking indicators. The unrotated scores capture the correlation of each of our variables with both principal components. To identify which aspects of banking development each component is associated with, these correlations are typically rotated in such a way that the variance along each new axis is maximized, while the relative position of the data points is kept unchanged. In both cases, we mark the factor scores that are larger than 0.4 with an asterisk.
[TABLE 3. HERE] [TABLE 4. HERE]
The rotated factor scores depict a clear picture: The first principal component is associated with domestic credit to the private sector, domestic credit provided by banks and liquid liabilities as percentage of GDP, all of which we used to construct our original measure of banking depth. By contrast, the second principal component is associated with the share of private enterprise in bank lending, the net interest margin on banks, bank overhead cost and the interest rate spread. Again, it is the same set of variables that we originally used to construct our index of inefficiency of the banking industry.
Next, we use these two principal components as alternative measures of banking sector depth and inefficiency and include them in our baseline specification. As indicated in column 1 of Table 5, the coefficients of both these two measures are not only significant, but the manner in which these alternative measures affect the size of a shadow economy is qualitatively no different from our corresponding original indices.
A casual inspection reveals that, on the average, developed countries have smaller shadow economies and better developed credit markets6. Thus there lingers a possibility of bias from an-other source in our results. To verify this, we include information on the average log real GDP
6The correlation between log average GDP and our banking development measure is 0.7456. The correlations
between the average size of the shadow economy and log average GDP as well as banking development are -0.6530 and -0.7404, respectively.
per capita from 2000 to 2004 in our base line regression (column 2 of Table 5) and find a marginal decrease in the coefficient of the index of banking development, but find no qualitative change from our previous results.
Some researchers (e.g. Goldberg and Pavcnik 2003; Karlinger 2006) have argued that there could exist a strong cross-country correlation between the ‘degrees of openness’ and the size of underground economies. This is primarily due to the fact that an increase in competition as a consequence of reduced trade barriers and various market liberalization programs creates an environment where firms are likely to engage in underground activities to cut down on the cost of their operations. To control for such potential effect, we include ‘openness to trade’ and a de-facto measure of financial integration in our base regression. We obtain information on these two variables from Heston, Summer and Aten (2006) and from Lane and Milesi - Ferretti (2006), respectively. As before, our results remain robust to changes in the set of control variables (please refer to Column 3 and 4 of Table 5).
It has been widely recognized among development experts that financial development is a multi-faceted process that takes place through various distinct stages – from the emergence and expansion of bank-intermediated debt finance to the materialization of stock markets and the increasing use of equity as an additional instrument by which firms are able to raise funds (e.g., Gurley and Shaw, 1955, 1960; Goldsmith, 1969). In recent years, a substantial volume of empirical research that has been directed towards understanding this process suggests that the level of banking development is strongly correlated with the materialization and the level of maturity of stock markets. Accordingly, one could treat the measure of stock market development as a proxy for the state of the banking system. Taking this view, we include three stock market activity indicator - stock market value traded, stock market capitalization and stock market turnover as percentage of GDP – separately in our regression (please refer to columns 5 through 7 of Table 5). Qualitatively, these regressions confirm our previous result, with all three measures of stock market development being significant at the 1% level. Quantitatively, a one percentage point increase in stock market capitalization, the stock market value traded or stock market turnover, leads to a 0.051, 0.057 and 0.023 percentage point decrease in the size of the shadow economy, respectively.
3.3
Endogeneity
It is often the case that the factors which appear to influence the size of underground economies are also influenced by the level of hidden activities. Indeed, such a possibility exists in our case. For example, in many countries where the public sector plays a dominant role in banking, the lack of public revenue resulting from a large shadow economy is likely to generate adverse effect on the scale and the efficiency of the banking sector. In other cases, being faced with a large shadow economy, the public sector may choose to impose taxes, fees and other costs on the banking sector as an additional source of revenue. Thus, at least in theory the size of the shadow economy could influence the volume and the efficiency of the banking sector. To address this concern, we follow the footsteps of La-Porta et al. (1998) and Easterly and Levine (2001, 2008) and use dummies for legal origins and a landlocked dummy as instruments for banking development. As an additional instrument, we use a measure of ethnic fractionalization as obtained from Alesina, et al. (2003). In Table 6 we report the coefficients of interest from the first and second stage regressions7.
[TABLE 6. HERE]
The first stage results indicate that the chosen instruments explain the variation in banking development quite well. Most individual coefficient estimates, with the exception of some legal origins, are significant at the 1% level and a large value of the F-statistic of 57.78 indicates their joint significance8. Further, we are unable to reject the null of over-identification with a p-value of
0.6245 for the Hansen - J test. These results validate the choice of our instruments.
The second stage regression replicates our baseline OLS results with a highly significant coefficient estimate of -0.334 on banking development. We interpret this result as strong enough evidence that our earlier results were not driven by an endogeneity problem.
7La-Porta, et al. create dummies according to the origin of countries legal codices for each British, French, German
and Scandinavian origin. Easterly extends this data and further creates a dummy indicating whether a country is landlocked (i.e. has access to ocean waters). Alesina et al. create a Herfindahl-type index measuring how strongly a country’s populace is fractionalized into different ethnicities.
8In order for variables to be valid instruments they need to explain a sufficient amount of the variation of the
potentially endogenous regressor. A simple test for whether this is actually the case suggests that the F-Statistic of the first-stage regression exceed ten to rule out such weak instrument issues (for a detailed discussion see e.g. Stock and Yogo (2002)).
4
Conclusion
The effect of underground economies on economic and social development can be significant and far-reaching. High level of underground economic activities could undermine purposeful regulations and deteriorate public finances to the detriment of public policy. For this reason it is important to understand factors that are responsible for the size of a shadow economy.
In general, the size of a shadow economy is a reflection of individuals’ incentives to conceal their activities. Existing literature has identified a number of factors (e.g., the burden of taxation or regulation, the quality of government, legal enforcement, corruption etc.) that create such incentives. Our central concern in this paper has been to study how the temptation to engage in underground activities might be affected by conditions in the banking sector from which individuals acquire loans. When individuals are required to disclose information about their wealth and income for acquiring loans, the cost of going underground could transpire in the form of either reduced ability to borrow and/or higher costs of borrowing. Such a cost is likely to be lower in countries where the availability and terms of credit are inherently poor as a result of a poorly developed banking system. Accordingly, one would expect the state of banking to have influence on the size of a shadow economy. After controlling for the usual factors, we indeed find that improvements in the quality of banking sectors reduce the size of underground activities. Furthermore, improvements both in depth and efficiency of the banking industry play an equally important role.
While the primary objective of this paper has been to contribute to a better understanding of the causes of underground activities, we believe that our results are also relevant in the context of understanding a broader relationship between financial and real sectors. Over the years a substantial volume of research has been directed towards identifying the channels through which banking sector development shapes the prospect of economic growth. In this pursuit, researchers have more or less come to a consensus that banking development positively affects the volume and the productivity of investment by creating opportunities for a greater pooling of risks, higher quality of information, lower monitoring costs, lower transaction costs etc. The evidence presented in this paper indicates another channel through which the banking sector development could influence economic growth, namely through its impact on the size of the shadow economy.
References
Alesina, Alberto / Easterly, William / Devleeschauwer, Arnaud / Kurlat, Sergio / Wacziarg, Roman, ”Fractionalization”, ”Journal of Economic Growth”, Vol. 8, 2003, pp. 155 – 194
Alm, James / Mart´ınez-V´azquez, Jorge / Schneider, Friedrich, ”Sizing the Problem of the Hard-to-Tax”, Georgia State University Working Paper 2004
Antunes, Ant´onio / Cavalcanti, Tiago, ”Start-Up Costs, Limited Enforcement and the Hidden Econ-omy”, ”European Economic Review”, Vol. 51, 2007, pp. 203 - 224
Barth, James / Caprio, Gerard / Levine, Ross, “Bank Regulation and Supervision: What Works the Best?”, “Journal of Financial Intermediation”, Vol. 13, 2004, pp. 205 - 248
Beck, Thorsten / Demirg¨u¸c-Kunt, Asli / Levine, Ross, ”A New Database on Financial Development and Structure”, ”World Bank Economic Review”, Vol. 14, 2000, pp. 597 - 605, update available until 2006
Calomiris, Charles / Beim, David, ”Emerging Financial Markets”, Boston, 2001
Dabla-Norris, Era / Feltenstein, Andrew, ”The Underground Economy and its Consequences”, ”Journal of Economic Policy Reform”, Vol. 8, 2005, pp. 153 - 174
Dell’Anno, Roberto, “Estimating the Size of the Shadow Economy in Italy: A Structural Equations Approach”, University of Salerno Working Paper 2003 – 7, 2003
Dell’Anno, Roberto / Schneider, Friedrich, ”Estimating the Underground Economy by using MIMIC models: A Response to T.Breusch’s Critique”, University of Linz Working Paper 0607, 2006 Easterly, William / Levine, Ross, ”It’s Not Factor Accumulation: Stylized Facts and Growth Mod-els”, ”World Bank Economic Review”, Vol. 15, 2001, pp. 177 - 219. Updates available through 2008: http://www.nyu.edu/fas/institute/dri/global%20development%20network%20growth%20database.htm, accessed 03/01/2008
Friedman, Eric / Johnson, Simon / Kaufmann, Daniel / Zoido-Lobat´on, Pablo, ”Dodging the Grab-bing Hand: The Determinants of Unofficial Activity in 69 Countries”, ”Journal of Public Economics”, Vo. 76, 2000, pp. 459 - 493
Goldberg, Pinelopi / Pavcnik, Nina, “The Response of the Informal Sector to Trade Liberalization”, “NBER Working Paper w9443”, 2003
Goldsmith, Raymond, “Financial Structure and Development”, New Haven, 1969
Gurely, John / Shaw, Edward, “Financial Aspects of Economic Development”, “American Economic Review”, Vol. 45, 1955, pp. 515 – 538
Gurley, John / Shaw, Edward, “Money in a Theory of Finance”, Washington, 1960
Heston, Alan / Summers, Robert / Aten, Bettina, ”Penn World Table Version 6.2”, Center for International Comparisons of Production, Income and Prices at the University of Pennsylvania, 2006
Hotelling, Harold, “Analysis of a Complex of Statistical Variables with Principal Components”, “Journal of Educational Psychology”, Vol. 24, 1933, pp. 417 - 441
Johnson, Simon / Kaufmann, Daniel / Zoido-Lobat´on, Pablo, ”Regulatory Discretion and the Un-official Economy”, ”The American Economic Review”, Vol. 88, 1998a, pp. 387 - 392
Johnson, Simon / Kaufmann, Daniel / Zoido-Lobat´on, Pablo, ”Corruption, Public Finances and the Unofficial Economy”, The World Bank, Discussion Paper, 1998b
Kaiser, Henry, “The Application of Electronic Computers to Factor Analysis”, “Educational and Psychological Measurement”, Vol. 20, 1960, pp. 141 - 151
Karlinger, Liliane, ”The Underground Economy in the Late 1990s: Evading Taxes, or Evading Competition?”, University of Vienna, Working Paper 2006
Kazemier, Brugt, ”The Underground Economy: A Survey of Methods and Estimates”, Discussion Paper 2005
Kaufmann, Daniel / Kraay, Aart / Mastruzzi, Massimo, ”Governance Matters VI: Aggregate and Individual Governance Indicators 1996 - 2006”, ”World Bank Policy Research Paper 4280”, 2007 Lack´o, M´aria “The Hidden Economies of Visegrad Countries in International Comparison: A House-hold Electricity Approach”, In: Halpern, Lazlo and Wyplosz, Charles (eds.), “Hungary: Towards a Market Economy”, Cambridge (Mass.), 1998, pp.128-152.
La Porta, Rafael / Lopez-de-Silanes, Florencio / Shleifer, Andrei / Vishny, Robert, ”Law and Finance”, ”Journal of Political Economy”, Vol. 106, 1998, pp. 1113 - 1155
Lane, Philip / Milesi-Ferreti, Gian Maria, ”The External Wealth of Nations Mark II: Extended and Revised Estimates of Foreign Assets and Liabilities, 1970 - 2004”, ”IMF Working Paper 06/69” 2006 Levine, Ross / Zervos, Sara, “Stock Markets, Banks and Economic Growth”, “American Economic Review”, Vol. 88, 1998, pp. 537 - 558
Loayza, Norman, ”The Economics of the Informal Sector: A Simple Model and Some Empirical Evidence from Latin America”, ”Carnegie-Rochester Conference Series on Public Policy”, Vol. 54, 1996, pp. 129 - 162
Pearson, Karl, “On Lines and Planes of Closest Fit to Systems in Space”, “Philosophical Magazine”, Vol. 2, 1901, pp. 559 - 572
Schneider, Friedrich, “Can the Shadow Economy be Reduced Through Major Tax Reform? An Empirical Investigation for Austria”, “Supplement to Public Finance / Finances Publiques”, Vol. 49, 1994, pp. 137 - 152
Schneider, Friedrich, “Shadow Economies and Corruption All Over the World: New Estimates for 145 Countries”, ”Economics: The Open-Access, Open-Assessment E-Journal”, Vol. 1, 2007
Schneider, Friedrich / Enste, Dominik, ”Shadow Economies: Size, Causes and Consequences”, ”The Journal of Economic Literature”, Vol. 38., 2000, pp. 77-114
Schneider, Friedrich / Enste, Dominik, ”The Shadow Economy: Theoretical Approaches, Empirical Studies, and Political Implications”, Cambridge (UK), 2002
Stock, James / Yogo, Motohiro, ”Testing for Weak Instruments in Linear IV-Regression”, ”NBER Technical Working Paper 0284, 2002
Straub, St´ephane, ”Informal Sector: The Credit Market Channel”, ”Journal of Development Eco-nomics”, Vol. 78, 2005, pp. 299 - 321
Data Appendix
List of Countries
Albania, Algeria, Angola, Argentina, Armenia, Australia, Austria, Azerbaijan, Bangladesh, Belarus, Belgium, Benin, Bosnia and Herzegovina, Botswana, Brazil, Bulgaria, Burkina Faso, Cameroon, Canada, Chad, Chile, China, Colombia, Congo, Democratic Republic, Congo, Republic, Costa Rica, Cote d’Ivoire, Croatia, Czech Republic, Denmark, Dominican Republic, Ecuador, Egypt, El Sal-vador, Estonia, Ethiopia, Finland, France, Georgia, Germany, Ghana, Greece, Guatemala, Haiti, Honduras, Hong Kong, Hungary, India, Indonesia, Iran, Ireland, Israel, Italy, Jamaica, Japan, Jordan, Kazakhstan, Kenya, Kuwait, Kyrgyz Republic, Latvia, Lebanon, Lithuania, Macedonia, Madagascar, Malawi, Malaysia, Mali, Mexico, Moldova, Mongolia, Morocco, Mozambique, Namibia, Nepal, Netherlands, New Zealand, Nicaragua, Niger, Nigeria, Norway, Oman, Pakistan, Papua New Guinea, Paraguay, Peru, Philippines, Poland, Portugal, Romania, Russian Federation, Saudi Arabia, Senegal, Serbia and Montenegro, Sierra Leone, Singapore, Slovak Republic, Slovenia, South Africa, Spain, Sri Lanka, Sweden, Switzerland, Syrian Arab Republic, Tanzania, Tunisia, Turkey, Uganda, Ukraine, United Arab Emirates, United Kingdom, United States, Uruguay, Uzbekistan, Venezuela, Vietnam, Yemen, Republic, Zambia, Zimbabwe
Data Sources and Description
Shadow Economy: Average size of the shadow economy as percentage of GDP for the period 1999/2000 - 2004/2005. The size of the shadow economy is estimated using a dynamic multiple inputs multiple causes (DYMIMIC) approach. Source: Schneider (2007).
Heritage Foundation Regulatory Freedom: Average of scores for the period 2000 - 2004. This index ranges from 0 to 100 with higher values indicating more freedom. This index is based on the number of procedures, time, cost and minimum capital required to start a business or obtain a license and the time and cost to close a business together with the corresponding recovery rate. Source: Heritage Foundation Freedom in the World Index.
Heritage Foundation Fiscal Freedom: Average of scores for the period 2000 - 2004. This index ranges from 0 to 100 with higher values indicating more freedom. The taxation index is based on highest marginal tax rates on individuals and on corporations as well as tax revenue. Source: Heritage Foundation Freedom in the World Index.
World Bank Regulatory Quality: Average score for the period 2000 - 2004. These scores are based on a variety of surveys and typically lie between -2.5 and 2.5, with higher scores indicating better outcomes. This index assesses a government’s ability to promote and enforce sound policies and regulations based on a variety of indicators such as regulations of exports, imports and overall entrepreneurial activity, competition, price controls, anti-trust regulation, etc. Source: World Bank Governance Indicators (WGI).
Corruption: Average score for the period 2000 - 2004. This measure is a survey based index of corruption ranging from 0 to 10 capturing the overall presence of corruption in the political and public sector with higher values indicating a higher presence of corruption. Source: Transparency International Corruption Perception Index (CPI).
World Bank Rule of Law: Average score for the period 2000 - 2004. These scores are based on a variety of surveys and typically lie between -2.5 and 2.5, with higher scores indicating better outcomes. The index assesses the quality of both the judicial system and of law enforcement to cope
with a variety of illegal activity ranging from violent to white collar crimes. Source: World Bank Governance Indicators (WGI).
Domestic Credit to the Private Sector: Average overall amount of domestic credit provided to private borrowers as percentage of GDP for the period 2000 - 2004. Source: World Bank World Development Indicators (WDI).
Domestic Credit provided by the Banking Sector: Average overall amount of domestic credit provided by private depository institutions as percentage of GDP for the period 2000 - 2004. Source: World Bank World Development Indicators (WDI).
Liquid Liabilities (M3): Average amount of outstanding liquid liabilities of the banking system (M3) as percentage of GDP for the period 2000 - 2004. Source: World Bank World Development Indicators (WDI).
Public Bank Assets: Average value of assets owned by central banks as percentage of total bank (i.e. private and central bank) assets for the period 2000 - 2004. Source: Beck, Demirg¨u¸c-Kunt, Levine (2000, 2006).
Interest Rate Spread: Average difference between bank lending and deposit rates for the period 2000 - 2004. Source: World Bank World Development Indicators (WDI).
Net Interest Margin: Average value of banks’ interest revenue as percentage of the value of banks’ total assets for the period 2000 - 2004. Source: Beck, Demirg¨u¸c-Kunt, Levine (2000, 2006).
Bank Concentration: Average value of the three largest banks’ total assets as percentage of the value of total banking sector assets for the period 2000 - 2004. Source: Beck, Demirg¨u¸c-Kunt, Levine (2000, 2006).
Bank Overhead Cost: Average bank overhead cost as percentage of the value of banks’ total assets from 2000 - 2004. Source: Beck, Demirg¨u¸c-Kunt, Levine (2000, 2006).
Bank Liquid Reserves: Average value of bank liquid reserves as percentage of bank assets for the period 2000 - 2004. Source: World Bank World Development Indicators (WDI).
Bank Capital: Average value of bank reserves and capital as percentage of total bank assets for the period 2000 - 2004. Source: World Bank World Development Indicators (WDI).
Bank Non-Performing Loans: Average value of bank non-performing loans as a fraction of total loans for the period 2000 - 2004. Source: World Bank World Development Indicators (WDI).
Risk Premium on Lending: Average difference between bank lending rates and a ”risk-free”, short-run government interest rate for the period 2000 - 2004. Source: World Bank World Develop-ment Indicators (WDI).
Banking Development: Average score for the period 2000 - 2004. Source: Own calculations. This score is the average of financial depth and (100 - financial inefficiency) as described below. It ranges from 0 to 100 with higher values indicating higher development of the banking sector.
Banking Depth: Average score for the period 2000 - 2004. This score is based on annual averages of domestic credit provided to the banking sector, domestic credit provided by the banking sector and liquid liabilities (M3). Each of these measures (or depending on its empirical distribution its natural log) is normalized between 0 and 100 with a mean of 50 and a standard deviation of 20, higher values indicating better financial development. The exact transformation follows Calomiris and
Beim (2001) and is given by: y=α+βx, whereyis the normalized measure,α= 50−β∗mean(x),
β= σ20
x andxis each original indicator score or its corresponding natural log.
Banking Inefficiency: Average score for the period 2000 - 2004. This scores is based on annual averages of public bank assets, bank overhead costs, the net interest margin and the lending-deposit rate spread, where each of these measures or its natural log is normalized between 0 and 100 with a mean of 50 and a standard deviation of 20, higher values indicating larger financial inefficiencies.
Real GDP per Capita: Average real GDP per capita (Laspeyres) in 1996 international Dollars. Source: Heston, Summer, Aten (2006)
Openness to Trade: Average exports and imports as percentage of real GDP per capita in 1996 international Dollars from 2000 - 2004. Source: Heston, Summer, Aten (2006)
Financial Openness: Average sum of outstanding foreign assets and liabilities as percentage of GDP from 2000 - 2004. Source: Lane, Milesi-Feretti.(2006)
Stock Market Turnover: Average value of total shares traded as percentage of stock market capitalization from 2000 - 2004. Source: Beck, Demirg¨u¸c-Kunt, Levine (2000, 2006).
Stock Market Capitalization: Average value of total listed shares as percentage of GDP from 2000 - 2004. Source: Beck, Demirg¨u¸c-Kunt, Levine (2000, 2006).
Stock Market Value Traded: Average value of total shares traded at each country’s stock exchange as percentage of GDP from 2000 - 2004. Source: Beck, Demirg¨u¸c-Kunt, Levine (2000, 2006).
British, French, German, Scandinavian Legal Origin: Dummy variable indicating whether a country belongs to one of the three Civil Law groups. Sources: La Porta, Lopes-de-Silanes, Shleifer, Vishny (1998), updated in Easterly and Levine (2001, 2008)
Ethnic Fractionalization: Ethnic fractionalization for each country is measured as one minus the Herfindahl Index of ethnic group shares, indicating the probability that two randomly selected individuals belong to two separate groups. Source: Alesina, Devleeschauwer, Easterly, Kurlat, Wacziarg (2003)
Landlocked Dummy: Dummy indicating whether a country has access to an ocean. Source: Easterly and Levine (2001, 2008)
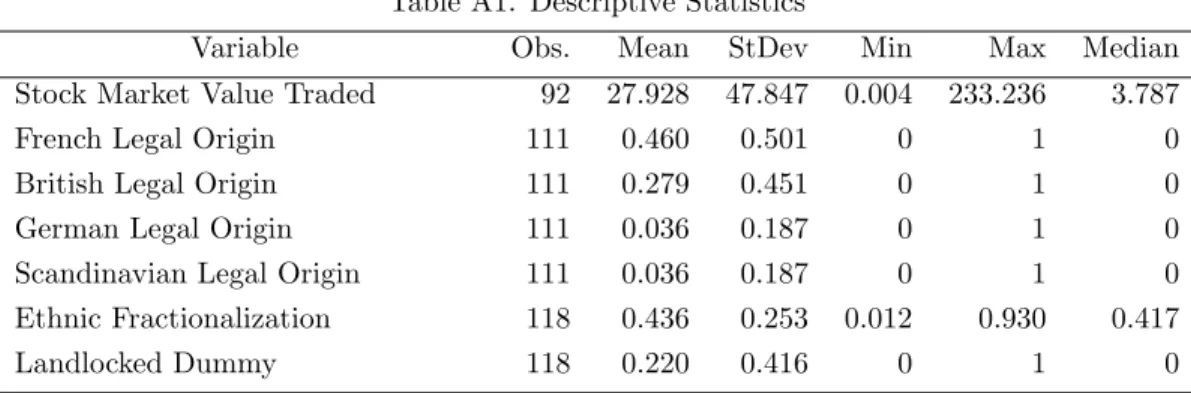
Descriptive Statistics
Table A1. Descriptive Statistics
Variable Obs. Mean StDev Min Max Median
Shadow Economy 119 33.742 13.692 8.38 67.32 35.38
Heritage Foundation Regulatory Freedom
119 41.384 16.751 10 90 38
Heritage Foundation Fiscal Free-dom
119 78.795 11.551 10 100 80.34
World Bank Regulatory Quality 119 0.106 0.935 -1.988 1.898 -0.108
Corruption 119 5.836 2.235 0.2 8.9 6.62
World Bank Rule of Law 119 -0.032 1.002 -1.853 1.955 -0.32
Banking Development 119 50.135 16.577 5.547 92.893 47.658
Banking Depth 119 50.344 18.965 7.953 100 47.876
Banking Inefficiency 119 50.031 16.577 16.331 91.600 49.695
Domestic Credit to the Private Sec-tor
107 40.892 39.751 0.757 157.194 23.892
Domestic Credit Provided by the Banking Sector
117 60.049 53.511 -31.608 303.018 45.828
Liquid Liabilities (M3) 107 50.079 37.860 5.141 238.391 41.609
Public Bank Assets 110 17.514 19.147 0.053 80.853 10.208
Interest Rate Spread 98 9.432 9.653 1.188 59.46 5.893
Net Interest Margin 117 5.836 3.588 1.054 23.155 5.244
Bank Concentration 117 68.090 18.235 23.436 100 67.152
Bank Overhead Cost 116 5.202 2.903 0.978 17.876 4.630
Bank Liquid Reserves 117 11.400 9.507 0.316 59.254 9.426
Bank Capital 90 9.294 4.160 2.94 26.725 8.71
Bank Non-Performing Loans 91 9.654 7.120 0.4 26.98 7.8
Risk Premium on Lending 58 6.681 8.085 -3.55 45.926 4.314
Real GDP per Capita 118 9,698.59 9,516.62 380.12 34,757.98 5,665.50
Openness to Trade 119 84.803 53.274 11.384 403.797 73.812
Financial Openness 115 2.062 2.218 0.426 15.957 1.508
Stock Market Turnover 92 49.896 71.748 0.131 371.585 21.531
Table A1. Descriptive Statistics
Variable Obs. Mean StDev Min Max Median
Stock Market Value Traded 92 27.928 47.847 0.004 233.236 3.787
French Legal Origin 111 0.460 0.501 0 1 0
British Legal Origin 111 0.279 0.451 0 1 0
German Legal Origin 111 0.036 0.187 0 1 0
Scandinavian Legal Origin 111 0.036 0.187 0 1 0
Ethnic Fractionalization 118 0.436 0.253 0.012 0.930 0.417
Table 1. Baseline OLS OLS 1 OLS 2 Regulatory Freedom 0.081 (0.073) 0.082 (0.073) Fiscal Freedom 0.143** (0.058) 0.134** (0.054) Regulatory Quality 2.122 (2.837) 2.075 (2.779) Corruption -0.370 (0.970) -0.131 (0.975) Rule of Law -9.236*** (3.314) -8.865*** (3.361) Banking Development -0.360*** (0.079) Banking Depth -0.115* (0.064) Banking Inefficiency 0.251*** (0.076) Constant 38.813*** (6.246) 13.285 (10.216) R2 0.668 0.670 N 119 119
R-squared is the adjusted coefficient of determination. Numbers in brackets are heteroscedascity robust Newey-West standard errors; Significance levels: *** 1%, ** 5%, * 10%.
Table 2. Measures of Financial Development
Coefficient Estimate
R-Squared # of
Obs. Domestic Credit to the Private Sector -0.086***
(0.026)
0.634 117
Domestic Credit Provided by the Banking Sector -0.051*** (0.016) 0.624 117 Liquid Liabilities -0.086*** (0.021) 0.668 107
Public Bank Assets 0.136**
(0.052)
0.625 111
Interest Rate Spread 0.338***
(0.137)
0.615 98
Net Interest Margin 1.037***
(0.577)
0.639 117
Bank Concentration 0.042
(0.045)
0.597 117
Bank Overhead Cost 0.758
(0.517)
0.617 116
Bank Liquid Reserves 0.116
(0.094)
0.607 117
Bank Capital 0.349
(0.365)
0.649 90
Bank Non-Performing Loans -0.088
(0.217)
0.643 91
Risk Premium on Lending 0.245
(0.159)
0.708 58
R-squared is the adjusted coefficient of determination. Numbers in brackets are heteroscedascity robust Newey-West standard errors; Significance levels: *** 1%, ** 5%, * 10%
Table 3. Correlations between Financial Variables
privo bank M3 dbacba margin overhead spread
privo 1.0000 - - - -bank 0.9299 1.0000 - - - - -M3 0.8131 0.8146 1.0000 - - - -dbacba -0.5015 -0.3582 -0.4486 1.0000 - - -margin -0.5317 -0.4716 -0.5416 0.5037 1.0000 - -overhead -0.4479 -0.4018 -0.4634 0.4629 0.7395 1.0000 -spread -0.3804 -0.3253 -0.3634 0.3857 0.6405 0.4517 1.000
Table 4. Factor Scores for Financial Variables
Unrotated Factors Rotated Factors (varimax) Component 1 Component 2 Component 1 Component 2
privo -0.429* 0.367 0.564* -0.031 bank -0.403* 0.481* 0.624* 0.070 M3 -0.427* 0.325 0.534* -0.060 dbacba 0.311 0.281 -0.031 0.418* margin 0.403* 0.354 -0.047 0.534* overhead 0.345 0.372 0.007 0.508* spread 0.306 0.430* 0.076 0.522*
T able 5. Sensitivit y Analyses (1) (2) (3) (4) (5 ) (6) (7) Regulatory F reedom 0.067 (0.095) 0.071 (0.076) 0.080 (0.074) 0.047 (0.077) 0.048 (0.086) -0.009 (0.092) -0.014 (0.097) Fiscal F reedom 0.146 (0.099) 0.156*** (0.058) 0.143** (0.059) 0.156*** (0.059) 0.121 (0.098) 0.103 (0.094) 0.075 (0.094) Regulatory Q ualit y 2.834 (3.244) 2.703 (2.988) 2.117 (2.865) 1.914 (2.895) 4.572 (3.552) 4.802 (3.495) 4.890 (3.530) Corruption -0.469 (1.224) -0.726 (1.033) -0.368 (0.981) -0.452 (0.975) -2.158 (1.283) -1.891 (1.232) -0.956 (1.168) Rule of La w -10.396** (4.159) -9.523*** (3.357) -9.228*** (3.362) -8.346** (3.259) -18.001*** (3.109) -16.952*** (3.057) -16.370*** (3.192) Banking Dev elopmen t -0.330*** (0.090) -0.361*** (0.078) -0.387*** (0.079) First Principal Comp onen t -1.117* (0.580) Second P rincipal Comp onen t 2.251** (0.913) GDP p er capita -1.370 (1.328) Op en ness to T rade 0.000 (0.015) Financial Op enness -0.198 (0.259) Sto ck Mark et Capit alization -0.051*** (0.014) Sto ck Mark et V alue T raded -0.057*** (0.015) Sto ck Mark et T urno v er -0.023*** (0.009) Constan t 21.634** (10.308) 50.503*** (12.514) 38.811*** (6.277) 41.791*** (6.589) 35.616*** (9.112) 37.174*** (9.134) 34.063*** (9.389) R 2 0.661 0.669 0.665 0.678 0.645 0.643 0.632 N 85 118 119 115 92 92 92 R-squared is the adjusted co efficien t of determination. Num b ers in brac k ets are heteroscedascit y robust New ey-W est standard errors
Table 6. Instrumental Variable Regressions (2SLS)
First Stage Regression Second Stage Regression
British Legal Origin 1.730 (2.915)
Regulatory Freedom 0.054 (0.079) French Legal Origin 0.575
(2.804)
Fiscal Freedom 0.145***
(0.055) German Legal Origin 8.491
(5.454)
Regulatory Quality 3.138 (2.765) Scandinavian Legal Origin -11.741***
(3.875) Corruption -0.322 (1.002) Ethnic Fractionalization -13.424*** (3.551) Rule of Law -10.250*** (3.433) Landlocked Country -10.966*** (2.209) Banking Development -0.334*** (0.104) Constant 50.462*** (10.439) Constant 38.442*** (7.004) N 111 N 111
F-Statistic 57.78 Hansen - J, P-Value 0.6245
R-squared is the adjusted coefficient of determination. Numbers in brackets are heteroscedascity robust Newey-West standard errors; Significance levels: *** 1%, ** 5%, * 10%