National Health Performance
Authority
Hospital Performance:
Costs of acute admitted patients in public hospitals in 2011–12
National Health Performance
Authority
Hospital Performance:
National Health Performance Authority
GPO Box 9848
Sydney, NSW 2001 Australia Telephone: +61 2 9186 9210
www.nhpa.gov.au
© National Health Performance Authority 2015
The National Health Performance Authority licenses use of this report under Creative Commons Attribution-Non Commercial-No Derivatives Licence 3.0, Australia and the terms of this notice.
You are permitted to make fair use of the report consistent with the terms of the licence. You must not make use of the report in a misleading or deceptive manner or in a manner that is inconsistent with the context of the report.
Permissions beyond the scope of the licence may be available at enquiries@nhpa.gov.au Disclaimer
This report is produced for health research, health care and health advocacy purposes. This report is not intended to provide guidance on particular health care choices. You should contact your medical advisors on particular health care choices. ISSN: 2201-3091
Print ISBN: 978-1-76007-184-4 Online ISBN: 978-1-76007-185-1
Suggested citation: National Health Performance Authority 2015, Hospital Performance: Costs of acute admitted patients in public hospitals in 2011–12.
Further copies of this document can be downloaded from www.myhospitals.gov.au
Table of contents
Summary . . . iii
Introduction . . . .1
About this report . . . 1
Why is comparing the costs of hospital services important? . . . 3
About the data . . . 3
More about the main measures . . . .4
Cost per NWAU . . . 4
Comparable Cost of Care . . . 4
More about the contextual measures . . . .6
Cost per admission . . . 6
Length of stay . . . 6
Fair comparisons . . . 7
Key findings . . . .9
Cost per NWAU . . . 10
Comparable Cost of Care . . . 12
Key findings . . . .15
Average cost per admission for 16 conditions and procedures . . . 15
Appendices . . . .32
Glossary . . . .36
References . . . .40
Acknowledgements . . . .41
About the Authority . . . .42 Additional document
Hospital Performance: Costs of acute admitted patients in public hospitals in 2011–12, Technical Supplement
Summary
Hospitals account for a large share of the funds Australia spends on the health sector each year. In 2011–12, about 30% of the estimated $140.2 billion that Australia spent on health was spent on running costs for public hospitals (excluding property, plant and equipment costs).1
Having effective measures to help assess the efficiency of hospitals is therefore important, because the size of the hospital sector means efforts to improve efficiency, if well targeted, have a large potential to yield significant benefits. One way to assess hospital efficiency is to see how much money each hospital uses in comparison to its peers to provide specific treatments or procedures. Conducting such comparisons is however very difficult, because sicker or more complex patients cost more to treat, and because there are a variety of reasons why some cost variations are unavoidable or why some hospitals use more resources than others. It is important to adjust for unavoidable cost variations and to adjust for these other differences before comparisons can be considered meaningful. This report is the result of innovative development work by the National Health Performance Authority (the Authority) that for the first time allows these meaningful comparisons of the relative efficiency of more than 80 of Australia’s largest public hospitals. To achieve this, the Authority includes two
headline measures in the report, Cost per National Weighted Activity Unit (NWAU) and Comparable Cost of Care, both of which adjust as much as possible for the factors that can push hospital costs up unavoidably or in ways that mean they cannot fairly be compared to others. The main difference between the two measures is that Comparable Cost of Care includes emergency department (ED) costs for patients admitted through EDs (Figure 1, page iv).
The first part of the report compares the overall performance of Australian public hospitals using Cost per NWAU and Comparable Cost of Care for acute admitted patients. Both measures report costs for activity units, which allow different treatments and operations to be compared fairly. The second part of the report breaks this down further into costs across major hospitals for 16 selected medical conditions or surgical procedures.
Key findings
Some hospitals were found to have twice the average cost per unit of activity in 2011–12 compared to others in the same peer group, after adjusting for the different types of services provided and complexity of patients (Figure 2, page 11 and Figure 3, page 13). The report highlights the top 10% and bottom 10% for major metropolitan hospitals(see tables, page iv). The highest and lowest results for large metropolitan
and major regional hospitals are highlighted on pages 11 and 13.
Across the different types of hospitals in Australia, the average cost per unit of activity for acute admitted patients was as follows:
• Using Cost per NWAU: costs were more than
twice as high from the lowest to the highest hospital, ranging from $3,100 to $6,400 • Using Comparable Cost of Care: costs were
almost twice as high from the lowest to the highest hospital, ranging from $3,700 to $6,800. The results are broadly the same for the two different measures, Cost per NWAU and Comparable Cost of Care.
Cost per NWAU
Across major metropolitan hospitals, the average Cost per NWAU for acute admitted patients at one hospital was 87% higher
compared to another hospital, ranging from $3,100 to $5,800.
Top 10% of hospitals for this peer group: $5,800 The Canberra Hospital (ACT)
$5,500 Sir Charles Gairdner Hospital (WA) $5,300 Calvary Public Hospital (ACT) $5,300 Logan Hospital (Qld)
Bottom 10% of hospitals for this peer group: $3,400 Dandenong Hospital (Vic)
$3,400 Royal Melbourne Hospital [Parkville] (Vic) $3,400 Sunshine Hospital (Vic)
$3,400 The Northern Hospital [Epping] (Vic) $3,100 Maroondah Hospital [East Ringwood] (Vic)
Comparable Cost of Care
Across major metropolitan hospitals, the Comparable Cost of Care for acute admitted patients at one hospital was 76% higher
compared to another hospital, ranging from $3,700 to $6,500.
Top 10% of hospitals for this peer group: $6,500 The Canberra Hospital (ACT)
$6,300 Calvary Public Hospital (ACT) $5,900 Sir Charles Gairdner Hospital (WA) $5,700 Logan Hospital (Qld)
$5,700 The Prince Charles Hospital (Qld)
Bottom 10% of hospitals for this peer group: $3,900 Royal Melbourne Hospital [Parkville] (Vic) $3,900 Sunshine Hospital (Vic)
$3,900 The Northern Hospital [Epping] (Vic) $3,900 Western Hospital [Footscray] (Vic) $3,800 Dandenong Hospital (Vic)
$3,700 Maroondah Hospital [East Ringwood] (Vic)
Figure 1: What is measured: the difference between Cost per NWAU and Comparable Cost of Care
Hospital
Patient admitted straight to hospital
Patient visits ED, then admitted
Patient visits ED, not admitted
Emergency Department
Emergency Department
Boxes show what is measured in this report
Cost per National Weighted Activity Unit
Across large metropolitan hospitals:
• The average Cost per NWAU for acute admitted patients at one hospital was 96% higher
compared to another hospital, ranging from $3,200 to $6,400 (Figure 2, page 11) • The Comparable Cost of Care for acute
admitted patients at one hospital was 71% higher compared to another hospital, ranging from $4,000 to $6,800 (Figure 3, page 13). Across major regional hospitals:
• The average Cost per NWAU for acute admitted patients at one hospital was 46% higher
compared to another hospital, ranging from $3,600 to $5,300 (Figure 2, page 11) • The Comparable Cost of Care for acute
admitted patients at one hospital was 36% higher compared to another hospital, ranging from $4,200 to $5,800 (Figure 3, page 13).
Conditions and procedures
The report provides the average cost per admission for 16 conditions and procedures, which together represent major areas of medical and surgical care, for major metropolitan and
major regional public hospitals.
The report found the cost of some conditions and procedures were nearly four times higher when comparing hospitals against their peers.
It is important to note that cost figures for the 16 conditions and procedures are not adjusted to take account of differences in the complexity of the condition or patient characteristics that can lead to legitimate increases in costs. They also do not reflect 100% of the actual costs for each condition or procedure. The quoted costs are instead a subset of total costs that are considered comparable (see ‘More about the contextual measures’, page 6).
Appendix removal without complications
In 2011–12, there were 13,099 admissions for appendix removal without complications in major public hospitals. In major metropolitan public hospitals the average cost per admission was $6,300. These hospitals reported an average cost per admission ranging from $4,600 at one hospital to $10,100 at another hospital.Cellulitis without complications
In 2011–12, there were 23,432 admissions for cellulitis without complications in major public hospitals. In major metropolitan public hospitals the average cost per admission was $3,800. These hospitals reported an average cost per admission ranging from $1,900 at one hospital to $7,400 at another hospital.
Chronic obstructive pulmonary disease
without complications
In 2011–12, there were 20,764 admissions for chronic obstructive pulmonary disease (COPD) without complications in major public hospitals. In major metropolitan public hospitals the average cost per admission was $5,500. These hospitals reported an average cost per admission ranging from $3,300 at one hospital to $10,500 at another hospital.
Chronic obstructive pulmonary disease with
complications
In 2011–12, there were 7,187 admissions for chronic obstructive pulmonary disease (COPD) with
complications in major public hospitals. In major metropolitan public hospitals the average cost per admission was $9,700. These hospitals reported an average cost per admission ranging from $5,900 at one hospital to $15,700 at another hospital.
Heart failure without complications
In 2011–12, there were 13,726 admissions for heart failure without complications in major public hospitals. In major metropolitan public hospitals the average cost per admission was $5,600. These hospitals reported an average cost per admission ranging from $2,600 at one hospital to $9,500 at another hospital.Heart failure with complications
In 2011–12, there were 7,264 admissions for heart failure with complications in major public hospitals. In major metropolitan public hospitals the average cost per admission was $11,800. These hospitals reported an average cost per admission ranging from $7,500 at one hospital to $24,800 at another hospital.
Kidney and urinary tract infections without
complications
In 2011–12, there were 19,628 admissions for kidney and urinary tract infections without complications in major public hospitals. In major metropolitan
public hospitals the average cost per admission was $3,400. These hospitals reported an average cost per admission ranging from $1,900 at one hospital to $5,600 at another hospital.
Kidney and urinary tract infections with
complications
In 2011–12, there were 8,821 admissions for kidney and urinary tract infections with complications in major public hospitals. In major metropolitan
public hospitals the average cost per admission was $9,000. These hospitals reported an average cost per admission ranging from $5,500 at one hospital to $14,600 at another hospital.
Hip replacement without complications
In 2011–12, there were 6,729 hip replacements without complications in major public hospitals. Inmajor metropolitan public hospitals the average cost per admission was $19,400. These hospitals reported an average cost per admission ranging from $12,500 at one hospital to $25,600 at another hospital.
Knee replacement without complications
In 2011–12, there were 5,613 knee replacements without complications in major public hospitals. Inmajor metropolitan public hospitals the average cost per admission was $18,800. These hospitals reported an average cost per admission ranging from $10,600 at one hospital to $29,300 at another hospital.
Gallbladder removal without complications
In 2011–12, there were 13,034 admissions for gallbladder removal without complications in major public hospitals. In major metropolitanpublic hospitals the average cost per admission was $7,400. These hospitals reported an average cost per admission ranging from $4,800 at one hospital to $13,000 at another hospital.
Prostate removal without complications
In 2011–12, there were 3,438 admissions for prostate removal without complications in major public hospitals. In major metropolitan public hospitals the average cost per admission was $6,300. These hospitals reported an average cost per admission ranging from $4,700 at one hospital to $7,500 at another hospital.Vaginal delivery without complications
In 2011–12, there were 53,234 vaginal deliveries without complications in major public hospitals. In major metropolitan public hospitals the average cost per admission was $4,600. These hospitals reported an average cost per admission ranging from $2,200 at one hospital to $6,500 at another hospital.Caesarean delivery without complications
In 2011–12, there were 23,935 caesarean deliveries without complications in major public hospitals. In major metropolitan public hospitals the average cost per admission was $8,800. These hospitals reported an average cost per admission ranging from $5,500 at one hospital to $15,300 at another hospital.Gynaecological reconstructive procedures
without complications
In 2011–12, there were 2,793 admissions for gynaecological reconstructive procedures without complications in major public hospitals. In major metropolitan public hospitals the average cost per admission was $6,300. These hospitals reported an average cost per admission ranging from $4,100 at one hospital to $8,000 at another hospital.
Hysterectomy without complications
In 2011–12, there were 4,373 admissions for hysterectomy without complications in major public hospitals. In major metropolitan public hospitals the average cost per admission was $9,200. These hospitals reported an average cost per admission ranging from $5,400 at one hospital to $19,900 at another hospital.About relative efficiency
The efficiency of Australia’s health system would increase if steps were taken to reduce hospital costs while retaining or improving quality of care and patient outcomes.
The two main measures used in the report, Cost per NWAU and Comparable Cost of Care, use different methods of calculation. Both include the cost of acute admitted patients; one excludes the cost of emergency department (ED) services and one includes it for those who are admitted through ED. Results for individual hospitals are broadly the same regardless of which measure is used; in other words, hospitals that appear either more or less efficient using one measure have very similar results using the other measure. The fact that results for hospitals are similar using both measures creates additional confidence in the reliability of the report’s findings.
While the report compares the relative efficiency of hospitals by comparing the average cost of a unit of activity, it has not been possible in this report to consider the quality of care provided, or the health outcomes experienced by patients. As a result, it is not possible to conclude whether a hospital with lower or higher cost per unit of activity provides better or worse health outcomes than other hospitals, and therefore the Authority makes no determination in this report that any particular hospital is performing well or poorly.
Explore performance information for more than 1,000 public and private hospitals in Australia at www.myhospitals.gov.au Find out how your hospital is performing, search for a hospital by state or territory or postcode, view a hospital’s profile and the services it offers, and see the changes in performance results over time.
MyHospitals also has a variety of tools to compare hospital performance outcomes across Australia. You can use our interactive tools to access new valuable performance reporting information on the following measures:
• Cost per NWAU (2011–12)
• Comparable Cost of Care (2011–12). Compare your local hospital with other similar hospitals. Look for this icon to view comparative results across hospitals.
All of the National Health Performance Authority’s reports and data are available to download free of charge from the website.
Introduction
About this report
This report provides insights into the relative efficiency of public hospitals by allowing fair comparisons of the costs they incur in caring for their patients. A hospital is considered more efficient if it is able to deliver more services while consuming fewer resources. In this light, measuring hospital costs for a given service helps to show how efficient hospitals are relative to each other. In 2011–12, the entire health sector was estimated to have cost federal, state and territory governments, private health insurers and individuals $140.2 billion.1 Public hospitals
represented the largest portion of this, accounting for $42.0 billion (excluding property, plant and equipment costs), including $26.1 billion for acute and emergency department (ED) services.1,2
Effective approaches to help assess the efficiency of different hospitals are therefore important, because the size of the hospital sector means efforts to improve efficiency, if well targeted, have a large potential to yield significant benefits towards ensuring money is spent more effectively. This report has national significance because it is the first time this information about the costs of delivering services to acute admitted patients has been made publicly available. The report discusses results for 86 of Australia’s largest hospitals, and also provides a summary in tabular form (Appendix 1, page 32). Results for a further 11 hospitals are available on the MyHospitals website. These hospitals have not been included in the report because their results are not fully comparable. A list of these hospitals can be found in Appendix 2, page 34.
As public hospitals provide a range of services to a variety of patients, the report focuses on patients that consume the largest portion of costs, namely those who are admitted for acute care. To ensure results are comparable between hospitals, the report accounts for known legitimate increases in costs. These include costs associated with the complexity of the patient’s condition or procedure, and individual patient characteristics, such as the additional costs of treating patients who live in remote areas. The report excludes costs that are accounted for in different ways across states and territories, such as costs of consumables (for example, blood) and other costs of property, plant and equipment. This approach enhances confidence in the reliability of the results.
The Authority’s approach of concentrating on a comparable subset of total costs means that, across 82 hospitals with results for Comparable Cost of Care, the total value of the costs being examined in this report amounts to $16.0 billion of the $26.1 billion spent nationally on acute admitted and ED patients in public hospitals in 2011–12.
The National Health Performance Authority (the Authority) bases its performance reports on indicators agreed by the
Council of Australian Governments (COAG). This report provides insights into the following indicators:
• Cost per weighted separation and total case weighted separations
• Relative Stay Index for multi-day stay patients.
This report provides information about the relative efficiency of public hospitals, using two separate measures:
• Cost per National Weighted Activity Unit (NWAU) is a measure of the average cost of a unit of activity provided to acute admitted patients in a public hospital
• Comparable Cost of Care is a measure that focuses on the comparable costs of acute admitted patients and includes the costs of emergency department patients who are subsequently admitted to allow for an assessment of the relative efficiency of public hospitals.
The Authority uses two headline measures in the report, Cost per NWAU and Comparable Cost of Care, to provide additional confidence in the reliability of the results.
By including both measures, which use different methods of calculation, the Authority has
demonstrated that results for individual hospitals are broadly the same regardless of which measure is used. In other words, hospitals that appear either more efficient or less efficient using one measure have very similar results using the other measure. The fact that results for hospitals are similar using both measures creates additional confidence in the reliability of the report’s findings and of the relativities in hospital efficiency
(Appendix 3, page 35).
Additionally, the report includes information for 16 conditions and procedures using the following two measures:
• Cost per admission is a measure that shows how much money different hospitals spend to treat patients admitted for any of the
16 conditions or procedures
• Length of stay is a relevant contextual measure using data for 2011–12 which shows the average number of days a patient stayed in hospital.
For the part of the report focusing on the average cost for specific types of admissions, the
16 conditions or procedures were selected by clinicians and hospital managers to represent major areas of medical and surgical care for
major metropolitan and major regional public hospitals. This information has been provided to allow health care professionals to better understand how their day-to-day activities may contribute to their hospital’s overall result.
As length of stay in hospital is a driver of the cost of treating many patients, this report includes information on the length of these stays for the 16 conditions or procedures, and the costs involved. This information is provided to give health care professionals transparent information about factors they can influence in a more immediate way.
It is important to note that cost figures for the 16 conditions and procedures are not adjusted to take account of differences in the complexity of the condition or patient characteristics that can lead to legitimate increases in costs. They also do not reflect 100% of the actual costs for each condition or procedure. The quoted costs are instead a subset of total costs that are considered comparable (see ‘More about the contextual measures’, page 6).
Importantly, while the report compares the relative efficiency of hospitals by using their average cost of a unit of activity, it has not been possible to consider the quality of care provided or the health outcomes experienced by patients. As a result, it is not possible to conclude whether a hospital with lower or higher efficiency results provides better or worse health outcomes than other hospitals, and therefore the Authority makes no determination in this report that any particular hospital is performing well or poorly.
Why is comparing the costs of
hospital services important?
The efficiency of Australia’s health system would increase if steps were taken to reduce hospital costs while retaining or improving quality of care and patient outcomes.
Every day, clinicians make decisions that
influence, for example, the number and types of tests, treatments, devices, procedures and the number of days a patient stays in hospital. Accordingly, this report aims to equip health care professionals with comparable performance information to support their work to deliver patient care without placing undue resource demands on the health care system.
About the data
Data used in this report are calculated from the National Hospital Cost Data Collection (NHCDC) and the Admitted Patient Care National Minimum Data Set.
The NHCDC is recognised internationally as an important and unique resource, used by the Independent Hospital Pricing Authority (IHPA) to establish prices for public hospital services which are eligible for funding under the National Health Reform Agreement (NHRA). The national consistency and completeness of the NHCDC has undergone assurances and review by external auditors.3,4,5
The data submitted to the NHCDC is owned by state and territory governments. Some governments release more recent data on their websites comparing the efficiency of their public hospitals. However, measures designed for comparison of public hospitals within a state or territory are not necessarily comparable to other jurisdictions. The measures used in this report support the national fair comparison of the relative efficiency of Australia’s largest public hospitals. This report is based on 2011 –12 data because of the length of time required for this information to be collected nationally, and to carry out the work required to make this information comparable between states and territories. With the report’s methods now established, it is anticipated that future reports will be able to use more timely data, which will also show if relativities between hospitals have shifted since 2011–12.
Comparable Cost of Care
Comparable Cost of Care is a term coined by the Authority to denote a method of measuring the average cost of a unit of activity for acute admitted patients. It uses comparable costs to allow an assessment of the relative efficiency of hospitals. But unlike Cost per NWAU, Comparable Cost of Care includes costs associated with the care provided in the emergency department (ED) prior to admission, as the Authority has previously found large variation between hospitals in the length of time patients stayed in ED.6Additionally, Comparable Cost of Care includes patients whose treatment is not funded under the National Health Reform Agreement by Activity Based Funding, such as patients covered by the Department of Veterans’ Affairs or motor vehicle accident and workers’ compensation schemes.
As with Cost per NWAU, the measure includes comparable costs that are recorded consistently across the nation’s public hospitals, calculated with reference to a standardised unit of activity. It excludes costs related to property, plant and equipment and where accounting practices differ between states and territories.
The unit of activity is weighted to account for the differences in the complexity of patients’ conditions or procedures and particular
individual patient characteristics that are known to increase costs unavoidably, for example patients who live in remote areas.
Cost per NWAU
The National Weighted Activity Unit (NWAU) was developed by the Independent Hospital Pricing Authority (IHPA) to set the pricing of public hospital services. The NWAU allows different hospital activities to be
expressed in terms of a common unit of activity. An ‘average’ public hospital service is worth one NWAU. More intensive and expensive activities are worth multiple NWAUs, and simpler and less expensive activities are worth fractions of an NWAU. For example, a typical case of cellulitis is assigned a weighted unit of activity of 0.8 since this condition requires fewer hospital resources than a typical hip replacement, which is assigned a weighted unit of activity of 4.2.
The NWAU accounts for the differences in the complexity of patients’ conditions or procedures and individual patient characteristics.
Cost per NWAU for acute admitted patients is a measure of the average cost of one NWAU for patients who are admitted to a hospital from the emergency department, pre-admission clinic or specialist clinic. Therefore, it does not include any emergency department costs associated with these patients.
The measure focuses on the hospital costs of patients whose treatment is eligible for Commonwealth funding under the National Health Reform Agreement. It excludes costs relating to hospital services funded by other Commonwealth programmes, for example highly specialised drugs for chemotherapy, or services for patients funded by the Department of Veterans’ Affairs, motor vehicle accident insurance, workers’ compensation or public liability damage claims.
Table 1: Differences between the measures of Cost per NWAU and Comparable Cost of Care
Cost per NWAU Comparable Cost of Care Comparable costs
Allied health; Imaging; Pharmacy; Pathology
Critical care
Hotel goods and services*
Non-clinical and on-costs
Operating room
Prostheses
Specialised procedure suite
Ward medical, nursing and supplies
ED costs
Blood costs
Teaching, training & research (direct)
Depreciation
Excluded costs*
Payroll tax
Medications subsidised by Commonwealth
programmes (e.g. PBS)
Property, plant and equipment
Patients included
Public patients
Private patients†
Admitted in 2011–12 and discharged in 2011–12
Compensable patients
Department of Veterans’ Affairs
Adjustments for legitimate cost variations
Specialist paediatric; Specialist psychiatric age; Indigenous; Remoteness area; Intensive care
unit; Radiotherapy
NWAU Cost per NWAUCost per National Weighted Activity Unit CCC
(NWAU)is a measure of the average cost of a unit of activity provided to acute admitted patients in a public hospital.
Comparable Cost of Care
Comparable Cost of Care is a measure that focuses on the comparable costs of acute admitted patients and includes the costs of emergency department patients who are subsequently admitted to allow for an assessment of the relative efficiency of public hospitals.
* As defined by the Australian Hospital Patient Costing Standards (AHPCS), version 2.0.
Cost per admission
Cost per admission is a measure developed by the Authority that uses the same subset of costs as in Comparable Cost of Care. However, unlike Comparable Cost of Care, it does not adjust for the complexity of patients or known legitimate cost drivers.This measure has been used to analyse the variation in costs for 16 selected conditions and procedures across Australia’s major public hospitals included in this report. Because the cost figures applied to the 16 conditions and procedures use a subset of total costs, as noted above, it is important to recognise this means the cost figures quoted on pages 16 to 31 do not represent the full costs of treating these patients. A list showing which costs have been excluded can be seen in
Table 1, page 5 (in the column ‘Comparable Cost of Care’). While the costs are not complete, this methodology ensures the costs quoted are fully comparable across hospitals.
Length of stay
Length of stay is a measure of the average duration in hospital for patients admitted for a particular condition or procedure, counted in days.
The Council of Australian Governments (COAG) has recognised length of stay as a measure of hospital efficiency, by including it as one of the indicators in the Performance and Accountability Framework, the document endorsed by
all Australian governments that guides the Authority’s work.
In 2013, the Authority reported large differences across Australia’s public hospitals in the average length of stay for similar patients, even among hospitals of similar size and geographic location.7 Accordingly, this report includes previously published information on length of stay in 2011–12 among patients who stayed at least one night in hospital for one of 16 conditions and procedures. This information has been provided to make explicit the link between incremental increases in costs for each additional day spent in hospital. It also ensures the length of stay data reflects the same data period as used for the cost data in this report.
Length of stay data for the 2012–13 year is now available at www.myhospitals.gov.au
Fair comparisons
The Authority has used five approaches to support national comparability of the relative efficiency of public hospitals:
• Designing the Comparable Cost of Care measure to include costs that are similarly accounted for across hospitals
• Standardisation of Cost per NWAU and Comparable Cost of Care to account for differences between hospitals in the types of services provided and complexity of patients admitted
• Rounding of costs to acknowledge any remaining uncertainty in the precision of estimates
• Suppression of results for hospitals in cases where cost data are not fully available or comparable
• Peer grouping of hospitals to allow for fairer comparisons to similarfacilities using nationally agreed peer groups.
The methodology used by the Authority also adjusted for patients with characteristics that increased costs within hospitals to which they were admitted (for example, patients from rural areas). The result of that work is that the peer group averages are very similar across peered hospitals for both Cost per NWAU and Comparable Cost of Care.
This report presents comparison figures for the three largest hospital peer groups:
• Major metropolitan • Large metropolitan • Major regional.
For more detail on the methodology used in this report, see Hospital Performance: Costs of acute admitted patients in public hospitals in 2011–12, Technical Supplement at www.myhospitals.gov.au
Key findings
Cost per NWAU
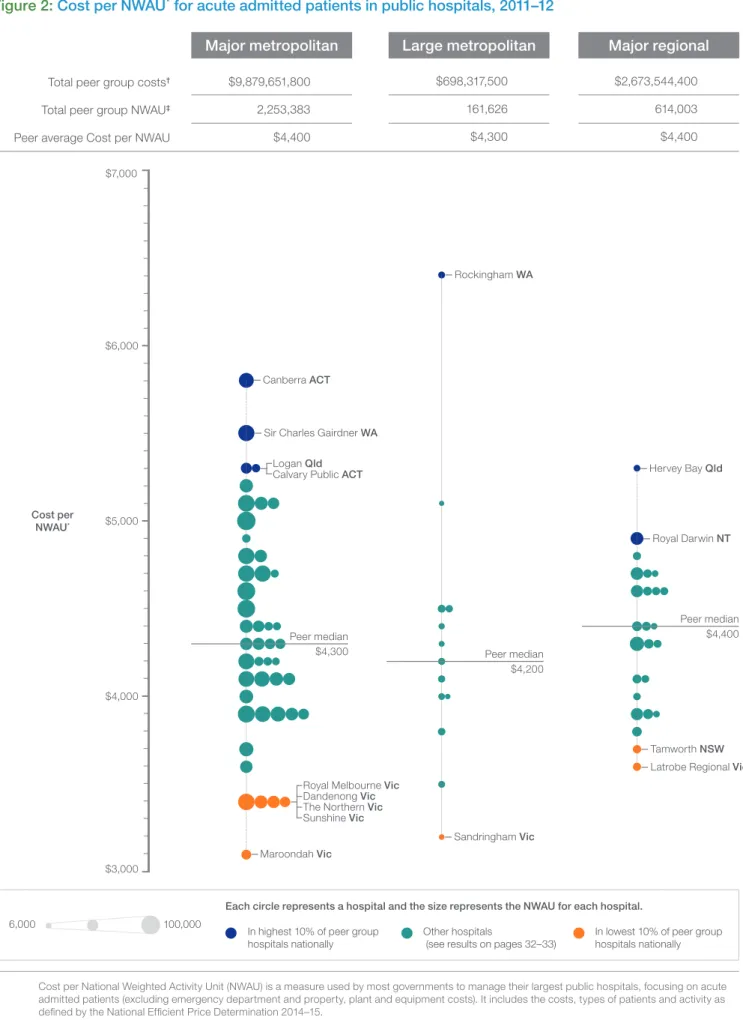
Considerable variation was found across major and large metropolitan and major regional hospitals nationally in terms of the Cost per NWAU, ranging from $3,100 to $6,400. Within the individual hospital peer groups, where comparisons are fairer and more meaningful, the ranges are shown below.
Across major metropolitan hospitals, the average Cost per NWAU was $4,400. The averages at individual hospitals within this peer group ranged from $3,100 at one hospital to $5,800 at another (87% higher).
Top 10% of hospitals in this peer group: $5,800 The Canberra Hospital (ACT) $5,500 Sir Charles Gairdner Hospital (WA) $5,300 Calvary Public Hospital (ACT) $5,300 Logan Hospital (Qld)
Bottom 10% of hospitals in this peer group: $3,400 Dandenong Hospital (Vic)
$3,400 Royal Melbourne Hospital [Parkville] (Vic) $3,400 Sunshine Hospital (Vic)
$3,400 The Northern Hospital [Epping] (Vic) $3,100 Maroondah Hospital [East Ringwood] (Vic)
Key findings: Cost per NWAU and
Comparable Cost of Care
Some hospitals were found to have twice the average cost per unit of activity
in 2011–12 compared to others in the same peer group, after adjusting for the
different types of services provided, complexity of admitted patients and patient
characteristics that lead to legitimate increases in cost. The results were broadly the
same using either of the two main measures, Cost per NWAU or Comparable Cost
of Care.
Across large metropolitan hospitals, the average Cost per NWAU was $4,300. The averages at individual hospitals within this peer group ranged from $3,200 at one hospital to $6,400 at another
(96% higher).
Top 10% of hospitals in this peer group: $6,400 Rockingham General Hospital (WA) Bottom 10% of hospitals in this peer group: $3,200 Sandringham Hospital (Vic)
Across major regional hospitals, the average Cost per NWAU was $4,400. The averages at individual hospitals within this peer group ranged from $3,600 at one hospital to $5,300 at another
(46% higher).
Top 10% of hospitals in this peer group: $5,300 Hervey Bay Hospital (Qld)
$4,900 Royal Darwin Hospital (NT)
Bottom 10% of hospitals in this peer group: $3,700 Tamworth Hospital (NSW)
$3,600 Latrobe Regional Hospital [Traralgon] (Vic) Figure 2, page 11 summarises the Cost per NWAU in 84 major and large metropolitan and
major regional hospitals. Results for all these hospitals can be found in Appendix 1, page 32.
* Cost per National Weighted Activity Unit (NWAU) is a measure used by most governments to manage their largest public hospitals, focusing on acute admitted patients (excluding emergency department and property, plant and equipment costs). It includes the costs, types of patients and activity as defined by the National Efficient Price Determination 2014–15.
† Includes the costs as defined by the National Efficient Price Determination 2014–15.
‡ A measure of a common unit of activity calculated using the National Efficient Price Determination 2014–15.
Sources: National Health Performance Authority analysis of results calculated using the National Hospital Cost Data Collection 2011–12 and Admitted Patient Care National Minimum Dataset 2011–12.
Figure 2: Cost per NWAU* for acute admitted patients in public hospitals, 2011–12
Total peer group costs†
Total peer group NWAU‡
Peer average Cost per NWAU
Major metropolitan Large metropolitan Major regional
Cost per NWAU*
Each circle represents a hospital and the size represents the NWAU for each hospital.
In highest 10% of peer group hospitals nationally
Other hospitals
(see results on pages 32–33)
In lowest 10% of peer group hospitals nationally 6,000 100,000 $4,000 $5,000 $6,000 $7,000 $3,000 $9,879,651,800 2,253,383 $4,400 $698,317,500 161,626 $4,300 $2,673,544,400 614,003 $4,400 Peer median $4,300 Peer median $4,200 Peer median $4,400 Dandenong Vic
Royal Melbourne Vic
The Northern Vic
Sunshine Vic
Maroondah Vic
Sir Charles Gairdner WA
Logan Qld
Calvary Public ACT
Canberra ACT Rockingham WA Sandringham Vic Hervey Bay Qld Royal Darwin NT Tamworth NSW
Comparable Cost of Care
There was also considerable variation across major and large metropolitan and major regional hospitals nationally in terms of the Comparable Cost of Care, which also includes the costs of care provided in ED prior to admission. Results ranged from $3,700 to $6,800 in 2011–12 (Figure 3, page 13). Within the individual hospital peer groups, where comparisons are fairer and more meaningful, the ranges are shown below. Across major metropolitan hospitals, the average Comparable Cost of Care was $4,900. The averages at individual hospitals within this peer group ranged from $3,700 at one hospital to $6,500 at another (76% higher).
Top 10% of hospitals in this peer group: $6,500 The Canberra Hospital (ACT) $6,300 Calvary Public Hospital (ACT) $5,900 Sir Charles Gairdner Hospital (WA) $5,700 Logan Hospital (Qld)
$5,700 The Prince Charles Hospital (Qld) Bottom 10% of hospitals in this peer group: $3,900 Royal Melbourne Hospital [Parkville] (Vic) $3,900 Sunshine Hospital (Vic)
$3,900 The Northern Hospital [Epping] (Vic) $3,900 Western Hospital [Footscray] (Vic) $3,800 Dandenong Hospital (Vic)
$3,700 Maroondah Hospital [East Ringwood] (Vic)
Across large metropolitan hospitals, the average Comparable Cost of Care was $5,000. The averages at individual hospitals within this peer group ranged from $4,000 at one hospital to $6,800 at another (71% times higher).
Top 10% of hospitals in this peer group: $6,800 Rockingham General Hospital (WA) Bottom 10% of hospitals in this peer group: $4,000 Sandringham Hospital (Vic)
Across major regional hospitals, the average Comparable Cost of Care was $4,900. The averages at individual hospitals within this peer group ranged from $4,200 at one hospital to $5,800 at another (36% higher).
Top 10% of hospitals in this peer group: $5,800 Hervey Bay Hospital (Qld)
$5,500 Royal Darwin Hospital (NT)
Bottom 10% of hospitals in this peer group: $4,400 Ballarat Health Services [Base Campus] (Vic) $4,200 Tamworth Hospital (NSW)
Figure 3, page 13 summarises the Comparable Cost of Care in 82 major and large metropolitan
and major regional hospitals. Results for all these hospitals can be found in Appendix 1, page 32.
* Comparable Cost of Care measures the relative efficiency of acute admitted patients, including the care provided in the Emergency Department prior to admission. It excludes property, plant and equipment costs.It includes the cost, types of patients and activity as defined by the Hospital Performance: Costs of acute admitted patients in public hospitals in 2011–12, Technical Supplement.
† Includes the costs as defined by Hospital Performance: Costs of acute admitted patients in public hospitals in 2011–12, Technical Supplement. ‡ A measure of a common unit of activity calculated as detailed in the Hospital Performance: Costs of acute admitted patients in public hospitals
in 2011–12, Technical Supplement.
Sources:National Health Performance Authority analysis of results calculated using the National Hospital Cost Data Collection 2011–12 and Admitted Patient
Care National Minimum Dataset 2011–12.
Figure 3: Comparable Cost of Care* for acute admitted patients in public hospitals, 2011–12
Total peer group costs†
Total peer group units of activity‡
Peer average Comparable Cost of Care
$12,131,660,200 2,477,736 $4,900 Major metropolitan $805,871,900 162,098 $5,000 Large metropolitan $3,061,599,700 618,781 $4,900 Major regional Comparable Cost of Care*
Each circle represents a hospital and the size represents the units of activity for each hospital.
In highest 10% of peer group hospitals nationally
Other hospitals
(see results on pages 32–33)
In lowest 10% of peer group hospitals nationally 6,000 100,000 $4,000 $5,000 $6,000 $7,000 $3,000 Peer median $4,800 Peer median $4,900 Peer median $4,900 Western Vic
Royal Melbourne Vic
The Northern Vic
Sunshine Vic
Maroondah Vic
Dandenong Vic
Sir Charles Gairdner WA
Prince Charles Qld
Logan Qld
Canberra ACT
Calvary Public ACT
Rockingham WA Sandringham Vic Tamworth NSW Ballarat Vic Hervey Bay Qld Royal Darwin NT
Key findings
$0
Length of stay (in days)
Same day 1 2 3 $1,000 $2,000 $3,000 $4,000 $5,000 $6,000 $7,000 $8,000
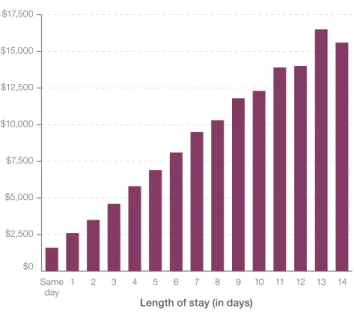
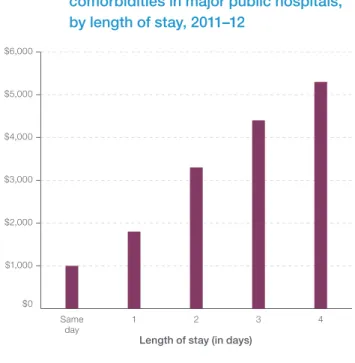
Figure 4: Average cost for appendix removal without complications or comorbidities in major public hospitals, by length of stay, 2011–12
Sources: National Health Performance Authority analysis of results calculated using the National Hospital Cost Data Collection 2011–12 and Admitted Patient Care National Minimum Dataset 2011–12. Appendix removal (also called appendectomy) is
a surgical procedure which is performed either through keyhole surgery or open surgery. The data presented here relate to costs incurred by a hospital for patients who were admitted for the removal of the appendix without complications or comorbidities, malignant cancer or peritonitis. In 2011–12, there were 13,099 admissions for appendix removal without complications or comorbidities, malignant cancer or peritonitis in
major metropolitan and major regional public hospitals.
Across all major metropolitan hospitals, the average cost per admission for appendix removal was $6,300. The average cost per admission ranged from $4,600 at one hospital to $10,100 at another hospital.
Across all major regional hospitals, the average cost per admission for appendix removal was $6,300. The average cost per admission ranged from $4,300 at one hospital to $9,300 at another hospital. A previous Authority report showed the average length of stay for appendix removal in 2011–12 was 2.2 days.7 At
major metropolitan hospitals, the average length of stay ranged from 1.6 to 3.0 days, and at major regional
hospitals the average length of stay ranged from 1.6 to 2.8 days.7
Appendix removal
Without complications or comorbidities
By comparing the cost of a patient’s appendix removal to their length of stay it is possible to assess the incremental cost that each additional day(s) spent in hospital contributes to the patient’s costs of care (Figure 4).
It is important to note that these costs do not reflect the total costs of this procedure. The report considers only the subset of total costs that are fully comparable between hospitals. For example, it excludes property, plant and equipment costs.
$0
Length of stay (in days)
Same day 1 2 3 4 5 6 $1,000 $2,000 $3,000 $4,000 $5,000 $6,000
Figure 5: Average cost for cellulitis without complications or comorbidities in major public hospitals, by length of stay, 2011–12
Sources: National Health Performance Authority analysis of results calculated using the National Hospital Cost Data Collection 2011–12 and Admitted Patient Care National Minimum Dataset 2011–12. Cellulitis is a bacterial infection of the skin and
underlying tissue which is usually treated with antibiotics. The data presented here relate to costs incurred by a hospital for patients who were admitted for cellulitis without complications or comorbidities.
In 2011–12, there were 23,432 admissions for cellulitis without complications or comorbidities in major metropolitan and major regional public hospitals.
Across all major metropolitan hospitals, the average cost per admission for cellulitis was $3,800. The average cost per admission ranged from $1,900 at one hospital to $7,400 at another hospital. Across all major regional hospitals, the average cost per admission for cellulitis was $4,000. The average cost per admission ranged from $2,700 at one hospital to $5,500 at another hospital. A previous Authority report showed the average length of stay for cellulitis in 2011–12 was 3.8 days.7 At major
metropolitan hospitals, the average length of stay ranged from 2.1 to 5.5 days, and at major regional hospitals the average length of stay ranged from 2.5 to 6.4 days.7
Cellulitis
Without complications or comorbidities
By comparing the cost of a patient’s admission for cellulitis to their length of stay it is possible to assess the incremental cost that each additional day(s) spent in hospital contributes to the patient’s costs of care (Figure 5).
It is important to note that these costs do not reflect the total costs of treating this condition. The report considers only the subset of total costs that are fully comparable between hospitals. For example, it excludes property, plant and equipment costs.
Over half of the admissions for cellulitis are
Figure 6: Average cost for COPD without
complications or comorbidities in major public hospitals, by length of stay, 2011–12
Sources: National Health Performance Authority analysis of results calculated using the National Hospital Cost Data Collection 2011–12 and Admitted Patient Care National Minimum Dataset 2011–12. Chronic obstructive pulmonary disease (COPD)
is a progressive lung disease characterised by narrowing of the airways and reduced lung volume. This condition is commonly caused by smoking or other lung irritants, and includes diagnoses such as emphysema and chronic bronchitis. The data presented here relate to costs incurred by a hospital for patients who were admitted for COPD without complications or comorbidities.
In 2011–12, there were 20,764 admissions for COPD without complications or comorbidities in
major metropolitan and major regional public hospitals.
Across all major metropolitan hospitals, the average cost per admission for COPD without complications was $5,500. The average cost per admission ranged from $3,300 at one hospital to $10,500 at another hospital.
Across all major regional hospitals, the average cost per admission for COPD without complications was $5,800. The average cost per admission ranged from $3,600 at one hospital to $7,800 at another hospital.
A previous Authority report showed the average length of stay for COPD without complications in 2011–12 was 5.0 days.7
At major metropolitan hospitals, the average length of stay for COPD without complications ranged from 3.5 to 6.3 days, and at major regional hospitals the average length of stay ranged from 3.4 to 6.5 days.7
Chronic obstructive pulmonary disease
Without complications or comorbidities
By comparing the cost of a patient’s admission for COPD without complications to their length of stay it is possible to assess the incremental cost that each additional day(s) spent in hospital contributes to the patient’s costs of care (Figure 6).
It is important to note that these costs do not reflect the total costs of treating this condition. The report considers only the subset of total costs that are fully comparable between hospitals. For example, it excludes property, plant and equipment costs.
Admissions for COPD without complications are considered potentially preventable hospitalisations.8
$0
Length of stay (in days)
Same day 1 2 3 4 5 6 7 8 $2,000 $4,000 $6,000 $8,000 $10,000
Figure 7: Average cost for COPD with
complications or comorbidities in major public hospitals, by length of stay, 2011–12
Sources: National Health Performance Authority analysis of results calculated using the National Hospital Cost Data Collection 2011–12 and Admitted Patient Care National Minimum Dataset 2011–12. Chronic obstructive pulmonary disease (COPD)
is a progressive lung disease characterised by narrowing of the airways and reduced lung volume. This condition is commonly caused by smoking or other lung irritants, and includes diagnoses such as emphysema and chronic bronchitis. The data presented here relate to costs incurred by a hospital for patients who were admitted for COPD with complications or comorbidities.
In 2011–12, there were 7,187 admissions for COPD with complications or comorbidities in
major metropolitan and major regional public hospitals.
Across all major metropolitan hospitals, the average cost per admission for COPD with complications was $9,700. The average cost per admission ranged from $5,900 at one hospital to $15,700 at another hospital.
Across all major regional hospitals, the average cost per admission for COPD with complications was $12,000. The average cost per admission ranged from $7,800 at one hospital to $17,800 at another hospital.
A previous Authority report showed the average length of stay for COPD with complications in 2011–12 was 8.5 days.7
At major metropolitan hospitals, the average length of stay for COPD with complications ranged from 5.5 to 11.7 days, and at major regional hospitals the average length of stay ranged from 5.9 to 12.2 days.7
Chronic obstructive pulmonary disease
With complications or comorbidities
By comparing the cost of a patient’s admission for COPD with complications to their length of stay it is possible to assess the incremental cost that each additional day(s) spent in hospital contributes to the patient’s costs of care (Figure 7).
It is important to note that these costs do not reflect the total costs of treating this condition. The report considers only the subset of total costs that are fully comparable between hospitals. For example, it excludes property, plant and equipment costs.
$0
Length of stay (in days)
Same day 1 2 3 4 5 6 7 8 9 10 11 12 13 14 $2,500 $5,000 $7,500 $10,000 $12,500 $15,000 $17,500
Heart failure is a chronic condition that occurs when the heart is unable to pump blood strongly enough around the body. It includes cardiac shock, which occurs when blood flow to vital organs is inadequate for normal function. The data presented here relate to costs incurred by a hospital for patients who were admitted for heart failure without complications or comorbidities. In 2011–12, there were 13,726 admissions for heart failure without complications or
comorbidities in major metropolitan and major regional public hospitals.
Across all major metropolitan hospitals, the average cost per admission for heart failure without complications was $5,600. The average cost per admission ranged from $2,600 at one hospital to $9,500 at another hospital.
Across all major regional hospitals, the average cost per admission for heart failure without complications was $6,000. The average cost per admission ranged from $4,400 at one hospital to $8,000 at another hospital.
A previous Authority report showed the average length of stay for heart failure without complications in 2011–12 was 5.1 days.7 At major metropolitan
hospitals, the average length of stay for heart failure without complications ranged from 3.2 to 6.7 days, and at
major regional hospitals the average length of stay ranged from 3.4 to 6.0 days.7
Heart failure
Without complications or comorbidities
By comparing the cost of a patient’s admission for heart failure without complications to their length of stay it is possible to assess the incremental cost that each additional day(s) spent in hospital contributes to the patient’s costs of care
(Figure 8).
It is important to note that these costs do not reflect the total costs of treating this condition. The report considers only the subset of total costs that are fully comparable between hospitals. For example, it excludes property, plant and equipment costs.
Figure 8: Average cost for heart failure without complications or comorbidities in major public hospitals, by length of stay, 2011–12
Sources: National Health Performance Authority analysis of results calculated using the National Hospital Cost Data Collection 2011–12 and Admitted Patient Care National Minimum Dataset 2011–12.
$0
Length of stay (in days)
Same day 1 2 3 4 5 6 7 8 $2,000 $4,000 $6,000 $8,000 $10,000
Heart failure is a chronic condition that occurs when the heart is unable to pump blood strongly enough around the body. It includes cardiac shock, which occurs when blood flow to vital organs is inadequate for normal function. The data presented here relate to costs incurred by a hospital for patients who were admitted for heart failure with complications or comorbidities. In 2011–12, there were 7,264 admissions for heart failure with complications or comorbidities in major metropolitan and major regional public hospitals.
Across all major metropolitan hospitals, the average cost per admission for heart failure with complications was $11,800. The average cost per admission ranged from $7,500 at one hospital to $24,800 at another hospital.
Across all major regional hospitals, the average cost per admission for heart failure with complications was $12,900. The average cost per admission ranged from $8,300 at one hospital to $16,900 at another hospital.
A previous Authority report showed the average length of stay for heart failure with complications in 2011–12 was 9.9 days.7 At major metropolitan hospitals,
the average length of stay for heart failure with complications ranged from 7.2 to 13.9 days, and at major regional
hospitals the average length of stay ranged from 7.2 to 15.0 days.7
Heart failure
With complications or comorbidities
By comparing the cost of a patient’s admission for heart failure with complications to their length of stay it is possible to assess the incremental cost that each additional day(s) spent in hospital contributes to the patient’s costs of care (Figure 9). It is important to note that these costs do not reflect the total costs of treating this condition. The report considers only the subset of total costs that are fully comparable between hospitals. For example, it excludes property, plant and equipment costs.
Figure 9: Average cost for heart failure with complications or comorbidities in major public hospitals, by length of stay, 2011–12
Sources: National Health Performance Authority analysis of results calculated using the National Hospital Cost Data Collection 2011–12 and Admitted Patient Care National Minimum Dataset 2011–12.
$0
Length of stay (in days)
Same day 1 2 3 4 5 6 7 8 9 10 11 12 13 14 15 16 17 $5,000 $10,000 $15,000 $20,000 $25,000
Figure 10: Average cost for kidney and urinary tract infections without complications or comorbidities in major public hospitals, by length of stay, 2011–12
Sources: National Health Performance Authority analysis of results calculated using the National Hospital Cost Data Collection 2011–12 and Admitted Patient Care National Minimum Dataset 2011–12. Kidney and urinary tract infections occur
frequently but can occasionally be severe enough to require treatment in hospital. The data presented here relate to costs incurred by a hospital for patients who were admitted for kidney or urinary tract infections without complications or comorbidities.
In 2011–12, there were 19,628 admissions for kidney and urinary tract infections without complications or comorbidities in major
metropolitan and major regional public hospitals. Across all major metropolitan hospitals, the average cost per admission for kidney and urinary tract infections without complications was $3,400. The average cost per admission ranged from $1,900 at one hospital to $5,600 at another hospital.
Across all major regional hospitals, the average cost per admission for kidney and urinary tract infections without complications was $3,800. The average cost per admission ranged from $2,500 at one hospital to $6,000 at another hospital.
A previous Authority report showed the average length of stay for kidney and urinary tract infections without complications in 2011–12 was 3.2 days.7 At major metropolitan hospitals,
the average length of stay for kidney and urinary tract infections without complications ranged from 2.0 to 4.4 days, and at major regional hospitals the average length of stay ranged from 2.2 to 4.5 days.7
Kidney and urinary tract infections
Without complications or comorbidities
By comparing the cost of a patient’s admission for kidney and urinary tract infections without complications to their length of stay it is possible to assess the incremental cost that each
additional day(s) spent in hospital contributes to the patient’s costs of care (Figure 10).
It is important to note that these costs do not reflect the total costs of treating this condition. The report considers only the subset of total costs that are fully comparable between hospitals. For example, it excludes property, plant and equipment costs.
$0
Length of stay (in days)
Same day 1 2 3 4 $1,000 $2,000 $3,000 $4,000 $5,000 $6,000
Figure 11: Average cost for kidney and urinary tract infections with complications or comorbidities in major public hospitals, by length of stay, 2011–12
Sources: National Health Performance Authority analysis of results calculated using the National Hospital Cost Data Collection 2011–12 and Admitted Patient Care National Minimum Dataset 2011–12. Kidney and urinary tract infections occur
frequently but can occasionally be severe enough to require treatment in hospital. The data presented here relate to costs incurred by a hospital for patients who were admitted for kidney or urinary tract infections with complications or comorbidities.
In 2011–12, there were 8,821 admissions for kidney and urinary tract infections with complications or comorbidities in major metropolitan and major regional public hospitals.
Across all major metropolitan hospitals, the average cost per admission for kidney and urinary tract infections with complications was $9,000. The average cost per admission ranged from $5,500 at one hospital to $14,600 at another hospital.
Across all major regional hospitals, the average cost per admission for kidney and urinary tract infections with complications was $10,000. The average cost per admission ranged from $7,200 at one hospital to $12,200 at
another hospital.
A previous Authority report showed the average length of stay for kidney and urinary tract infections with
complications in 2011–12 was 7.5 days.7
At major metropolitan hospitals, the average length of stay for kidney and urinary tract infections with complications ranged from 5.2 to 9.5 days, and at major regional hospitals the average length of stay ranged from 5.5 to 10.1 days.7
Kidney and urinary tract infections
With complications or comorbidities
By comparing the cost of a patient’s admission for kidney and urinary tract infections with complications to their length of stay it is possible to assess the incremental cost that each
additional day(s) spent in hospital contributes to the patient’s costs of care (Figure 11).
It is important to note that these costs do not reflect the total costs of treating this condition. The report considers only the subset of total costs that are fully comparable between hospitals. For example, it excludes property, plant and equipment costs.
$0
Length of stay (in days)
Same day 1 2 3 4 5 6 7 8 9 10 11 12 13 $2,000 $4,000 $6,000 $8,000 $10,000 $12,000 $14,000 $16,000
Figure 12: Average cost for a hip replacement without complications or comorbidities in major public hospitals, by length of stay, 2011–12
Sources: National Health Performance Authority analysis of results calculated using the National Hospital Cost Data Collection 2011–12 and Admitted Patient Care National Minimum Dataset 2011–12. Hip replacements, also known as hip arthroplasty,
are most commonly performed to restore joint function following damage caused by arthritis. The data presented here relate to costs incurred by a hospital for patients who were admitted for a hip replacement without complications
or comorbidities.
In 2011–12, there were 6,729 hip replacements without complications or comorbidities in major metropolitan and major regional public hospitals.
Across all major metropolitan hospitals, the average cost of a hip replacement was $19,400. The average cost of a hip replacement ranged from $12,500 at one hospital to $25,600 at another hospital.
Across all major regional hospitals, the average cost of a hip replacement was $18,900. The average cost of a hip replacement ranged from $12,000 at one hospital to $25,300 at another hospital. A previous Authority report showed the average length of stay for a hip replacement in 2011–12 was 6.4 days.7
At major metropolitan hospitals, the average length of stay ranged from 3.8 to 15.0 days, and at major regional
hospitals the average length of stay ranged from 3.2 to 9.6 days.7
Hip replacement
Without complications or comorbidities
By comparing the cost of a patient’s hip
replacement to their length of stay it is possible to assess the incremental cost that each additional day(s) spent in hospital contributes to the patient’s costs of care (Figure 12).
It is important to note that these costs do not reflect the total costs of this procedure. The report considers only the subset of total costs that are fully comparable between hospitals. For example, it excludes property, plant and equipment costs.
$0
Length of stay (in days)
Same day 1 2 3 4 5 6 7 8 9 10 $5,000 $10,000 $15,000 $20,000 $25,000
Figure 13: Average cost for a knee replacement without complications or comorbidities in major public hospitals, by length of stay, 2011–12
Sources: National Health Performance Authority analysis of results calculated using the National Hospital Cost Data Collection 2011–12 and Admitted Patient Care National Minimum Dataset 2011–12. Knee replacements, also known as knee
arthroplasty, are surgical procedures to replace a damaged knee, most commonly for arthritis. The data presented here relate to costs incurred by a hospital for patients who were admitted for a knee replacement without complications or comorbidities. In 2011–12, there were 5,613 knee replacements without complications or comorbidities in major metropolitan and major regional public hospitals.
Across all major metropolitan hospitals, the average cost of a knee replacement was $18,800. The average cost of a knee replacement ranged from $10,600 at one hospital to $29,300 at another. Across all major regional hospitals, the average cost of a knee replacement was $18,100. The average cost of a knee replacement ranged from $10,700 at one hospital to $22,600 at another hospital. A previous Authority report showed the average length of stay for a knee replacement in 2011–12 was 5.5 days.7
At major metropolitan hospitals, the average length of stay ranged from 3.3 to 8.7 days, and at major regional
hospitals the average length of stay ranged from 2.1 to 9.5 days.7
Knee replacement
Without complications or comorbidities
By comparing the cost of a patient’s knee
replacement to their length of stay it is possible to assess the incremental cost that each additional day(s) spent in hospital contributes to the patient’s costs of care (Figure 13).
It is important to note that these costs do not reflect the total costs of this procedure. The report considers only the subset of total costs that are fully comparable between hospitals. For example, it excludes property, plant and equipment costs.
$0
Length of stay (in days)
Same day 1 2 3 4 5 6 7 $2,500 $5,000 $7,500 $10,000 $12,500 $15,000 $17,500 $20,000
Figure 14: Average cost for gallbladder removal without complications or comorbidities in major public hospitals, by length of stay, 2011–12
Sources: National Health Performance Authority analysis of results calculated using the National Hospital Cost Data Collection 2011–12 and Admitted Patient Care National Minimum Dataset 2011–12. Gallbladder removal, or cholecystectomy, is a
surgical procedure generally performed to treat a patient with gallstones. The data presented here relate to costs incurred by a hospital for patients who were admitted for gallbladder removal without complications or comorbidities. In 2011–12, there were 13,034 admissions for gallbladder removal without complications or comorbidities in major metropolitan and major regional public hospitals.
Across all major metropolitan hospitals, the average cost of a gallbladder removal was $7,400. The average cost of a gallbladder removal ranged from $4,800 at one hospital to $13,000 at another. Across all major regional hospitals, the average cost of a gallbladder removal was $7,000. The average cost of a gallbladder removal ranged from $4,100 at one hospital to $11,700 at another. A previous Authority report showed the average length of stay for gallbladder removal in 2011–12 was 1.9 days.7 At
major metropolitan hospitals, the average length of stay ranged from 1.1 to 3.2 days, and at major regional
hospitals the average length of stay ranged from 1.4 to 2.6 days.7
Gallbladder removal
Without complications or comorbidities
By comparing the cost of a patient’s gallbladder removal to their length of stay it is possible to assess the incremental cost that each additional day(s) spent in hospital contributes to the patient’s costs of care (Figure 14).
It is important to note that these costs do not reflect the total costs of this procedure. The report considers only the subset of total costs that are fully comparable between hospitals. For example, it excludes property, plant and equipment costs.
$0
Length of stay (in days)
Same day 1 2 3 $2,000 $4,000 $6,000 $8,000 $10,000
Figure 15: Average cost for prostate removal without complications or comorbidities in major public hospitals, by length of stay, 2011–12
Sources: National Health Performance Authority analysis of results calculated using the National Hospital Cost Data Collection 2011–12 and Admitted Patient Care National Minimum Dataset 2011–12. Prostate removal is the surgical removal of all
or part of the prostate gland, most commonly performed through the urethra. The data presented here relate to costs incurred by a hospital for patients who were admitted for transurethral prostate removal without complications or comorbidities.
In 2011–12, there were 3,438 admissions for prostate removal without complications or comorbidities in major metropolitan and major regional public hospitals.
Across all major metropolitan hospitals, the average cost of prostate removal was $6,300. The average cost of prostate removal ranged from $4,700 at one hospital to $7,500 at another. Across all major regional hospitals, the average cost of prostate removal was $7,000. The average cost of prostate removal ranged from $5,200 at one hospital to $8,600 at another. A previous Authority report showed the average length of stay for prostate removal in 2011–12 was 2.7 days.7 At
major metropolitan hospitals, the average length of stay ranged from 1.9 to 3.9 days, and at major regional
hospitals the average length of stay ranged from 1.9 to 5.3 days.7
Prostate removal
Without complications or comorbidities
By comparing the cost of a patient’s prostate removal to their length of stay it is possible to assess the incremental cost that each additional day(s) spent in hospital contributes to the patient’s costs of care (Figure 15).
It is important to note that these costs do not reflect the total costs of this procedure. The report considers only the subset of total costs that are fully comparable between hospitals. For example, it excludes property, plant and equipment costs.
$0
Length of stay (in days)
Same day 1 2 3 $1,000 $2,000 $3,000 $4,000 $5,000 $6,000 $7,000
Figure 16: Average cost for vaginal delivery without complications or comorbidities in major public hospitals, by length of stay, 2011–12
Sources: National Health Performance Authority analysis of results calculated using the National Hospital Cost Data Collection 2011–12 and Admitted Patient Care National Minimum Dataset 2011–12. Around 300,000 children are born in Australia
each year,9 and about 70% of these births take
place in public hospitals. The data presented here relate to costs incurred by a hospital for patients who were admitted for vaginal delivery withou