1 INTRODUCTION
Cone penetration test (CPT) is widely used to interpret soil strength, deformability and hydraulic proper-ties. The standard penetration rate of 2 cm/sec usually results in a drained condition in coarse grained soils like sand, but an undrained condition in less permeable soils like clay. The effects of penetration rates on the test results have been investigated in a number of studies (e.g., Bemben & Myer 1974; Roy et al. 1982; Powell & Quarterman 1988; Randolph & Hope 2004; Chung et al. 2006; Kim et al. 2008; Lehane et al. 2009; Yi et al. 2012). The general observation is that the cone resistance decreases and the excess pore pressure (for example at shoulder position) increases with increasing penetration rate. The cone resistance and the excess pore pressure also seem to approach constant values in fully drained and fully undrained soils. Therefore, cone penetration tests with variable penetration rates in the same soil can thus provide additional information about the soil properties like permeability, or alternatively war-rant the desired draining condition when used to interpret the corresponding shear strength of soils with intermediate permeability values.
Numerical analysis of the CPT can improve the interpretation of test results. In this kind of exercise, both the soil behaviour and the soil response to a penetrating cone are known, and hence the link be-tween the two can be established, leading to interpretation of test results. However, such an analysis is extremely complex and challenging, mainly because of (1) the very large deformations and the associat-ed mesh size and mesh distortion problems, (2) the soil-cone interaction and the moving boundary, (3) the coupled displacement and pore pressure responses in the surrounding soil. Simulation of the full cone penetration process from the ground surface is important, as it alleviates the difficulty of defining the complicated stress and strain fields around the penetrating cone or the need of assuming appropriate strain paths or appropriate moving boundary in the soil. In the literature, however, only a limited num-ber of studies simulate the full penetration process (e.g., Sheng et al. 1997, 2005; Huang et al. 2004;
Numerical study of rate effects in cone penetration test
Daichao Sheng, Richard Kelly, Jubert Pineda and Lachlan Bates
Australian Research Council Centre of Excellence for Geotechnical Science and Engineering, The University of Newcastle, NSW 2308, Australia
ABSTRACT: The soil around a penetrating cone with the standard rate of 2 cm/sec could be fully drained, partially drained or fully undrained, depending on the permeability of the soil. Cone penetration tests with variable penetration rates in the same soil can thus provide additional information about the soil properties like permeability, or alternatively warrant the desired drainage condition when used to in-terpret the corresponding shear strength of soils with intermediate permeability values. In this paper, large deformation finite element analysis is used to study the effects of penetration rates on the cone re-sistance and excess pore pressure development. A rigid cone is pushed into a saturated soil by prescrib-ing different penetration rates. The soil is modeled with the Modified Cam Clay model, and the effective stress analysis is carried out in terms of displacements and pore pressures. The numerical results are then used to develop empirical relationships between cone resistance, pore pressure and penetration rate.
Obrzud et al. 2011; Yi et al. 2012). To study the rate effects, it is essential to consider the consolidation effects in the soil and hence a coupled displacement and pore pressure formulation is preferred. Sheng et al. (1997) used the commercial software Abaqus to simulate the penetration of a rigid cone into a sat-urated Modified Cam Clay soil and studied the stress and strain fields around the penetrating cone. They also studied the effect of soil permeability on the cone resistance, but not the effects of penetration rate (not at least systematically). Obrzud et al. (2011) more recently conducted similar finite element anal-yses and studied the partial drainage effects (amongst many other effects) by varying the soil permeabil-ity. Yi et al (2012) conducted a more systematical study of the effects of penetration rate in a saturated Drucker-Prager soil.
In this paper, large deformation finite element analysis is used to study the effects of penetration rate on the cone resistance and excess pore pressure. This study is very much a continuation of the work of Sheng et al. (1997), Obzrud et al. (2011) and Yi et al. (2012), but aims to a more systematic analysis of the effects of penetration rate in saturated soils. The Modified Cam Clay model (Roscoe & Burland 1968) is used to represent the effective-stress soil behavior in a coupled formulation of displacements and pore pressures, while the soil-cone interaction is represented by the latest contact formulation in Abaqus. The paper first presents the finite element model, including discussion on the mesh size effect and the material model and associated parameters. Detailed analysis of the effects of soil permeability and penetration rate on numerical results will then be discussed. The paper will also propose new rela-tionships between the cone resistance, maximum excess pore pressure, soil permeability and penetration rate, and these relationships will facilitate the interpretation of CPT results in partially drained soils. 2 FINITE ELEMENT MODEL
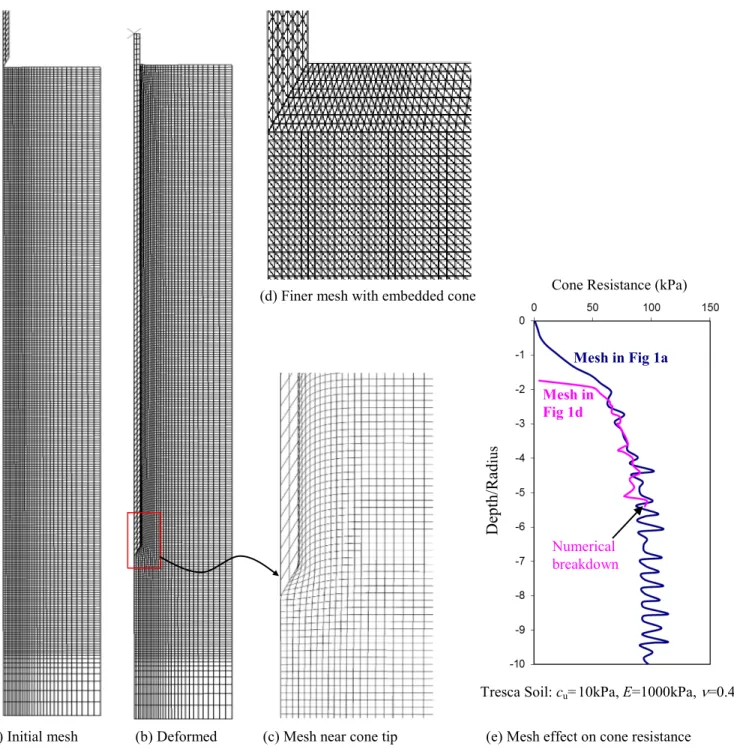
The finite element mesh used to obtain all the results in this paper is shown in Figure 1. Eight-noded quadrilateral elements with 4 integration points are used for the soil volume. The cone is treated as a rig-id body, while the soil behavior is represented by the Modified Cam Clay model. The soil-cone interface is modeled as frictional contact, using the segment to segment contact feature in Abaqus v6.10.1 (2010). The cone has a standard dimension (60o cone angle, 1.784cm in radius or 10cm2 in cross-section). The
soil domain is 16.82 times the radius in width and 112.17 times radius in depth. The top boundary of the soil domain is assumed to be fully drained (zero pore water pressure). A constant vertical stress of 50 kPa is also applied at this boundary. The left, right and bottom boundaries are assumed to be undrained (zero flux). The soil is fully saturated with an initially hydrostatic pore water pressure distribution. The nonlinear geometry due to large deformation is considered in all analyses.
As discussed in Sheng et al. (2009), the computed cone resistance is affected by the size of the mesh, but tends to converge to a finite value as the mesh is continuously refined. Finer meshes are however prone to numerical breakdown due to mesh distortion and convergence problems. The mesh shown in Figure 1a is possibly the finest one that can result in successful analysis of the penetration process, with-out any numerical enhancement such as mesh refinement. The finer mesh shown in Figure 1d can also lead to some successful analyses, but the cone has to be embedded into the soil initially and the Arbi-trary Lagrangian-Eulerian (ALE) method has to be applied at certain time steps to avoid mesh distortion. Even with the ALE method (Nazem et al. 2006; Sheng et al. 2009), the frequency for mesh update can only be found out by trial and error and the analysis broke down at small penetration depths (~5 shaft radius for the mesh in Figure 1d). The cone resistance in a Tresca soil computed with the finer mesh is about 5% lower than the one obtained with the coarse mesh in Figure 1a. The finer mesh does not work for the Modified Cam Clay soil. Sheng et al. (2013) used the same mesh as in Figure 1a to simulate cone penetration tests in Tresca (total stress analysis) and Modified Cam Clay (effective stress analysis) soils. The numerical results they obtained compare reasonably well with a wide range of field and la-boratory data.
Table 1. Parameters adopted for the MCC model.
e0 γt(kN/m3) ν κ λ M K0 k (m/s) pc (kPa) φ sc σ0 (kPa)
2.0 15.5 0.333 0.05 0.3 1.0 0.5 10-3 - 10-10 70 0 50
Note:e0: initial void ratio; ν: Poisson’s ratio; γt: total unit weight; λ: slope of normal compression line in e - lnp′ plot (p′ is the effective mean stress); κ: slope of unloading-reloading line in e - lnp′ plot; Μ: stress ratio at failure, qf/p′ (qf is the de-viator stress at failure); K0: at-rest earth pressure coefficient; k: hydraulic conductivity; pc: the size of the initial yield lo-cus; φsc : soil-cone interfacial friction angle; and σ0: the vertical stress applied at the top boundary.
(a) Initial mesh (b) Deformed (c) Mesh near cone tip (e) Mesh effect on cone resistance Figure 1. The finite element mesh used in the analyses (8-noded axi-symmetric quadrilateral elements).
Cone Resistance (kPa)
D ept h/ Ra d iu s
Tresca Soil: cu=10kPa, E=1000kPa, ν=0.4 Mesh in
Fig 1d
Mesh in Fig 1a
Numerical breakdown (d) Finer mesh with embedded cone
3 NUMERICAL RESULTS AND ANALYSIS 3.1 Cone Resistance
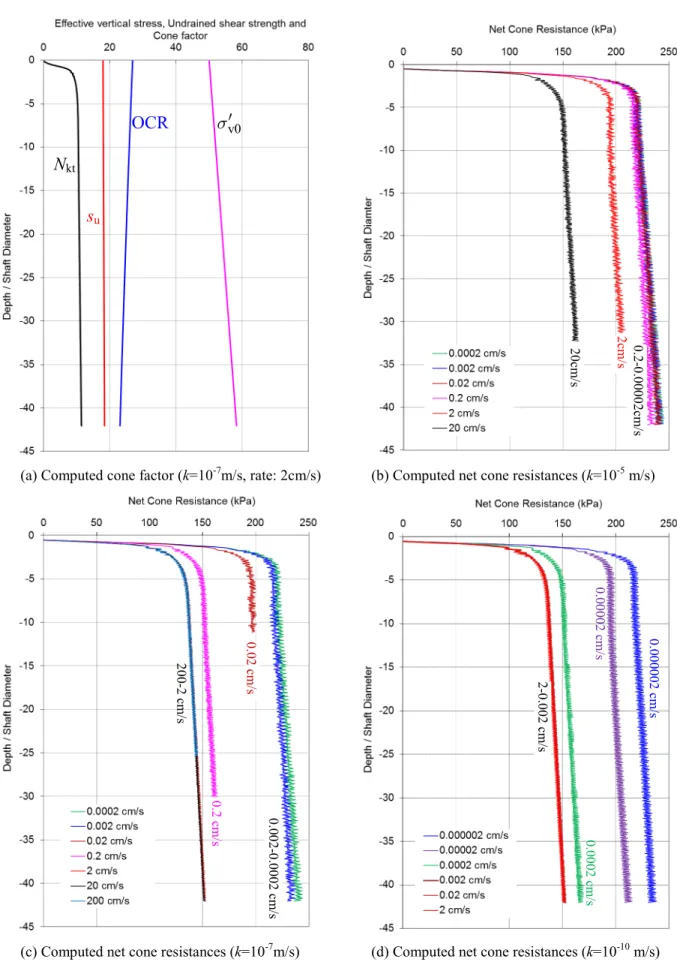
The computed cone resistances for various rates and soil permeabilities are shown in Figure 2. Figure 2a shows the computed cone factor versus depth for k=10-7 m/sec and a standard penetration rate (2
cm/sec). The cone factor is obtained by dividing the computed net cone resistance by the undrained shear strength. In the MCC model, the undrained shear strength is not a model parameter, rather an out-come of the effective stress path. Wroth (1984) derived the undrained shear strength under triaxial stress states using critical state parameters and the over-consolidation ratio:
u M OCR2 2 v0 s λ κ λ σ − ′ = (1)
where M is the slope of the critical state line and is assumed to be a constant, OCR is the over-consolidation ratio, λ and κ are the slope of the normal compression line and the unloading-reloading line respectively, and σv0′ is the initial vertical effective stress in the soil and is computed from the
effec-tive unit weight of the soil and the applied vertical stress at the surface. In the soil profile studied here, the preconsolidation stress is fixed over depth (70 kPa), and so is the lateral earth pressure coefficient (Ko=0.5). As the initial vertical stress increases, the over-consolidation ratio (OCR) decreases with
depth. As such, the variation of undrained shear strength with depth is not significant (Figure 2a). Figure 2b, 2c and 2d show the computed cone resistances for soil permeability of 10-5 m/sec, 10-7
m/sec and 10-10 m/sec, respectively. Some general observations can be made from these figures:
- The computed cone resistance seems to reach a steady state value at the depth of about 5 shaft diame-ters, even though the undrained shear strength and effective vertical stress in the MCC soil change with depth. Unlike in a Tresca-type material, the steady state cone resistance in the MCC soil in-creases linearly with depth.
- The computed cone resistance increases with decreasing penetration rate or increasing soil permeabil-ity. Unlike the results reported by Yi et al. (2012) for a Drucker-Prager soil, the penetration rate only affects the steady state cone resistance in the MCC soil. In other words, the computed cone resistance profiles at two different rates are parallel to each other in the MCC soil. On the other hand, Yi et al. (2012) reported that the slope of the cone resistance profile (resistance per unit depth) increases with decreasing penetration rate in Drucker-Prager soil.
- The computed cone resistance seems to vary between two limiting values, one for small rate and the other for large rate. The specific rates where the limiting cone resistance is reached vary with the soil permeability.
- Numerical breakdowns have occurred in a number of analyses. The targeted penetration depth is about 42 shaft diameters. All curves in Figure 2 that are shorter than this depth mean numerical breakdown. There is no particular rule when and where the numerical breakdown occurs, indicating the challenges of this type of analysis.
Randolph & Hope (2004) proposed the following normalisation of the penetration rate:
v
vD V
c
(2)
where v is the penetration rate, D is the shaft diameter, cv is the consolidation coefficient. For a MCC
soil, the consolidation coefficient is not a constant, but depends on the stress level in the soil:
v v w (1 ) k e c (3)
where w is the unit weight of water and v is the effective vertical stress in the soil (assuming the soil around the cone is consolidated vertically). Because the change in the vertical stress (v) during the cone
OCR
su Nkt
v0
Figure 2. Computed net cone resistances at various rates and permeabilities.
(a) Computed cone factor (k=10-7m/s, rate: 2cm/s) (b) Computed net cone resistances (k=10-5 m/s)
(c) Computed net cone resistances (k=10-7m/s) (d) Computed net cone resistances (k=10-10 m/s)
20 cm /s 2cm /s 0.2-0. 00 002c m /s 0.0 2 cm /s 0.00 2-0. 000 2 cm /s 2-0. 00 2 cm /s 0. 000 2 c m /s 0. 000 02 cm /s 0.000 00 2 c m /s 200 -2 cm /s 0.2 cm /s
penetration is not easy to determine, it is difficult to use the exact normalisation method defined by equation (2). In this paper, the penetration rate is simply normalised against the soil permeability. Such a normalisation also provides a more direct relationship between the cone resistance and the soil permea-bility and hence facilitates the direct determination of the soil permeapermea-bility.
The computed cone resistance is normalised according to (Randolph & Hope 2004):
t v0 n ref v0 q q q (4)
where qt is the cone resistance and qref is the reference cone resistance or the fully undrained cone
re-sistance. In this paper the steady state cone resistances at the depth of 10 shaft diameters is used for analysis.
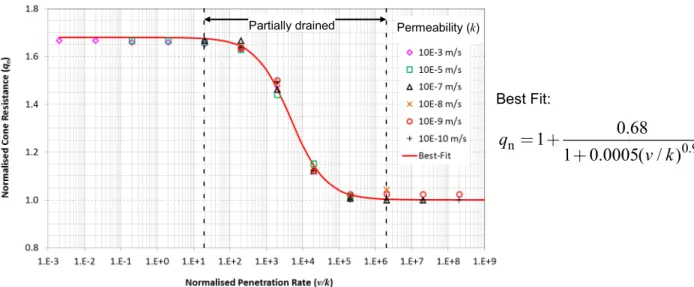
The normalised cone resistance is plotted against the normalised penetration rate in Figure 3, for a wide range of permeability and rate values. The figure shows that the computed cone resistances fall on the same backbone curve irrespective of the soil permeability values and this curve is bounded by two limiting values, one for drained condition at small penetration rates and the other for undrained condi-tion at large penetracondi-tion rates. The drained cone resistance is achieved when the penetracondi-tion rate is less than 10 times the soil permeability, while the undrained value is reached when the penetration rate is 106
times the soil permeability or larger. According to this figure, the standard penetration rate of 2 cm/sec will warrant a fully undrained condition for a soil with a permeability of 2x10⁻⁸ m/sec or less, and a fully
drained condition for a soil with a permeability of 2x10⁻³ m/sec or larger. It would be interesting to check if these limiting values are affected by other soil properties such as compressibility and strength.
Robertson (2010) suggested that the standard penetration is undrained if t50 is less than 30 seconds.
The coefficient of consolidation (ch) corresponding to this limiting value can be approximated as
6
1 log50 6 2h 1.67 10 10 t 0.56 10 m /s
c
The corresponding permeability can be estimated according to Robertson (2009, 2010):
2 8
h ( h w) / ( h w) v0/ ( t v0) 1.6 10 m/s
k c M c q
where M is the one-dimensional constrained modulus and is usually in the order of 102-103 kPa. The
ini-tial vertical stress is around 50 kPa, and the net cone resistance at 10 shaft diameters is around 130 kPa (Figure 2c-2d). The permeability estimated from the above equation compares very well with the limit-ing value for undrained penetration shown in Figure 3.
Figure 3. Normalised cone resistance versus normalised penetration rate. Permeability (k) Partially drained Best Fit: n 1 0.68 0.9 1 0.0005( / ) q v k
The pattern of the backbone curve in Figure 3 is consistent with those reported by Randolph & Hope (2004), Chung et al. (2006), Kim et al. (2008), Lehane et al. (2009) and Yi et al. (2012). In fact, the best fit curve in Figure 3 is of the same form as suggested by Randolph & Hope (2004):
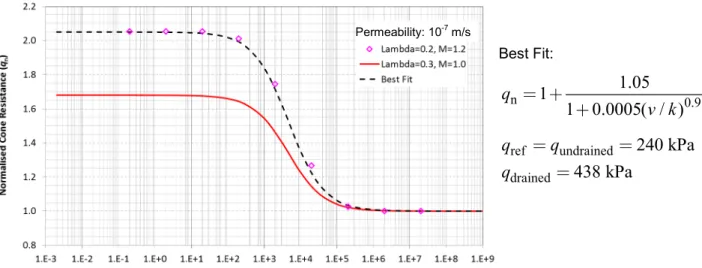
1 n 1 1 / m b q c v k (5)However, the value of b in Figure 3, which indicates the difference between the drained and undrained net cone resistances, is significantly less than those reported by Randolph & Hope (2004), Kim et al. (2008) and Lehane et al. (2009). One possible reason for this low b value is the high compressibility of the soil. Indeed, if the values for λ, κ and M in Table 1 are changed to 0.2, 0.03 and 1.2, respectively, the undrained and drained cone resistances increase to 240 kPa and 438 kPa respectively. The b value thus increases to 1.05 from 0.68, while the values of c and m1 do not change, Figure 4. Further studies
are required to confirm if and how variables b, c and m1 in the backbone curve vary with soil
compressi-bility and strength.
3.2 Maximum Pore Pressure
The penetration rate will also affect the excess pore pressure development in the soil. Figure 5 shows the computed pore pressures at different locations relative to the cone tip for various values of soil per-meability and penetration rate. Some general observations can be made from the figure:
- As the cone tip passes the observation point, a peak excess pore pressure develops, particularly at high penetration rates. The specific location of the peak excess pore pressure is about 2-3 diameter above the cone tip, or close to the so-called u2 (cone shoulder) position.
- A negative excess pore pressure can occur just below the cone tip for very high penetration rates. - The pore pressures don’t fully recover the initial values even for fully drained conditions. In the case
of fully drained tests (for example, rates of 2cm/sec and lower in Figure 5a), the pore pressure in-creases somewhat as the cone passes through the observation point. This small increase is due to the vertical displacement of the observation point, namely the observation point is pulled downwards somewhat by the penetrating cone (see Figure 1c).
- The computed pore pressures experience significant oscillations around the cone shoulder position, particularly for fast penetration in low permeable soils (Figures 5c-d). In a number of analyses, the computed pore pressures change from a high positive value to a high negative value, another cause for numerical breakdown.
Figure 4. Effect of soil compressibility and strength on normalised cone resistance. Permeability: 10-7 m/s Best Fit: n 1 1 0.0005( / )1.05 0.9 q v k
ref undrained 240 kPa
q q
drained 438 kPa
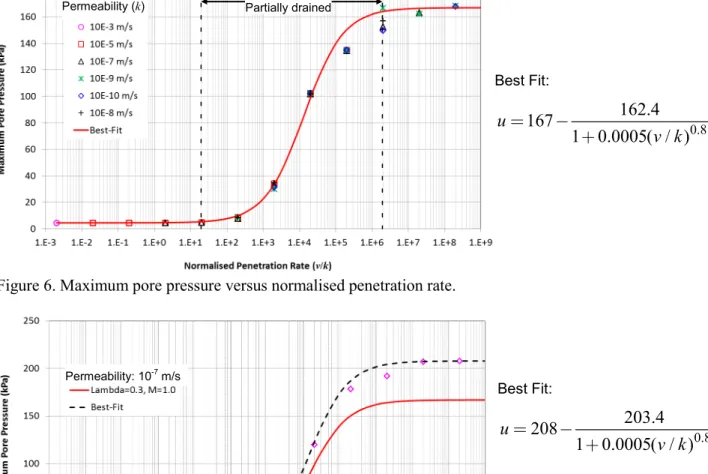
The observed maximum pore pressures for various permeability and rate values are plotted against the normalised penetration rate in Figure 6. Again, all computed pore pressure values seem to fall on the same curve, irrespective of permeability and rate values. The curve has a similar shape as the backbone curve for the cone resistance (Figure 3). However, because of the oscillation in the computed pore pres-sures, the data points in Figure 6 are more scattered, particularly for the partially drained and undrained conditions. The best fit for the curve in Figure 6 is
2 ud d ud 1 ( / )m u u u u c v k (6)
where u is the maximum pore pressure at u2 position, uud is the maximum pore pressure in fully
un-drained condition and ud is the maximum pore pressure in fully drained condition.
Parameter c in equations (5) and (6) controls the location of the transition zone (partially drained), and as such it has the same value in both equations. Parameters m1 and m2 in the two equations control
the slope of the transition zone and can have different values as the two backbone curves are not noma-lised to the same values on the vertical axes. The soil compressibility and shear strength parameters seem only to affect the undrained maximum pore pressure, not the drained pore pressure or the shape of the backbone curve. Figure 7 compares two backbone curves obtained with different λ, κ and M values. More detailed studies of the effect of soil compressibility and shear strength parameters are required.
(a) Soil permeability of 10-3 m/sec (b) Soil permeability of 10-5 m/sec
(c) Soil permeability of 10-7 m/sec (d) Soil permeability of 10-9 m/sec Figure 5. Maximum pore pressure at various rates and permeabilities.
Rate (v)
Rate (v)
Rate (v) Rate (v)
35 kPa
The application of the backbone curves given by equations (5) and (6) is at least two-fold: to warrant a desired drainage conditions and to facilitate the estimation of the soil permeability. There are 9 pa-rameters involved in the two equations: qref, v0, uud, ud, b, c, m1, m2 and k. The initial vertical effective
stress (v0) is relative easy to estimate and can be eliminated, leaving four unknowns. The maximum pore pressure for a fully undrained condition can also be estimated from cavity expansion theory (Chen & Abousleiman 2012) or empirical relationship (Mayne 2001). Each piezocone test will generate both pore pressure (at u2 position) and cone resistance data. Therefore, we need four tests with four different
penetration rates to fully determine the two backbone curves and the soil permeability (k). Once these backbone curves are determined, we also know the cone resistances and the maximum pore pressure for fully drained and fully undrained conditions (b and qref, uud and ud).
4 CONCLUSIONS
This paper presents a numerical study on the rate effects of cone penetration tests in a Modified Cam Clay soil. Some conclusions can be drawn from the study:
(1) A simple normalisation method where the penetration rate is divided by the soil permeability seems to be able to capture the rate effects.
Permeability (k) Partially drained
Figure 6. Maximum pore pressure versus normalised penetration rate.
Best Fit: 0.8 162.4 167 1 0.0005( / ) u v k
Figure 7. Effects of soil compressibility and shear strength on maximum pore pressure. Best Fit: 0.8 203.4 208 1 0.0005( / ) u v k Permeability: 10-7 m/s
(2) The normalised cone resistance seems to fall on a unique backbone curve when plotted against the normalised penetration rate. The equation for this backbone curve involves two limiting values repre-senting respectively the drained and undrained cone resistances, and two additional fitting parameters.
(3) The maximum pore pressure at u2 position during the penetration process seems to fall on a
unique backbone curve when plotted against the normalised penetration rate. The equation for this curve takes the same form as that for the normalised cone resistance and involves the limiting values in fully drained and fully undrained soils as well as two additional fitting parameters.
(4) The numerical data obtained from various penetration rate and permeability values seem to follow the hyperbolic equation proposed by Randolph and Hope (2004), with the penetration rate normalised against the soil permeability.
(5) The soil compressibility and shear strength parameters seem to affect only the limiting values of the backbone curves, not the shape of the curve or the location of the partially drained zone. Further studies on this aspect are required though.
(6) The equations for the backbone curves can be used to warrant a desired drainage conditions for CPT in an intermediate soil and to facilitate the estimation of the soil permeability from CPT.
REFERENCES
Bemben, S. M. & Myers, H. J. (1974). The influence of rate of penetration on static cone resistance in Connecticut river val-ley varved clay. Proceedings of the European Symposium on Penetration Testing, Stockholm, Sweden, Vol. 2.2, pp. 33– 34.
Chen, S.L. & Abousleiman, Y.N. (2012). Exactly undrained elasto-plastic solution for cylindrical cavity in modified Cam clay soil. Geotechnique 62, No. 5, 447-456.
Chung, S. F., Randolph, M. F. & Schneider, J. A. (2006). Effect of penetration rate on penetrometer resistance in clay. Jour-nal of Geotechnical and Geoenvironmental Engineering ASCE 132, No. 9, 1188–1196.
Huang, W., Sheng, D., Sloan, S. W. & Yu, H. S. (2004). Finite element analysis of cone penetration in cohesionless soil. Computers and Geotechnics 31, No. 7, 517–528.
Kim, K., Prezzi, M., Salgado, R. & Lee, W. (2008). Effect of penetration rate on cone penetration resistance in saturated clayey soils. Journal of Geotechnical and Geoenvironmental Engineering ASCE 134, No. 8, 1142–1153.
Lehane, B.M., O’Loughlin, C.D., Gaudin, C. & Randolph, M.F. (2009). Rate effects on penetration resistance in kaolin. Ge-otechnique 59, No. 1, 41-52.
Mayne, P.W. (2001). Stress-strain-strength-flow parameters from enhanced in-situ tests. Proc. Int. Conf. on In-Situ Meas-urement of Soil Properties & Case Histories (In-Situ 2001), Bali, Indonesia, May 21-24, 2001, pp. 27-48.
Nazem, M., Sheng, D. & Carter, J.P. (2006). Stress integration and mesh refinement for large deformation in geomechanics. International Journal for Numerical Methods in Engineering 65: 1002-1027.
Obrzud, R.F., Truty, A. & Vulliet, L. (2011). Numerical modelling and neural networks to identify parameters from piezo-cone tests: I. FEM analysis of penetration in two-phase continuum. International Journal for Numerical and Analytical Methods in Geomechanics 35: 1703-1730.
Powell, J. J. M. & Quarterman, R. S. T. (1988). The interpretation of cone penetration tests in clays, with particular reference to rate effects. Proc. 1st Int. Symp. on Penetration Testing, Orlando, FL 2, 903–909.
Randolph, M. F. & Hope, S. (2004). Effect of cone velocity on cone resistance and excess pore pressures. Proc. 1st Int. Symp.
on Engineering Practice and Performance of Soft Deposits,Osaka, 147–152.
Robertson, P.K. (2009). CPT interpretation – a unified approach, Canadian GeotechnicalJournal 46, 1-19.
Robertson, P.K. (2010). Estimating in-situ soil permeability from CPT & CPTu. Proc. 2nd Int. Symp. on Cone Penetration Testing, Huntington Beach, CA, USA, www.cpt10.com
Roy, M., Tremblay, M., Tavenas, F., & Rochelle, P. L. (1982). Development of pore pressure in quasistatic penetration tests in sensitive clay. Canadian Geotechnical Journal 19(2), 124–138.
Sheng, D., Axelsson, K. & Magnusson, O. (1997). Stress and strain fields around a penetrating cone. Proc. 6th Int. Symp. on
Numerical Models in Geomechanics (NUMG-VI), Montreal, 456–465.
Sheng, D., Eigenbrod, K.D. & Wriggers, P. (2005). Finite element analysis of pile installation using large slip frictional con-tact. Computers and Geotechnics 32: 17-26.
Sheng, D., Nazem, M. & Carter, J.P. (2009). Some computational aspects for solving deep penetration problem in geome-chanics. Computational Mechanics 44(4): 549-561.
Sheng, D., Cui, L. & Ansari, Y. (2013). Interpretation of cone factor in undrained soils using full-penetration finite element analysis. International Journal of Geomechanics ASCE 13, No. 6, 1-9, doi: 10.1061/(ASCE)GM.1943-5622.0000279. Yi, J.T., Goh, S.H., Lee, F.H. & Randolph, M.F. (2012). A numerical study of cone penetration in fine-grained soils allowing