ESSAYS ON EARNINGS GUIDANCE
A Dissertation
Presented to the Faculty of the Graduate School of Cornell University
in Partial Fulfillment of the Requirements for the Degree of Doctor of Philosophy
by Ihwa Yang
ESSAYS ON EARNINGS GUIDANCE Ihwa Yang, Ph.D.
Cornell University 2010
The first chapter of this dissertation examines the association between guidance frequency, guidance properties, and market reactions. The results suggest that the characteristics and market responses to guidance issued by occasional and frequent guiders differ. Compared to occasional guiders, frequent guiders issue guidance in a timelier manner and their guidance issuances are less optimistically biased, more accurate, and more precise. Controlling for the amount of news issued, the market reaction to guidance issued by frequent guiders is more positive for good news and less negative for bad news, consistent with market awareness of the
differences in guidance properties between frequent and occasional guiders. Overall, the results are consistent with frequency being an important classificatory variable. The second chapter examines whether investors and analysts recognize differences in individual managers’ guidance accuracy and bias, and if they tailor their responses to management guidance. The results suggest that investors react more strongly and assign more credibility to managers who have greater guidance accuracy, and that investors adjust for guidance bias by reacting more positively (less negatively) to good (bad) news guidance issued by managers who are more pessimistic. However, the results for the changes in analysts’ consensus forecasts suggest that analyst experience plays an important role in their responses to management guidance. I find that in their forecast revisions, analysts adjust for managers’ guidance accuracy and bias only if the analysts themselves have sufficient forecasting experience.
BIOGRAPHICAL SKETCH
Holly Yang is Assistant Professor of Accounting at the Wharton School of Business at the University of Pennsylvania. She received her Ph.D. from Cornell University, Master of Accounting from the University of Michigan, and B.B.A. from the National Taiwan University. Her research interests include voluntary disclosures, individual biases, and their joint effect on capital markets. She has taught Introductory Accounting to graduate students at Cornell University and currently teaches
Intermediate Accounting to undergraduate students at the University of Pennsylvania. Holly is a native speaker of English, Mandarin, and Taiwanese. She enjoys running, cooking, and travelling with her fiancée in her free time.
ACKNOWLEDGMENTS
First and foremost, I would like to thank my dissertation chair, Sanjeev Bhojraj, for his continuous guidance and support. Sanjeev is one of the best mentors one could possibly have because he gives his advisees abundant freedom to explore and engage in interesting topics, yet at the same time steers them towards the right direction to pursue meaningful projects. I am extremely grateful to have had the privilege to be his advisee and co-author and will always be indebted to him for his investment in my academic career. I would also like to thank my co-authors Paul Hribar and Bob Libby. Their wealth of knowledge, constant support, and constructive criticism have also been pivotal to the accomplishment of this dissertation. Special thanks to my dissertation committee members, Julia D’Souza, Hazem Daouk, and Ming Huang, for their insightful comments and helpful suggestions.
I cannot thank my family enough for all they have done for me throughout my life. This dissertation would not be possible without their continual support and belief in me. I am also thankful to my fellow doctoral students including Flora Zhou, Nick Seybert, Kristi Rennekamp, and Young-Jun Cho. I am certain that the friendships we have developed during our time in the program will be one of my most valuable assets in my academic career. Last, but not least, Dedo, I would like to thank you for being who you are to me. Your love and words of encouragement have provided so much hope and courage and I hope that I can be as much for you as you are to me.
TABLE OF CONTENTS
BIOGRAPHICAL SKETCH ... iii
ACKNOWLEDGMENTS ... iv
TABLE OF CONTENTS ... v
LIST OF FIGURES ... vii
LIST OF TABLES ... viii
CHAPTER ONE: ANALYZING GUIDANCE AT THE FIRM LEVEL: THE ASSOCIATION BETWEEN GUIDANCE FREQUENCY, GUIDANCE PROPERTIES, AND MARKET REACTIONS ... 1
Abstract ... 1
1. Introduction ... 2
2. Prior Research and Empirical Predictions ... 6
2.1. Guidance Frequency, Guidance Properties and Market Response ... 6
2.2. Guidance Frequency and Learning ... 9
3. Sample Selection ... 11
4. Variable Definitions and Descriptive Statistics ... 14
4.1. Measures of Guidance Properties ... 14
4.2. Measures of Market Response ... 14
4.3. Explanatory and Control Variables ... 15
4.4. Descriptive Statistics ... 17
5. Guidance Frequency, Guidance Properties, and Market Response ... 24
6. Learning over Time within Firms ... 29
6.1. Heckman Two-Stage Estimation ... 29
6.2. Matched Sample Analysis ... 31
7. Additional Analyses ... 35
7.1. Firm-Quarter Rolling Period Analysis and Learning ... 35
7.2. Alternative Sample Selection Specifications ... 42
7.3. Analysis Using Medians ... 43
8. Summary ... 43
APPENDIX ... 45
REFERENCES ... 46
CHAPTER TWO: THE EFFECTS OF MANAGERS’ GUIDANCE CREDIBILITY ON INVESTORS AND ANALYSTS ... 50
Abstract ... 50
1. Introduction ... 51
2. Prior Literature and Hypothesis Development ... 55
2.1. Manager Effects on Earnings Guidance ... 55
2.2. Investors’ and Analysts’ Reactions to Guidance ... 57
3. Data and Research Design ... 59
3.1. Sample Construction ... 59
3.2. Research Design ... 60
4. Descriptive Statistics ... 63
5.1. Manager Effects on Guidance ... 66
5.2. Market Reaction to Guidance and Managers’ Guidance Behavior ... 69
5.3. Change in Analysts’ Consensus Forecasts and Managers’ Guidance Behavior ... 71
5.4. Analyst Forecasting Experience and Managers’ Guidance Behavior ... 72
6. Additional Analyses ... 75
6.1. Alternative Proxy for Managers’ Guidance Behavior ... 75
6.2. Annual Guidance ... 76
7. Conclusion ... 76
LIST OF FIGURES
Figure 1.1. Rolling Period Analysis of Differences in Guidance Properties between Frequent and Infrequent Guiders ... 33
LIST OF TABLES
Table 1.1. Distribution of Management Guidance 1995-2005 ... 12
Table 1.2. Guidance Frequency and Firm Characteristics ... 20
Table 1.3. Descriptive Statistics of Guidance Properties ... 23
Table 1.4. Guidance Frequency and Guidance Properties (Means) ... 27
Table 1.5. Heckman Two-Stage Estimation of the Trends in Guidance Properties ... 32
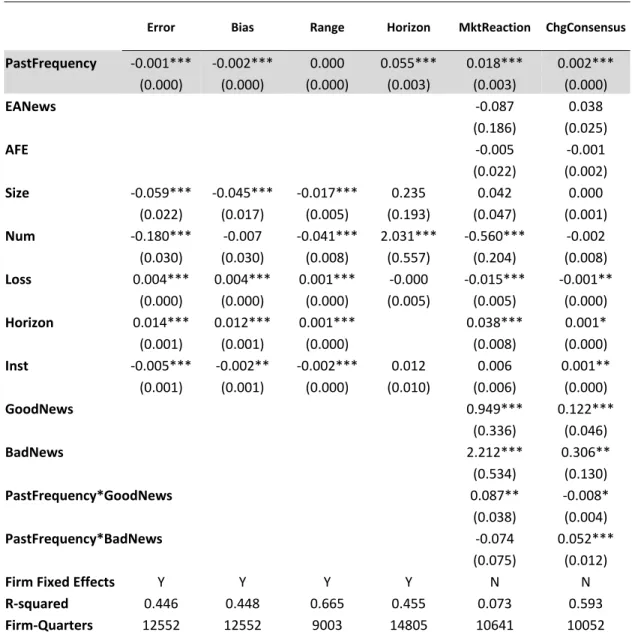
Table 1.6. Past Guidance Frequency and Guidance Properties ... 37
Table 1.7. Robustness Test: Post 1998 Data ... 39
Table 1.8. Robustness Test: Full Sample ... 40
Table 1.9. Guidance Frequency and Guidance Properties (Medians) ... 41
Table 2.1. Frequency of Manager Changes ... 64
Table 2.2. Descriptive Statistics ... 65
Table 2.3. Manager Fixed Effects ... 68
Table 2.4. Does the Market Recognize the Manager Fixed Effects on Guidance? ... 70
Table 2.5. Do Analysts Recognize the Manager Fixed Effects on Guidance? ... 71
CHAPTER ONE:
ANALYZING GUIDANCE AT THE FIRM LEVEL:
THE ASSOCIATION BETWEEN GUIDANCE FREQUENCY, GUIDANCE PROPERTIES, AND MARKET REACTIONS
Abstract
This paper argues that frequent guiders are likely to represent a class or type of firm that commits to increased levels of disclosure and therefore have different
incentives and processes that affect the properties of the guidance, its market impact, and learning over time. Using earnings guidance data from Thomson First Call, we rank firms into quintiles based on guidance frequency and examine guidance
properties and market participants’ responses across different frequency groups. Our results suggest that the characteristics and market responses to guidance issued by occasional and frequent guiders differ. Compared to occasional guiders, frequent guiders issue guidance in a timelier manner and their guidance issuances are less optimistically biased, more accurate, and more precise. Controlling for the amount of news issued, we also find that the market reaction to guidance issued by frequent guiders is more positive for good news and less negative for bad news, consistent with market awareness of the differences in guidance properties between frequent and occasional guiders. Frequent guiders also display improvements over time in guidance accuracy, bias, and timeliness, that are consistent with a better understanding of the guidance process. Overall, our results are consistent with frequency being an important classificatory variable.
Key Words: Earnings Guidance, Management Forecasts, Guidance Frequency, Learning
1. Introduction
Prior research has examined several aspects of earnings guidance including factors that influence the propensity to issue guidance, properties of the guidance issued, analysts’ and market responses to guidance, and reasons why firms stop issuing guidance.1,2 Little is known, however, about the extent to which a firm’s overall propensity to issue guidance is related to the properties of the guidance issued and the market’s reaction to the guidance. In this paper, we argue that guidance frequency is an important classificatory variable. Frequent guiders are likely to
represent a class or type of firms that commit to increased levels of disclosure through their guidance (Leuz and Verrecchia 2000; Brown, Hillegeist and Lo 2004) and therefore have different incentives and processes that affect the properties of the guidance, its market impact, and learning over time. Classifying based on guidance frequency also furthers our understanding of some of the results documented in prior studies.
While prior research is silent on the link between the quantity and quality of the respective disclosures, our empirical results suggest that there is a significantly positive association between the two constructs. We find that firms that guide more frequently provide guidance earlier in the period, with lower error, less optimistic bias, and more precision than occasional guiders.3 Similar to firms that commit to increased levels of disclosure independent of the content of the news, we also find that frequent
1
We define earnings guidance as all management earnings forecasts issued after the start of a fiscal quarter and before the earnings announcement.
2
See Venkataraman, Koonce, and Hirst (2008) for a recent review of the literature on management earnings forecasts.
3
We define precision as the range-width of guidance and specificity as an ordinal variable that gives the highest value to the most specific guidance form. Point, range, open-ended, and qualitative guidance are coded as 4, 3, 2, and 1, respectively.
guiders issue guidance when news is more positive compared to occasional guiders.4 Our results are robust to a regression analysis that includes firm fixed effects and variables associated with firm maturity. While several firm characteristics such as size, litigation risk, analyst following, profitability, and institutional ownership are
significantly related to guidance frequency, the signs of many of the effects run counter to the argument that the stability that comes with firm maturity accounts for the differences noted above.
Also similar to firms that commit to increased levels of disclosure so as to reduce their cost of capital (Leuz and Verrecchia 2000; Brown et al. 2004), we find that markets react differently to guidance issued by frequent guiders. Controlling for the amount of news issued, we show that the market reaction to guidance issued by frequent guiders is more positive for good news and less negative for bad news. This is consistent with market awareness of our findings that occasional guiders tend to issue more optimistic and less accurate guidance as compared with frequent guiders.
The discussion so far has focused on what can be gleaned by comparing frequent guiders to occasional guiders. Research in economics (Arrow 1962), psychology (Einhorn and Hogarth 1978), and management (Huber 1991; Zollo and Winter 2002) finds that individuals and organizations learn through experience when frequency and immediacy of feedback are high. Earnings guidance provides a setting where immediacy of feedback is high (based on market response to actual earnings). In addition, the “Learning-by-Doing” (LBD) model assumes that the marginal cost of performing a task decreases as the cumulative experience with the task increases. The learning that occurs can take on several forms including learning to self-select out of
4
We also find that 48% of the guidance issued by frequent guiders was in periods of bad news as compared with 60% for the occasional guiders. This suggests that frequent guiders are willing to guide independent of the nature of news, which is consistent with a commitment to disclose. Occasional guiders, on the other hand, guide in periods of bad news.
guidance disclosure (Chen, Matsumoto, and Rajgopal 2007; Feng and Koch 2008; Houston, Lev, and Tucker 2009), learning the parameters of the underlying process that generates the estimates, gaining a better understanding of the flexibility in their accounting system to meet announced guidance numbers, and gaining a better understanding of the market’s expectation in terms of the properties and timing of guidance.5
While all these forms of learning suggest that the properties of guidance should improve over time for frequent guiders, we carry out analyses to examine if firms display learning beyond that implied by the first form of learning, self-selection. We carry out two kinds of analyses. We first use the traditional Heckman two-stage selection model to control for the form of learning that causes firms to stop reporting. The results reported in section five suggest that at least part of the results we find on frequent guiders is attributable to the type of learning that occurs as a result of a better understanding of the guidance process. While we control for factors associated with firm maturity in the analysis, to the extent that the controls are imperfect, it is possible that firm maturation is a contributor to our results.
We also conduct a matched sample analysis by comparing guidance issued by frequent guiders to guidance issued by occasional guiders over time. Using a matched sample approach also controls for learning that can occur in the absence of public disclosure of guidance (the occasional guiders act as the benchmark for internal
5
While firms that refrain from issuing public guidance still have internal targets and opportunities to improve the quality of their guidance over time, we argue it is not the same as issuing guidance. First, they do not receive feedback from market participants’ responses about the costs and benefits of guidance, which is our main motivation for examining analysts’ and market reactions to guidance. Second, if public issuance of guidance affects the benefits from higher quality guidance, it should cause more resources to be invested in the guidance generation and disclosure process. Third, learning about the flexibility of the accounting system to meet guidance estimates could be more muted in the absence of a publicly issued guidance. To control for learning that occurs even in the absence of public
disclosure of guidance, we examine properties of guidance of frequent guiders adjusted for properties of guidance issued by occasional guiders.
learning). Consistent with the effect of learning, we continue to find that guidance issued by frequent firms becomes more accurate, less optimistically biased, and more timely. Interestingly, the results of this analysis suggest that, contrary to the self-selection hypothesis, the frequent guiders are less accurate compared to the occasional guiders in their early guidance attempts. This finding suggests that the frequent
guiders are not simply those that were successful in their early guidance and points more to a commitment or policy to guide.
In addition to the effect on guidance properties, market response and learning, we find that classifying firms based on guidance frequency helps to shed more light on some of the empirical evidence documented in prior studies. For example, early work in guidance found that firms are more likely to issue good news guidance (e.g. Patell 1976; Penman 1980; Lev and Penman 1990) while more recent work has documented a greater likelihood of guidance in the face of bad news (e.g., Francis, Philbrick, and Schipper 1994; Skinner 1994; Kasznik and Lev 1995; Skinner 1997). Our results show that frequent guiders are more likely to guide independent of the news while
occasional guiders are more likely to guide in periods of bad news. Frequent guiders are also less likely to report losses, more likely to meet or beat analysts’ consensus forecasts, and have higher ROAs, thereby indicating the bad news hypothesis is more applicable to occasional guiders. Similarly, while some studies provide evidence that guidance issuance reduces bid-ask spreads and analyst dispersion (Coller and Yohn 1997; Clement, Frankel, and Miller 2003), others suggest that management guidance on average, increases investor uncertainty (Baginski, Conrad, and Hassell 1993; Rogers, Skinner and Van Buskirk 2009). Our results suggest that analyst dispersion is lower, on average, for firms that guide frequently and that investors and analysts respond more to their guidance issuances.
The rest of the paper is organized as follows. Section two discusses the background literature and develops the empirical predictions. Section three describes the data and sample selection. Section four defines the variables and provides
descriptive statistics while section five provides the results of the association tests between guidance frequency and guidance properties. Section six examines whether firms exhibit learning in the properties of the guidance issued. Section seven discusses the additional analyses while section eight summarizes the paper.
2. Prior Research and Empirical Predictions
2.1. Guidance Frequency, Guidance Properties and Market Response
Following Leuz and Verrecchia (2000) and Brown et al. (2004), we argue that firms commit to a higher level of disclosure to benefit from decreases in information asymmetry. Using frequency of conference calls as an indicator of an ex ante policy of enhanced disclosure, Brown et al. (2004) find that greater call frequency results in lower information asymmetry. In the same spirit as Brown et al. (2004), we argue that guidance frequency can be rationally used by investors as reflecting an ex-ante policy of enhanced disclosure and therefore frequent guiders are similar to firms that commit to other types of increased disclosure.6 In our framework, firms have two decisions to make regarding guidance. First, they choose the class or type of firm to which they belong (frequent or occasional guiders) and then they choose whether to issue guidance as well as the properties of the guidance in any given period.7 Both choices
6
Surveys of managers support this argument (Graham, Harvey, and Rajgopal 2005). 7
Guidance commitment or policy is also likely to be affected by management changes. This could result in a situation where a firm that guided only a few times might in fact have had a policy to guide, but stopped guiding after management turnover. However, we do not believe this has a major effect on the interpretation of our results. First, even with an ex-ante policy to guide, if a firm has done so only a few times, it is unlikely to have accumulated enough experience to fully enjoy the benefits of its initial policy choice. To the degree these firms have such experience, treating the policy guiders who briefly had a policy in place and therefore guided only a few times as occasional guiders decreases our chances of finding significant results. Second, by classifying firms based on observed frequency, we are
are driven by a trade-off between the relative costs and benefits. However, aspiring to being a frequent guider in the first stage significantly changes the cost-benefit trade-off in the second stage by making the guidance issuance process a repeat game for the frequent guiders. Thus, we expect occasional guiders to issue guidance based only on consideration of current circumstances, while frequent guiders have to be aware that this is just one in a series of potential issuances.
Guidance properties of frequent guiders are therefore likely to be different from those of occasional guiders. For example, when issuing guidance frequent guiders are likely to be less affected by the nature of news being disclosed. Skinner (1994) and Kasznik and Lev (1995) argue that one reason a firm issues guidance is the preemptive dissemination of bad news, thereby fending off potential litigation. Under this scenario firms are more likely to communicate bad news through guidance issuances. But for firms that are regular guiders, not issuing or stopping guidance can prove costly (Chen et al. 2007; Houston et al. 2009) and they are less likely to be constrained to bad news settings. Thus we predict that the bad news hypothesis is more applicable to occasional guiders.
Prior work examining analysts’ forecasts has found that firms enjoy a premium to beating earnings (Bartov, Givoly and Hayn 2002; Kasznik and McNichols 2002; Bhojraj, Hribar, McInnis, and Picconi 2009). Research has also found that analysts’ forecasts follow an optimistic-pessimistic pattern over time (Richardson, Teoh, and Wysocki 2004; Ke and Yu 2006; and Libby, Hunton, Tan, and Seybert 2008), and that bias in short-term management guidance contributes to this pattern (Baik and Jiang 2006; Cotter, Tuna, and Wysocki 2006). These streams of work suggest that a
ensuring that these firms have maintained the policy to guide for an extended period independent of managerial turnover. Finally, to further lessen the possibility of management changes determining our results, we carry out rolling period analyses and analyses using a shorter period of 8 years and find similar results.
pessimistic bias in short-term management guidance is desirable and advantageous. We predict that frequent guiders are more aware of the benefits of being pessimistic and their guidance will reflect this awareness. Finally, frequent guiders are also more likely to commit greater resources to the process of guidance generation to achieve the benefits of reduced information asymmetry and are likely to learn from past guidance history. This should be reflected in greater accuracy, tighter ranges, and an ability to generate guidance earlier in the period.
Prior research provides limited evidence on the association between firms’ guidance records and market responses. Williams (1996) finds that analysts are more responsive to a current period management forecast if the management forecast in the prior period is more useful, but only for good news. In contrast, Hutton and Stocken (2009) find that investor reactions to both good news and bad news guidance are increasing in the length and accuracy of firm’s prior guidance history. Their evidence suggests that firms increase their perceived credibility by establishing a record for issuing accurate guidance.
As discussed earlier, while we expect frequent guiders to be more accurate, we also expect them to be less optimistic than occasional guiders. This suggests that the market response to guidance issued by frequent guiders as compared to those issued by occasional guiders, per unit of news, will vary depending on the sign of the news (i.e., good news or bad news). The greater accuracy of the frequent guiders should result in a larger market response per unit of news for both good and bad
news. However, if the market adjusts for the greater optimistic bias on the part of the occasional guiders, this would result in a larger market response per unit of good news, but a smaller reaction per unit of bad news for the frequent guiders compared with the occasional guiders. As a consequence, we expect a greater market response
per unit of good news for frequent guiders, but may see a greater or smaller reaction per unit of bad news for frequent guiders, compared with the occasional guiders.
2.2. Guidance Frequency and Learning
Research in economics (Arrow 1962), psychology (Einhorn and Hogarth 1978), and management (Huber 1991; Zollo and Winter 2002) finds that individuals and organizations learn through experience when frequency and immediacy of feedback are high. In addition, the learning-by-doing (LBD) model argues that the effort involved in executing a task is decreasing in the cumulative experience. Mikhail, Walther, and Willis (1997) incorporate assumptions of the Learning-by-Doing model to show that analysts’ forecast accuracy improves with experience.
Earnings guidance provides an interesting setting to examine organizational learning because it is a repetitive setting where feedback from the market is quick. Firms that are likely to issue regular guidance have an incentive to expend effort and invest resources in the guidance issuance process until the marginal benefit from guidance improvement is equal to the marginal cost in each period. These firms are also more likely to incorporate and benefit from feedback they receive from markets on the guidance issued. The learning that occurs can take on several forms. First, firms could learn that they are low quality guiders and choose to change their guidance policy. This is a form of self-selection that we try to control for in our analysis. Second, firms could learn about the underlying process that generates the estimates. This should result in improved extrapolation models within the firm to better predict earnings. Third, firms could gain a better understanding of the flexibility in their accounting system to meet announced guidance numbers. Lastly, firms could gain a better understanding of the market’s expectation in terms of the properties and timing of guidance and make adjustments accordingly. While the second and third form of
learning affect the firm’s ability to generate guidance with certain properties, the last form of learning affects the firm’s ability to issue guidance with properties favored by the market. The feedback received by firms from markets after providing guidance should also improve their understanding of the costs and benefits of providing guidance. In terms of the properties of guidance favored by the market, and the resultant direction in the evolution of guidance issued, prior work provides an indication of market’s preference. Prior work indicates that markets respond more to accurate guidance as well as guidance with a tighter range (Hutton and Stocken 2009; Libby, Tan, and Hunton 2006). As discussed earlier, research shows that analysts’ forecasts follow an optimistic-pessimistic pattern over time (Richardson et al. 2004; Ke and Yu 2006; and Libby et al. 2008), and that bias in short-term management guidance contributes to this pattern (Baik and Jiang, 2006 and Cotter et al. 2006). These streams of work suggest that a less optimistic bias in short-term management guidance is desirable and advantageous.8 A timely disclosure allows the managers’ private information to be more quickly incorporated into prices and consequently reduces information asymmetries (King, Pownall, and Waymire 1990). Therefore, we suggest that timelier guidance (without sacrificing guidance accuracy) would be preferred. We argue that guidance frequency and the resulting experience enhances firms’ ability to understand and respond to the market’s preference and therefore predict that firms with experience will become more accurate, have tighter range, be less optimistically biased and issue guidance earlier.
8
In addition to the market’s preference, managers have incentives to issue positive disclosures that increase their stock price (Verrecchia 1983). However, they also face an asymmetric loss function for issuing overly optimistic forecasts (Skinner 1994). Therefore, we argue that firms will learn to weight the benefits of issuing more good news with the costs of issuing an unattainable forecast resulting in less optimistically biased guidance as guidance experience increases.
3. Sample Selection
We begin with a sample of quarterly earnings forecasts in the First Call Company Issued Guidelines (CIG) file. The CIG file includes both quarterly and annual forecasts but we limit our sample to quarterly EPS guidance because feedback is more immediate in this setting. We identify each estimate as point, range, open-ended, or qualitative following the guidelines in Anilowski, Feng, and Skinner (2007). We include only forecasts issued during the period from 1995 to 2005 and further restrict our observations to the first guidance issued if a firm guides more than once for a given quarter.9 After deleting all guidance revisions, we merge the CIG file with Compustat and only retain firms with available data on Compustat and firms that are in existence the entire period from the end of fiscal years 1995 to 2005. This
requirement eliminates the possibility that our findings are attributable to a survival bias where poor performers are subsequently dropped out of our sample in later periods and therefore appear as occasional guiders.10 We then measure firms’
guidance frequency by calculating the number of quarters (Frequency) in which a firm has issued quarterly guidance during our sample period. This results in a sample of 1,821 firms.
9
We do not consider revisions in our sample as we are interested in the number of “quarters” rather than the number of “times” a firm guides during 1995-2005. Our results are also similar when we use the last guidance issued each quarter.
10
We examine the robustness of our results to alternative sample selection specifications. The results using these alternative specifications are similar to those described in the main results. These alternative specifications are discussed in more detail in the additional analyses section.
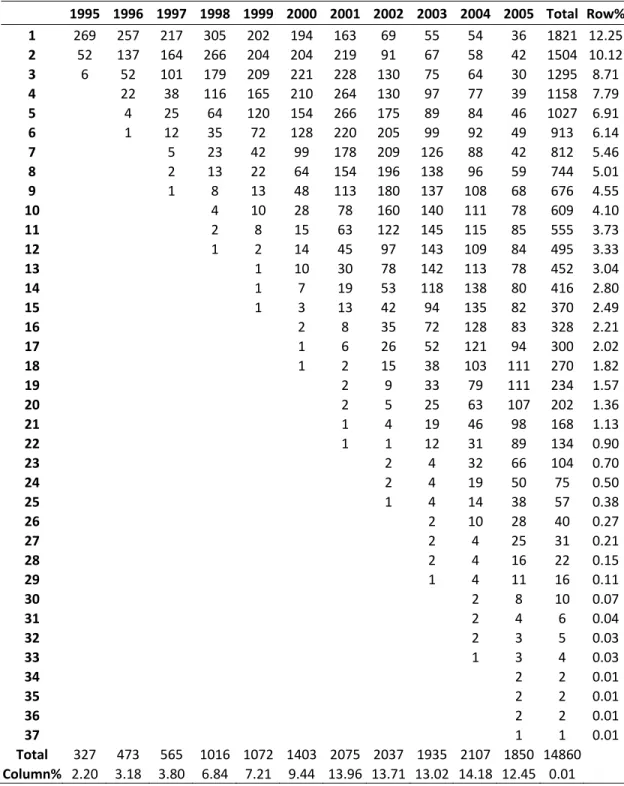
Table 1.1. Distribution of Management Guidance 1995-2005 1995 1996 1997 1998 1999 2000 2001 2002 2003 2004 2005 Total Row% 1 269 257 217 305 202 194 163 69 55 54 36 1821 12.25 2 52 137 164 266 204 204 219 91 67 58 42 1504 10.12 3 6 52 101 179 209 221 228 130 75 64 30 1295 8.71 4 22 38 116 165 210 264 130 97 77 39 1158 7.79 5 4 25 64 120 154 266 175 89 84 46 1027 6.91 6 1 12 35 72 128 220 205 99 92 49 913 6.14 7 5 23 42 99 178 209 126 88 42 812 5.46 8 2 13 22 64 154 196 138 96 59 744 5.01 9 1 8 13 48 113 180 137 108 68 676 4.55 10 4 10 28 78 160 140 111 78 609 4.10 11 2 8 15 63 122 145 115 85 555 3.73 12 1 2 14 45 97 143 109 84 495 3.33 13 1 10 30 78 142 113 78 452 3.04 14 1 7 19 53 118 138 80 416 2.80 15 1 3 13 42 94 135 82 370 2.49 16 2 8 35 72 128 83 328 2.21 17 1 6 26 52 121 94 300 2.02 18 1 2 15 38 103 111 270 1.82 19 2 9 33 79 111 234 1.57 20 2 5 25 63 107 202 1.36 21 1 4 19 46 98 168 1.13 22 1 1 12 31 89 134 0.90 23 2 4 32 66 104 0.70 24 2 4 19 50 75 0.50 25 1 4 14 38 57 0.38 26 2 10 28 40 0.27 27 2 4 25 31 0.21 28 2 4 16 22 0.15 29 1 4 11 16 0.11 30 2 8 10 0.07 31 2 4 6 0.04 32 2 3 5 0.03 33 1 3 4 0.03 34 2 2 0.01 35 2 2 0.01 36 2 2 0.01 37 1 1 0.01 Total 327 473 565 1016 1072 1403 2075 2037 1935 2107 1850 14860 Column% 2.20 3.18 3.80 6.84 7.21 9.44 13.96 13.71 13.02 14.18 12.45 0.01
The row (column) indicates the sequence (year) of guidance issuance. The minimum (maximum) number of guidance issued for our sample firms during 1995-2005 is 1 (37).
The resulting sample is merged with returns data from CRSP, analyst information from IBES, institutional ownership data from Thomson, and executive compensation data from Execucomp. Of the 1,821 firms in our sample, 1,584 firms have analyst and institutional ownership data while 855 have Execucomp data. Given that Execucomp significantly constrains our sample, we use the subsample of firms that are on IBES and Thomson for most of our analyses to maximize the power of our tests.11 However, in keeping with findings of Nagar, Nanda and Wysocki (2003) we examine a specification that includes executive compensation in the analysis of guidance frequency. We also control for firm fixed effects when possible to address concerns about correlated omitted variables.
Table 1.1 provides the number of management forecasts in our sample by sequence and year. The minimum (maximum) guidance frequency is 1 (37). 269 firms issued their first forecast in 1995 compared with 36 firms in 2005. The last row
provides the total number of forecasts issued per year. Consistent with Anilowski et al. (2007), the number of forecasts increases steadily from 1995 to 1997 but experiences a jump in 1998.12 The number of forecasts issued again increases significantly in 2001 which may be due to the effect of Regulation FD.
11
Since we lose a small number of firms due to lack of analyst data, we also examine our results using the entire sample of firms without requiring analyst information. The results are very similar to those using the primary sample.
12
Anilowski et al. (2007) find an increase in the number of forecasts in the database starting in 1998. We choose to use the longer sample period because that increases the power of our primary variable of interest (identifying frequent guiders), especially in the learning analysis in section 5. We believe that ignoring information relating to known guidance quarters prior to 1998 and assuming that a firm commences learning in 1998 is an inferior sample selection choice. However, to examine the robustness of our results, we also carry out an analysis using a sample that commences in 1998. The results are very similar to those discussed in the main section of the paper. We discuss this in more detail in the additional analyses section.
4. Variable Definitions and Descriptive Statistics
4.1. Measures of Guidance Properties
We examine the association between guidance frequency and several guidance properties including error, bias, specificity, range and horizon. Error is the absolute difference between guidance and actual earnings, scaled by beginning-of-quarter price.13Bias is guidance minus actual earnings, scaled by beginning-of-quarter price. Therefore, a positive value of Bias suggests that managers were optimistic in their forecasts. The Error and Bias variables are calculated using actual earnings reported in the First Call Actuals file to ensure consistency between management guidance and EPS realizations. Specificity is an ordinal variable for guidance specificity where point, range, open-ended, and qualitative guidance are coded as 4, 3, 2, and 1,
respectively. Range is the width of range guidance issuances, scaled by beginning-of-quarter price.14Horizon is the number of days between guidance issuance and the fiscal period end. This can take on positive or negative values depending on whether the guidance was issued prior to or subsequent to the fiscal year end.
4.2. Measures of Market Response
To examine market response to guidance we examine two measures.
MktReaction is the three-day cumulative adjusted returns centered on guidance issuance date. ChgConsensus is the difference in analysts’ mean consensus forecasts before and after guidance issuance, scaled by beginning price.
13
The value of the guidance is either the point or open-ended estimate given by the manager or the mid-point of the range estimate. We use the mid-mid-point for range estimates because prior research suggests that investors use the mid-point when forming their expectations of earnings (Baginski et al. 1993). 14
We use the logged transformation of Error and Range when they are the dependent variable in any of our multivariate analyses since the values of Error and Range are always non-negative. Untabulated tests indicate that results using the untransformed values are similar.
4.3. Explanatory and Control Variables
We measure firms’ guidance frequency by calculating the number of quarters (Frequency) in which a firm has issued quarterly guidance during our sample period. In our analysis, we use the frequency of guidance issued as the quintile classification variable. Our main independent variable, MGQuintile, is the quintile rank of
Frequency over our sample period. We use several control variables drawn from prior research in our analysis. We include the market value of firm equity (Size) because prior studies find a positive association between firm size and guidance occurrence (Kasznik and Lev 1995; Ajinkya, Bhojraj, and Sengupta 2005). We proxy for performance using return on assets (ROA) as Miller (2002) finds that disclosure frequency declines with weaker earnings performance. TotalNews is the difference between actual earnings and analysts’ expectation prior to the guidance. We use this measure because it captures both the news at the earnings guidance issuance and the earnings announcement date (Soffer, Thiagarajan, and Walther 2000). Because managers of loss firms have greater difficulty estimating earnings (Ajinkya et al. 2005), we also control for whether a firm reported a loss in a specific quarter (Loss). Litigation risk (LitRisk) is an indicator variable equal to one if a firm is in the biotech, retailing, electronics, or computer industry. Prior research provides mixed evidence on the association between litigation risk and guidance. Ajinkya et al. (2005) find that firms in high litigation risk industries issue guidance less frequently while Skinner (1994) and Wang (2007) find that these firms are more proactive in issuing voluntary disclosures. Following Bamber and Cheon (1998), we include market to book (M/B) as a proxy for proprietary costs because of its negative association with guidance. However, it can also be considered as a proxy for information asymmetry (Verrecchia 1990), which would then predict a positive association between M/B and Frequency. Waymire (1985) finds that firms with volatile earnings issue forecasts less frequently.
Earnings volatility (EarnVol) is defined as the volatility of seasonally adjusted earnings for the twelve quarters before the current fiscal quarter, divided by median assets over the twelve quarters. We also include a firm’s equity beta (Beta) as a proxy for market risk (Bushee and Noe 2000). Ajinkya et al. (2005) examine the effect of institutional ownership on management guidance and find that firms with larger institutional ownership issue guidance more frequently. Therefore, we also control for institutional ownership (Inst). Similarly, we include the number of analysts following (Num) and dispersion in analysts’ consensus forecasts (Disp) because we expect firms committed to increased disclosure to have higher analyst following and lower analyst dispersion (Ajinkya and Gift 1984; Lang and Lundholm 1996). Feng and Koch (2008) find that firms that disappoint analyst expectations in the past are more likely to stop issuing future guidance. Therefore, we also include an indicator variable equal to one if the firm meets or beats analysts’ consensus forecasts in that quarter (MBAnalyst). The number of business segments (Segments) as a proxy for firm complexity is relevant because firms with multiple product lines and subsidiaries are more likely to benefit from increased disclosures that help investors analyze the firm. We also control for a firm’s financial reporting conservatism and performance variability because Hui, Matsunaga, and Morse (2009) find that firms with more conservative financial statements and variability in their performance issue guidance less frequently in subsequent periods. Our measure of conservatism (Cons) is total accruals scaled by total assets averaged over 1990 to 1994 (Givoly and Hayn 2000). Following Hui et al. (2009), we also use the standard deviation of annual stock returns (RetVol) prior to the guidance period (1990-1994) as a proxy for performance uncertainty. However, firms with high variability in their performance are also likely to disclose more frequently to assist investors’ valuations. Lastly, Nagar, Nanda, and Wysocki (2003) find that stock price-based incentives elicit managers to disclose more frequently. Therefore, we also
examine the average ratio of the CEO’s equity compensation to total compensation (Ecomp) and the logged value of the CEO’s shareholdings (Wealth).
4.4. Descriptive Statistics
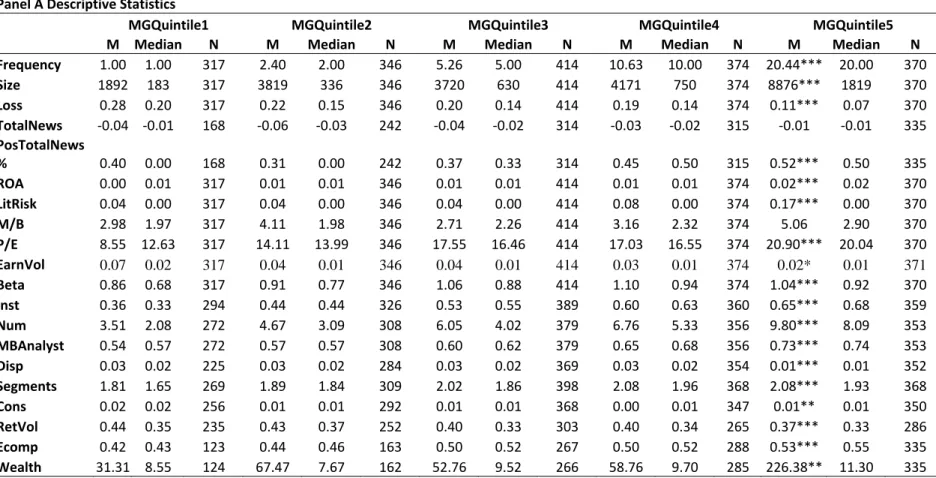
Panel A of Table 1.2 provides univariate descriptive statistics on the firm characteristics for the firms in the various quintiles. Firms in MGQuintile1 issued guidance only once during our sample period while the average guidance frequency is 20.44 for firms in MGQuintile5. We find that several firm characteristics are
significantly related to guidance frequency. Firms that issued guidance more
frequently are significantly larger. The median firm in MGQuintile5 is approximately 10 times larger than the median firm in MGQuintile1. The frequent guiders are also less likely to report losses, and are more likely to be from high litigation risk
industries. Frequent guiders also have higher ROAs, lower earnings volatility, lower return volatility, higher institutional ownership, more analysts following, and lower analyst dispersion. While occasional guiders are likely to guide in periods of bad news, frequent guiders are not limited by the news in providing guidance. The average
TotalNews for MGQuintile5 is not significantly different from zero. However, the average percentage of quarters where TotalNews is greater or equal to zero is significantly higher for firms in MGQuintile5. Guidance frequency also increases in both the proportion of CEO compensation tied to the stock price and the value of the CEO’s stockholdings. While we would expect frequent guiders to be more mature and stable firms, their price to earnings ratios suggest otherwise. The difference in means of firms in MGQuintile1 and MGQuintile5 are significant at the five percent level using a t-test for all but three of the variables.
We examine the association between guidance frequency and firm
method rather than the OLS because the dependent variable is count data. The model is as follows (firm subscripts and the intercept term have been suppressed):
1 2 3 4 5 6 7 8 9 10 11 12 13 14 15 16 17 /
Frequency Size Loss ROA LitRisk M B EarnVol Beta Inst TotalNews Num MBAnalyst Disp Cons RetVol
Segments Ecomp Wealth
β β β β β β β β β β β β β β β β β = + + + + + + + + + + + + + + + + +ε (1) Frequency is the number of initial management forecasts issued between 1995 and 2005. The explanatory variables are as described earlier. Given that Frequency is a firm level variable, the explanatory variables used in the regression are firm averages from 1995 to 2005.15
Panel B of Table 1.2 provides results of this analysis. We first report the results corresponding to the full sample of 1,821 firms. Consistent with the univariate
statistics, guidance frequency is positively associated with firm size, performance (as proxied by ROA and Loss), litigation risk, information asymmetry (as proxied by
M/B), and market risk (as proxied by Beta). We also find that guidance frequency is negatively associated with the likelihood of having losses. We next include controls for analyst following and institutional ownership and find that guidance frequency continues to be significantly associated with Loss, LitRisk, and Beta. The coefficients on the analyst and institutional ownership-related variables also suggest that firms committed to issuing guidance have a higher number of analysts following (Num), larger institutional ownership (Inst), lower analyst dispersion (Disp), and are more likely to meet or beat analysts’ consensus (MBAnalyst). The positive coefficient on
TotalNews confirms the univariate results that guidance frequency is positively associated with news. The univariate and multivariate results on TotalNews, ROA and
Loss help reconcile mixed results in prior research on whether firms guide in periods of bad or good performance. The results suggest that firms that display a commitment
15
to guide are less constrained by the nature of news in providing guidance and are therefore likely to guide in periods of good and bad news. Earlier findings indicating increased guidance during periods of bad news are therefore more applicable to occasional guiders. We also control for conservatism and return volatility in this specification and find that firms with more conservative financial statements issue guidance less frequently consistent with Hui et al. (2009). Following Nagar et al. (2003), the last column presents results controlling for the number of business segments (Segments) and management stock-based incentives (Ecomp and Wealth). The positive and significant coefficients on Segments and Wealth suggest that more complex firms and firms whose CEOs have more wealth tied to the firm’s stocks also issue guidance more frequently. Note that our sample size is reduced by half when we include controls for management stock-based incentives because a majority of firms in the bottom guidance frequency quintiles do not have complete CEO compensation data on ExecuComp. Therefore, we only include controls for analyst following and institutional ownership to maximize the number of sample firms in our subsequent tests.
Consistent with prior research, the findings from this analysis suggest that firms which commit to increased disclosure are different from firms that issue guidance occasionally across several dimensions. Moreover, the findings from this analysis provide evidence against a pure maturation based explanation for our results. Although frequent guiders are larger firms, they are also more likely to be in litigation prone industries (which tend to have high growth). This higher growth setting is consistent with the higher market to book ratios and the higher price to earnings multiples that the frequent guiders enjoy.
20
Table 1.2. Guidance Frequency and Firm Characteristics
Panel A Descriptive Statistics
MGQuintile1 MGQuintile2 MGQuintile3 MGQuintile4 MGQuintile5
M Median N M Median N M Median N M Median N M Median N
Frequency 1.00 1.00 317 2.40 2.00 346 5.26 5.00 414 10.63 10.00 374 20.44*** 20.00 370 Size 1892 183 317 3819 336 346 3720 630 414 4171 750 374 8876*** 1819 370 Loss 0.28 0.20 317 0.22 0.15 346 0.20 0.14 414 0.19 0.14 374 0.11*** 0.07 370 TotalNews ‐0.04 ‐0.01 168 ‐0.06 ‐0.03 242 ‐0.04 ‐0.02 314 ‐0.03 ‐0.02 315 ‐0.01 ‐0.01 335 PosTotalNews % 0.40 0.00 168 0.31 0.00 242 0.37 0.33 314 0.45 0.50 315 0.52*** 0.50 335 ROA 0.00 0.01 317 0.01 0.01 346 0.01 0.01 414 0.01 0.01 374 0.02*** 0.02 370 LitRisk 0.04 0.00 317 0.04 0.00 346 0.04 0.00 414 0.08 0.00 374 0.17*** 0.00 370 M/B 2.98 1.97 317 4.11 1.98 346 2.71 2.26 414 3.16 2.32 374 5.06 2.90 370 P/E 8.55 12.63 317 14.11 13.99 346 17.55 16.46 414 17.03 16.55 374 20.90*** 20.04 370 EarnVol 0.07 0.02 317 0.04 0.01 346 0.04 0.01 414 0.03 0.01 374 0.02* 0.01 371 Beta 0.86 0.68 317 0.91 0.77 346 1.06 0.88 414 1.10 0.94 374 1.04*** 0.92 370 Inst 0.36 0.33 294 0.44 0.44 326 0.53 0.55 389 0.60 0.63 360 0.65*** 0.68 359 Num 3.51 2.08 272 4.67 3.09 308 6.05 4.02 379 6.76 5.33 356 9.80*** 8.09 353 MBAnalyst 0.54 0.57 272 0.57 0.57 308 0.60 0.62 379 0.65 0.68 356 0.73*** 0.74 353 Disp 0.03 0.02 225 0.03 0.02 284 0.03 0.02 369 0.03 0.02 354 0.01*** 0.01 352 Segments 1.81 1.65 269 1.89 1.84 309 2.02 1.86 398 2.08 1.96 368 2.08*** 1.93 368 Cons 0.02 0.02 256 0.01 0.01 292 0.01 0.01 368 0.00 0.01 347 0.01** 0.01 350 RetVol 0.44 0.35 235 0.43 0.37 252 0.40 0.33 303 0.40 0.34 265 0.37*** 0.33 286 Ecomp 0.42 0.43 123 0.44 0.46 163 0.50 0.52 267 0.50 0.52 288 0.53*** 0.55 335 Wealth 31.31 8.55 124 67.47 7.67 162 52.76 9.52 266 58.76 9.70 285 226.38** 11.30 335 M = mean. The sample consists of 1,821 firms between 1995 and 2005. Frequency is the number of quarterly earnings guidance issuance by a firm (excluding revisions) during sample period. MGQuintile is the quintile rank of guidance frequency. Descriptive statistics are reported at the firm level using firm
averages over the 11-year sample period. See Appendix for variable definitions. Variables marked with a *, **, or *** are significant at p< .10, .05, or .01, respectively, using a two-tailed t-test of difference in means of MGQuintile 1 and MGQUintile5.
21 Table 1.2 (Continued) Panel B Poisson Regression Dependent Variable: Frequency Size 2.967*** 0.856 ‐0.501 (0.611) (1.124) (1.188) Loss ‐1.132*** ‐0.588*** ‐0.629** (0.155) (0.214) (0.247) ROA 6.436*** 1.949 ‐2.825 (1.452) (1.799) (2.053) LitRisk 0.521*** 0.273*** 0.373*** (0.057) (0.063) (0.070) M/B 0.002*** ‐0.001 ‐0.002 (0.000) (0.003) (0.004) EarnVol ‐0.720 ‐0.043 1.567 (0.656) (1.229) (1.473) Beta 0.308*** 0.091** 0.088* (0.030) (0.044) (0.048) Inst 0.976*** 0.606*** (0.135) (0.175) TotalNews 5.456** 5.892 (2.076) (4.601) Num 0.019*** 0.015*** (0.005) (0.005) MBAnalyst 0.604*** 0.667*** (0.173) (0.199)
This table presents poisson regression tests of the association between firm characteristics and guidance frequency. The dependent variable is the frequency
of guidance issuances over the 11-year period 1995-2005. See Appendix for variable definitions. Wealth and Size are divided by 106 for expositional
purposes. Standard errors reported in parentheses are clustered at the 2-digit SIC level. Coefficients marked with a *, **, or *** are significant at p< .10, .05, or .01, respectively, using a two-tailed test.
22 Table 1.2 (Continued) Panel B Poisson Regression Dependent Variable: Frequency Disp ‐3.893*** ‐4.111*** (1.258) (1.456) Cons ‐0.284** ‐0.637 (0.140) (0.441) RetVol 0.031 0.066 (0.102) (0.122) Segments 0.072*** (0.026) Ecomp 0.113 (0.158) Wealth 0.026** (0.012) Pseudo R‐squared 0.110 0.180 0.126 Firms 1821 1584 855
23
Table 1.3. Descriptive Statistics of Guidance Properties
MGQuintile1 MGQuintile2 MGQuintile3 MGQuintile4 MGQuintile5
M Median N M Median N M Median N M Median N M Median N
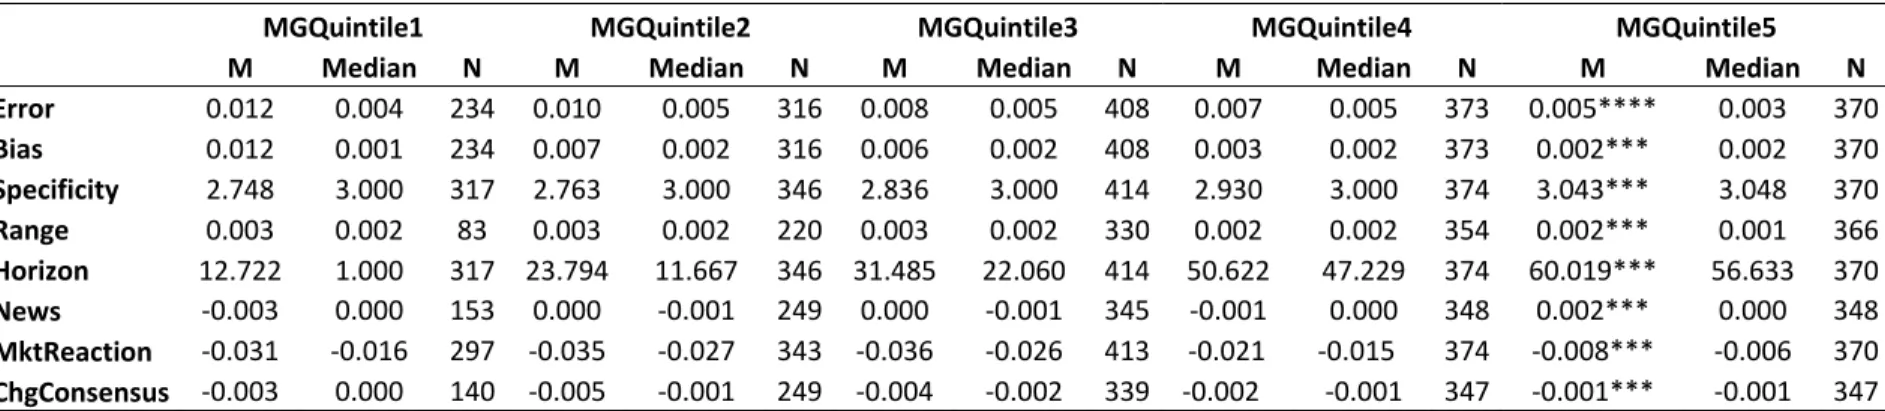
Error 0.012 0.004 234 0.010 0.005 316 0.008 0.005 408 0.007 0.005 373 0.005**** 0.003 370 Bias 0.012 0.001 234 0.007 0.002 316 0.006 0.002 408 0.003 0.002 373 0.002*** 0.002 370 Specificity 2.748 3.000 317 2.763 3.000 346 2.836 3.000 414 2.930 3.000 374 3.043*** 3.048 370 Range 0.003 0.002 83 0.003 0.002 220 0.003 0.002 330 0.002 0.002 354 0.002*** 0.001 366 Horizon 12.722 1.000 317 23.794 11.667 346 31.485 22.060 414 50.622 47.229 374 60.019*** 56.633 370 News ‐0.003 0.000 153 0.000 ‐0.001 249 0.000 ‐0.001 345 ‐0.001 0.000 348 0.002*** 0.000 348 MktReaction ‐0.031 ‐0.016 297 ‐0.035 ‐0.027 343 ‐0.036 ‐0.026 413 ‐0.021 ‐0.015 374 ‐0.008*** ‐0.006 370 ChgConsensus ‐0.003 0.000 140 ‐0.005 ‐0.001 249 ‐0.004 ‐0.002 339 ‐0.002 ‐0.001 347 ‐0.001*** ‐0.001 347 M = mean. The sample consists of 1,821 firms between 1995 and 2005. Frequency is the number of quarterly earnings guidance issuance by a firm (excluding revisions) during sample period. MGQuintile is the quintile rank of guidance frequency. Descriptive statistics are reported at the firm level using firm
averages over the 11-year sample period. See Appendix for variable definitions. Variables marked with a *, **, or *** are significant at p< .10, .05, or .01, respectively, using a two-tailed t-test of difference in means of MGQuintile 1 and MGQUintile5.
5. Guidance Frequency, Guidance Properties, and Market Response
Section four provides strong evidence that frequent guiders are different from occasional guiders on many dimensions. In this section, we examine the relation between guidance frequency and the properties of the guidance issued and analysts’ and market response to them. As with the frequency regression above, the analyses in this section are conducted at the firm level using averaged values (and median values) from quarterly observations over the sample period (for both the dependent and independent variables). This is to ensure that each firm appears only once in the analysis and that frequent guiders do not benefit from a larger number of observations that would result from a guidance level analysis. We also carry out analyses at the firm-quarter level which allows us to use a rolling period specification. This second specification, discussed in the additional analysis section, avoids a peek-ahead bias by using the past frequency on a rolling basis.
Table 1.3 provides univariate statistics on the properties of guidance issued by firms in the quintiles.16 The frequent guiders (MGQuintile5) display less optimism in their guidance with an average optimistic bias of 0.2% of price, approximately one-sixth the level for firms in MgQuintile1. Frequent guiders are also more accurate than the occasional guiders even though they provide their first guidance earlier. Error for firms in MGQuintile5 is 0.5% of price as compared to 1.2% of price for firms in
MgQuintile1. The statistics for Horizon, defined as the number of days between guidance issuance and the end of the fiscal period show that frequent guiders on average provide their first guidance 60 days prior to the end of the fiscal period as compared 12 days prior to the end of the fiscal period for the occasional guiders. Frequent guiders appear more likely to understand the earnings generation and
16
To ensure that our results are not driven by extreme outliers in the CIG dataset, we winsorize Error, Bias, and Range at the 1 and 99 percent levels.
disclosure process and therefore are willing to issue guidance earlier. In addition to issuing more specific guidance, the frequent guiders also issue much narrower range guidance. Average Range-width for the guidance issued by firms in MGQuintile5 is 0.2% of price as compared with 0.3% of price for firms in MGQuintile1.
Table 1.3 also provides univariate statistics on the market response variables across quintiles. The market response to guidance issued by occasional guiders is significantly more negative. The average market response in the three day trading window around the guidance issuance date for firms in the first quintile is -3.1%. This is compared with a return of -0.8% for firms in the fifth quintile. This is consistent with the news conveyed by occasional guiders being much worse than news conveyed by frequent guiders. The difference in market response is also evident in the change in analysts’ forecasts. ChgConsensus is measured by finding the two statistical periods on IBES that are closest around the guidance issuance date and taking the difference between the mean consensus forecasts measured in the two periods. We find that, there is a significantly larger negative revision in response to guidance by occasional guiders.
We examine the effect of guidance frequency on guidance properties and market participants’ responses to guidance utilizing in a multivariate setting using two approaches. First, we analyze an OLS specification as follows (firm subscripts and intercept terms have been suppressed):
1 2 ( ) 3 4 5 6 7 (2)
Error=βMGQuintile+β Log Size +β Num+β Loss+β Horizon+β LitRisk+β Inst+ε
1 2 ( ) 3 4 5 6 7 (3)
Bias=βMGQuintile+β Log Size +β Num+β Loss+β Horizon+β LitRisk+β Inst+ε
1 2 ( ) 3 4 5 6 7 (4)
Range=βMGQuintile+β Log Size +β Num+β Loss+β Horizon+β LitRisk+β Inst+ε
1 2 ( ) 3 4 5 6 (5)
Horizon=βMGQuintile+β Log Size +β Num+β Loss+β LitRisk+β Inst+ε
1 2 3 4 5 6
7
( )
(6)
MktReaction MGQuintile Log Size Num Loss Horizon LitRisk Inst
β β β β β β
β ε
= + + + + +
1 2 3 4 5 6 7
( )
(7)
ChgConsensus MGQuintile Log Size Num Loss Horizon LitRisk Inst
β β β β β β
β ε
= + + + + +
+ +
One potential issue with the above analysis is that any documented association between MgQuintile and the dependent variables could be driven by an association between the dependent variables and some of the underlying firm characteristics that have been documented in Table 1.2 to be associated with guidance frequency. If that is the case then MgQuintile would not have explanatory ability of its own once the underlying firm characteristics are controlled for. To mitigate this possibility our second analysis involves carrying out a two-stage analysis wherein the first stage involves a regression of guidance frequency on several firm characteristics (see equation 1). The error term from this regression represents the variation in frequency that is unexplained by the firm characteristics. We use this error term in the second stage regressions (equations 2 to 7), in place of MGQuintile to isolate the incremental effect of frequency on guidance properties.
In the single stage OLS as well as in the second stage of the two stage analysis we control for Size, Num, and Inst because we expect larger firms and firms with more analysts following and higher levels of institutional ownership to issue guidance of higher quality (Ajinkya et al. 2005). We also include Loss and LitRisk because firms experiencing losses or firms in high litigation risk industries are likely to have greater difficulty predicting earnings. Lastly, we also control for Horizon because managers will have better information about predicted earnings the closer it is to the fiscal period end.
Table 1.4. Guidance Frequency and Guidance Properties (Means)
Error Bias Range
OLS 2SLS OLS 2SLS OLS 2SLS
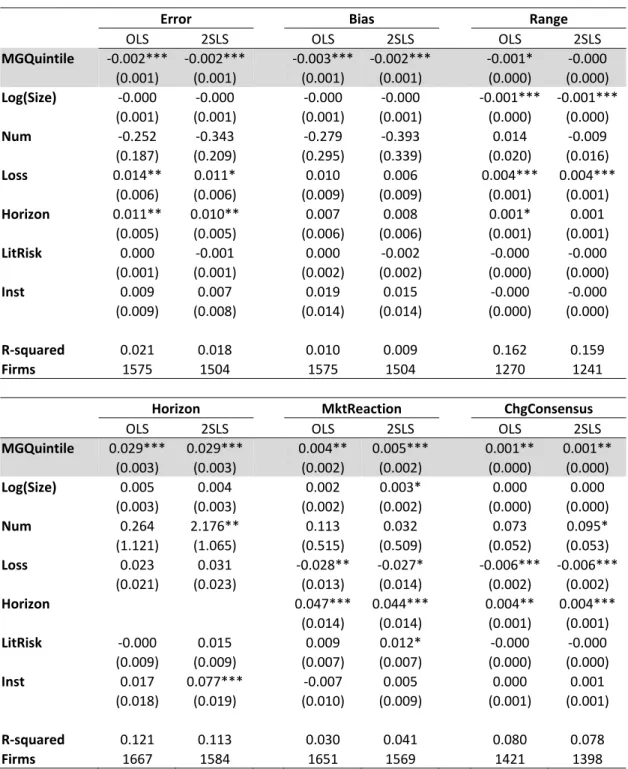
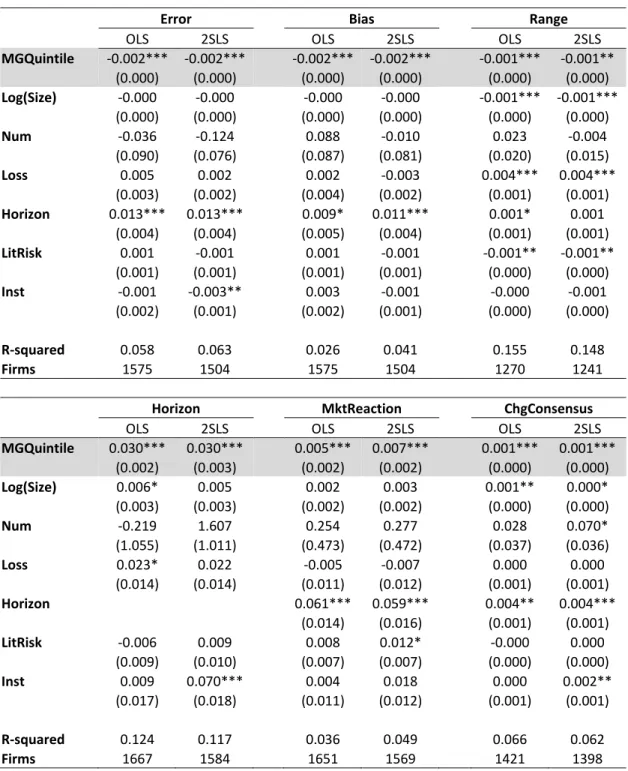
MGQuintile ‐0.002*** ‐0.002*** ‐0.003*** ‐0.002*** ‐0.001* ‐0.000 (0.001) (0.001) (0.001) (0.001) (0.000) (0.000) Log(Size) ‐0.000 ‐0.000 ‐0.000 ‐0.000 ‐0.001*** ‐0.001*** (0.001) (0.001) (0.001) (0.001) (0.000) (0.000) Num ‐0.252 ‐0.343 ‐0.279 ‐0.393 0.014 ‐0.009 (0.187) (0.209) (0.295) (0.339) (0.020) (0.016) Loss 0.014** 0.011* 0.010 0.006 0.004*** 0.004*** (0.006) (0.006) (0.009) (0.009) (0.001) (0.001) Horizon 0.011** 0.010** 0.007 0.008 0.001* 0.001 (0.005) (0.005) (0.006) (0.006) (0.001) (0.001) LitRisk 0.000 ‐0.001 0.000 ‐0.002 ‐0.000 ‐0.000 (0.001) (0.001) (0.002) (0.002) (0.000) (0.000) Inst 0.009 0.007 0.019 0.015 ‐0.000 ‐0.000 (0.009) (0.008) (0.014) (0.014) (0.000) (0.000) R‐squared 0.021 0.018 0.010 0.009 0.162 0.159 Firms 1575 1504 1575 1504 1270 1241
Horizon MktReaction ChgConsensus
OLS 2SLS OLS 2SLS OLS 2SLS
MGQuintile 0.029*** 0.029*** 0.004** 0.005*** 0.001** 0.001** (0.003) (0.003) (0.002) (0.002) (0.000) (0.000) Log(Size) 0.005 0.004 0.002 0.003* 0.000 0.000 (0.003) (0.003) (0.002) (0.002) (0.000) (0.000) Num 0.264 2.176** 0.113 0.032 0.073 0.095* (1.121) (1.065) (0.515) (0.509) (0.052) (0.053) Loss 0.023 0.031 ‐0.028** ‐0.027* ‐0.006*** ‐0.006*** (0.021) (0.023) (0.013) (0.014) (0.002) (0.002) Horizon 0.047*** 0.044*** 0.004** 0.004*** (0.014) (0.014) (0.001) (0.001) LitRisk ‐0.000 0.015 0.009 0.012* ‐0.000 ‐0.000 (0.009) (0.009) (0.007) (0.007) (0.000) (0.000) Inst 0.017 0.077*** ‐0.007 0.005 0.000 0.001 (0.018) (0.019) (0.010) (0.009) (0.001) (0.001) R‐squared 0.121 0.113 0.030 0.041 0.080 0.078 Firms 1667 1584 1651 1569 1421 1398
This table presents OLS and 2SLS tests of the association between guidance frequency and guidance properties. The IV specification uses the error term from regressing MGQuintile on Loss, LitRisk, Beta, Inst, Num, MBAnalyst, and Disp in the first-stage as an instrumental variable for MGQuintile in the second-stage regressions. The results in the table reflect the second-stage regressions. See Appendix for variable definitions. Size, Num, and Horizon are divided by 106, 103, and 365, respectively, for
expositional purposes. Standard errors reported in parentheses are clustered at the 2-digit SIC level. Coefficients marked with a *, **, or *** are significant at p< .10, .05, or .01, respectively, using a two-tailed test.
Table 1.4 provides results of the single stage and two-stage regressions
explaining guidance properties. The analysis is done using firm level average values.17 The univariate associations documented earlier continue to hold in the multivariate setting. For both specifications, the coefficients on MGQuintile are consistent with a positive association between guidance frequency and guidance quality. MGQuintile is negatively associated with Error (
β
1= -0.002 and -0.002, p < 0.01), Bias (β
1= -0.003 and -0.002, p < 0.01), and Range (β
1= -0.001, p < 0.1), and positively associated withHorizon (
β
1= 0.029, p < 0.01). Tests of the association between guidance frequency and market responses also suggest that investors respond more strongly to guidance issued by frequent guiders (β
1= 0.004 and 0.005, p < 0.05). Analysts also respond more to guidance from frequent guiders (β
1= 0.001 and 0.001, p < 0.05).The results for the control variables are generally consistent with prior studies. In particular, we find that firms reporting losses issue more inaccurate and less precise guidance. Consistent with managers having less information in the beginning of the period, guidance issued at longer horizons have more error and range-width.18
Overall, we present evidence that frequent guiders provide guidance of higher quality. While prior research is silent on the link between the quantity and quality of management guidance, these results suggest that there is a strong association between these two constructs.
17
Analysis is also carried out using firm level median values with similar results. This is discussed briefly in the additional analysis section.
18
We also carried out our analysis using a dichotomous variable OPT, where OPT is coded as equal to one if the management estimate is optimistically biased. The logit results are similar to the Bias findings.
6. Learning over Time within Firms
The analysis thus far examines differences between frequent and occasional guiders. As discussed earlier prior research suggests that there is reason to believe that earnings guidance is an interesting setting to examine organizational learning. To examine if firms exhibit the learning beyond that implied by self-selection, we utilize the traditional Heckman two-stage procedure as well as a matched sample procedure.
6.1. Heckman Two-Stage Estimation
The Heckman two-stage procedure is applied by estimating the following models (firm and time subscripts have been suppressed):
1 2 3 4 5 6 7 8
Pr( )
(8)
Occur Size Num Loss Inst ROA MB EarnVol LagOccur
FirmFixedEffects β β β β β β β β ε = + + + + + + + + + 1 2 3 4 5 6 7 8 9 (2 ) Error Sequence Size Num Loss Inst LagError Horizon
SOX InvMills FirmFixedEffects a
β β β β β β β β β ε = + + + + + + + + + + 1 2 3 4 5 6 7 8 9 (3 ) Bias Sequence Size Num Loss Inst LagBias Horizon
SOX InvMills FirmFixedEffects a
β β β β β β β β β ε = + + + + + + + + + + 1 2 3 4 5 6 7 8 9 (4 )
Range Sequence Size Num Loss Inst LagRange Horizon
SOX InvMills FirmFixedEffects a
β β β β β β β β β ε = + + + + + + + + + + 1 2 3 4 5 6 7 9 (5 ) Horizon Sequence Size Num Loss Inst LagHorizon
SOX InvMills FirmFixedEffects a
β β β β β β
β β ε
= + + + + +
+ + + +
Model (8) is a probit model that estimates the likelihood of guidance
occurrence. The dependent variable Occur is equal to one if the firm issued guidance in that period. The independent variables are Size, Num, Loss, Inst, ROA, MB,
EarnVol, Cons, RetVol and an indicator variable controlling for guidance occurrence in the prior quarter (LagOccur). The variables are as of the beginning of the quarter. Estimated parameters from model (8) are then used to calculate the inverse mills ratio (InvMills), which is included as an independent variable in the second stage OLS
regressions. Models (2a) to (5a) examine whether guidance error, bias, range, and horizon improve over time, conditional on likelihood of guidance issuance. Sequence
is the sequential order of guidance issuances for each firm ranging from 1 to 37. If firms learn to improve their guidance quality with repetition, then we expect the error, optimistic bias, and range-width in guidance to decrease and the timeliness of
guidance to increase as Sequence increases.19We also control for the lag term (LagError, LagBias, LagRange, and LagHorizon) in the second stage regressions because we expect prior guidance outcomes to be highly associated with current period guidance decisions. Firm fixed effects are also included to control for correlated omitted variables. We also control for changes in the information
environment resulting from new regulation by including an indicator variable (SOX) post-SOX period which takes on a value 1 for periods after 2002. This variable controls for the requirement to disclose internal control weaknesses in Sections 302 and 404 of the Sarbanes-Oxley Act which may incentivize firms to produce more accurate interim financial statements after 2002. These financial statements which management uses as inputs when forming guidance will then affect the properties of the guidance issued (Feng, Li, and McVay 2009).
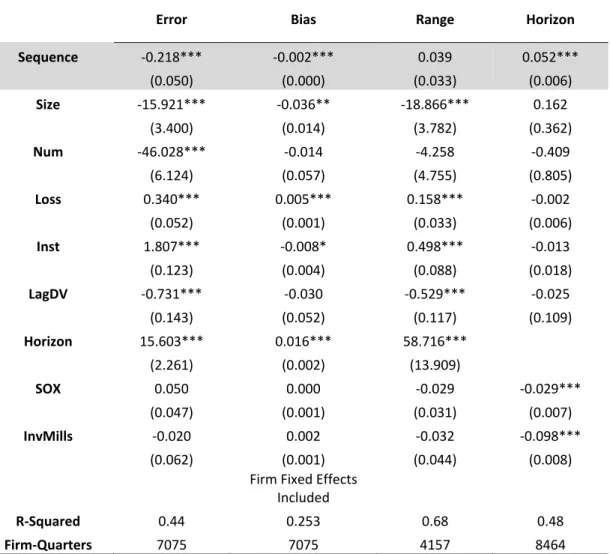
Table 1.5 presents results of the Heckman two-stage estimation. As expected,
Sequence is negatively associated with Error (
β
1= -0.218, p < 0.01) and Bias (β
1= -0.002, p < 0.01) and positively associated with Horizon (β
1= 0.052, p < 0.01). However, the coefficient is positive though non-significant for Range. This suggests that firms become more accurate, timelier, and less optimistically biased in their guidance issuances over time. The results for the control variables are generally19
The average guidance bias is positive (optimistic) across all MGQuintiles in our sample which is likely due to our choice of using the first guidance issued per quarter. However, the fact that frequent guiders issue less optimistically biased guidance than occasional guiders is consistent with frequent guiders learning to avoid issuing extreme downward revisions to their forecasts.
consistent with our expectations except for Inst.20 Overall, the results suggest that firms’ guidance properties improve with experience, even after controlling for self-selection.
6.2. Matched Sample Analysis
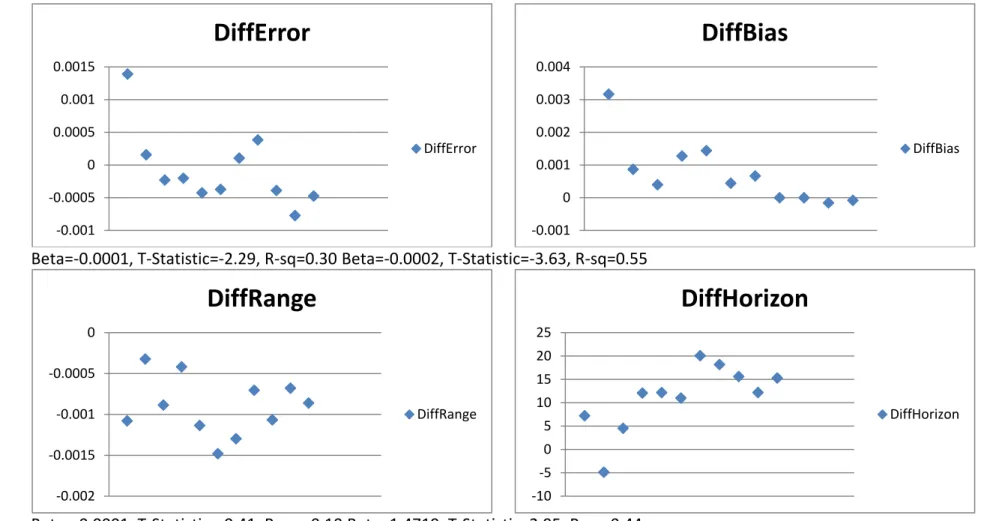
We also use a matched pair design as an alternative test for the effects of learning. By using a sample of guidance issued by occasional guiders as a control group, we are better able to attribute the differences observed to the effects of learning by the frequent guiders. The properties of the occasional guiders at any point in time reflect the general overall information environment and therefore act as our base case. For each year in our sample period, we calculate DiffError, DiffBias, DiffRange, and
DiffHorizon by subtracting the mean guidance error, bias, range, and horizon for occasional guiders (MGQuintile5=0) from the mean guidance error, bias, range, and horizon for frequent guiders (MGQuintile5=1), respectively. Under the null hypothesis of no learning, the differences between the two groups should not change over time. However, if frequent guiders learn with experience, then we would expect DiffError,
DiffBias, and DiffRange to become more negative and DiffHorizon to become more positive over our sample period.21
20
We find in our untabulated tests that Inst is negative and significant when we use the untransformed values of Error and Range.
21
This analysis is still subject to the possibility that general information environment changes could systematically affect frequent guiders more than occasional ones.
Table 1.5. Heckman Two-Stage Estimation of the Trends in Guidance Properties
Error Bias Range Horizon
Seq