Privacy Settings from Contextual Attributes: A Case Study Using Google Buzz
Daisuke Mashima∗ Georgia Institute of Technology
[email protected] Prateek Sarkar∗
Google Inc. [email protected]
Elaine Shi Palo Alto Research Center
[email protected] Chris Li VMware Inc. [email protected]
Richard Chow Palo Alto Research Center
[email protected] Dawn Song UC Berkeley [email protected]
Abstract—Social networks provide users with privacy set-tings to control what information is shared with connections and other users. In this paper, we analyze factors influencing changes in privacy-related settings in the Google Buzz social network. Specifically, we show statistics on contextual data related to privacy settings that are derived from crawled datasets and analyze the characteristics of users who changed their privacy settings. We also investigate potential neighboring effects among such users.
I. INTRODUCTION
Privacy can be defined as “the right of self-determination regarding data disclosure” [4]. Hence, individual privacy set-tings for online social networks determine what information a user discloses to others. These settings are a potential reflection of a community’s privacy mores and can be a rich source of research data on privacy. In particular, the context for particular settings can be valuable in understanding how settings are influenced by outside events, personality traits, and peer effects.1
We describe in this paper some preliminary work in the analysis of privacy settings and their context. We analyze privacy settings in the Google Buzz social network, in which there are simple, easily located toggles that deter-mine whether a user’s connections are publicly visible and whether a user’s profile page is public. We look into the characteristics of users who switched their privacy settings. Our hope is that this investigation will shed light on the nature of privacy in an online social network, namely what motivates privacy, what it is associated with, whether peer effects exist or not. With this goal in mind, we conducted a differential analysis based on two snapshots of the Google Buzz graph which we crawled in March and June respec-tively. Notably, the time of the first crawl was close to the privacy uproar shortly after Google Buzz was released, as we were particularly interested in how users reacted to the negative publicity caused by the privacy uproar.
∗Work done while the author was at PARC.
1Of course, this all assumes privacy settings are understandable, usable,
and can even be easily located, which may or may not be true (see, for example, [3]).
The paper is organized as follows. We first give an overview of the Google Buzz online social network, which we focus on in this work, and discuss related work. We then describe the actual datasets we collected and some generic statistics about Google Buzz. Next, we analyze the changes in privacy-related settings from a variety of aspects. Finally, we conclude the paper and offer suggestions for future work. A. Google Buzz
Google Buzz (http://www.google.com/buzz) is an online social networking service provided by Google. Like other popular social network services, users can “follow” other users and also share biographical data, interests, photos, web sites, etc., as well as post short messages on profile pages.
Google Buzz was rolled out on February 9, 2010, and was provided as part of Google’s Gmail service without requiring a dedicated sign-up process. Buzz automatically populated the followers list (users following the user) and followees list (users the user is following) based on a user’s Gmail contact list. These lists were publicly visible by default, which raised immediate privacy concerns, see for example, [2] and [1]. Within a few days of its launch, Google made more prominent the configuration option to hide the fol-lower/followee lists and switched to auto-suggesting initial followers/followees instead of auto-populating them.
In this work, we concentrate on two privacy-related set-tings that are easily recognized by users. One is the simple follower/followee visibility setting which can be found on top of the main “Edit your profile” page: “Display the list of people I’m following and people following me.” This toggle essentially decides whether a user’s list of followers/followees are public or not. The other is a toggle to delete a public profile page. This toggle is found at the bottom of the “Edit your profile” page. By selecting this option, users can disable their public profile page while still being able to follow or to be followed by other users. B. Related Work
Privacy issues and control in online social networks have been explored by a number of researchers. Bonneau et al.
evaluated strategies to crawl data from Facebook [5]. Govani et al. [10] and Dwyer et al. [8] measured the privacy and trust of users in Facebook by means of questionnaires. To the best of our knowledge, our work is the first attempt to investigate characteristics of users who change their privacy-related configuration in online social network services.
II. DATASET
We crawled the Google Buzz data in March 2010, result-ing in theMarch Dataset, and again in June 2010, resulting in theJune Dataset. The March Dataset contains 4,953,192 users and 27,859,879 follower/followee relationships (i.e., directed edges), while the June Dataset has 7,024,611 users and 50,379,810 edges. Google released an API to query the Google Buzz data in May 2010, but we implemented an HTML-based crawler because our first crawling was done before the API was released. When crawling the March Dataset, we started with randomly selected seed users and expanded the network by following their follower/followee relationships in a breadth-first manner. For the June Dataset, we started with the list of users included in the March Dataset. Thus, users in the March Dataset form a subset of the users in the June Dataset. Unfortunately, we did not have time before the submission date of this paper, but clearly our results may be more conclusive with further crawlings.
For each user, we collected the following data: 1) Profile page (including “About me” and “Buzz”) 2) List of users that the user is following (followee list) 3) List of users that are following the user (follower list) Note that the availability of this information depends on the user’s privacy configuration in Google Buzz, which will be explained later.
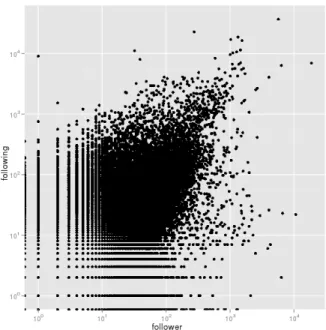
Since Google Buzz has not been well-studied elsewhere, we start with comparing the high-level characteristics of Google Buzz with other online social networks. We first looked at the relationship between the number of followers (i.e., in-degrees) and the number of followees (i.e., out-degrees). Figure 1 is the scatter plot of in-/out-degrees of each user in the March Dataset. We see some similarities to the Twitter social network [11]. For instance, there are a number of users who have much larger number of followers than the number of users they are following (horizontal lines neary= 0). In addition, we can see a concentration of points near the diagonal, which represents the set of users who have a similar number of followers and followees. On the other hand, there is one notable difference: long vertical lines near x= 0. Such lines imply the existence of a number of users who are following a much larger number of users than the number of users that are following them.
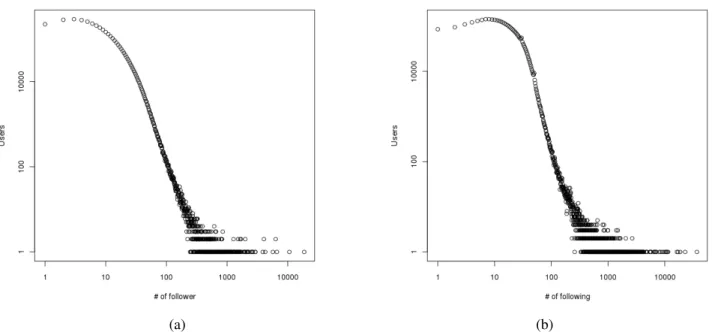
We also plotted a log-scaled degree distribution for both in- and out-degrees (Figure 2). These plots show that the Google Buzz network follows an approximate power law. The estimate of the power-law exponent for the in-degree distribution is 2.2 and the one for out-degree distribution
Figure 1. Scatter plot showing relationship between # of followers and # of followees.
is 1.8. These numbers imply that the distribution of out-degree has a longer tail to the right. Both exponents are large compared to other online social networks presented in [12] and [14], while they are smaller than the exponents for the WWW graph [6]. For Google Buzz, the magnitude of difference between the exponent for in-degree and out-degree are between the values for the WWW graph and other popular social networks. We can also see asymmetry in in-degree and out-in-degree, unlike other online social networks discussed in [12] and [14].
III. IMPACT OFPUBLICITYUPROAR
As mentioned in Section I-A, Google Buzz faced a significant event just after its launch. The March Dataset was collected close to the outpouring of adverse publicity with respect to Google Buzz privacy, and so we expected that changes between the two datasets would capture to some extent the impact caused by the huge privacy commotion. In this section, we investigate whether indeed how users’ privacy settings were changed by this publicity. Among a number of settings to control privacy in Google Buzz, we focus on the two toggles mentioned in Section I-A and discuss changes in these settings. Hereafter, we call users who hide the lists of followers and followees PA (privacy-aware) usersand users who do not have public profile pages as PA+ users. Users that are not PA or PA+ are called Non-PA (non-privacy-aware) users.
The changes between March and June are summarized in Table I. Although PA+ users can technically include users who have not yet set up their profile pages, users who have disabled their profile pages, and users who have dropped out of the Google Buzz service, in this table PA+ users in June
(a) (b)
Figure 2. (a) In-degree distribution (b) Out-degree distribution
are users who had a public profile page in March but did not have one in June. In other words, these are the users who opted out from Google Buzz or disabled their profile pages via the toggle between March and June. It is impossible for the crawler to distinguish them, but both are considered as users with strong privacy awareness. Thus, we treated them equally in this study.
Table I
SUMMARY OF CHANGES IN PRIVACY SETTINGS
June Non-PA PA PA+ Total
March
Non-PA 3,201,901 248,092 127,844 3,577,837 PA 107,227 1,203,376 64,752 1,375,355
From Table I, we can see there were 3,577,837 Non-PA users and 1,375,355 PA users in March, and that 375,936 users (10.5% of Non-PA users) in March tightened their privacy settings (i.e., switched from Non-PA to either PA or PA+) by June while 107,227 users (8% of PA users in March) moved in the other direction.
Hence, the fraction of users who tightened their privacy setting is comparable to the fraction who went in the other direction. This is somewhat surprising given the privacy uproar and the recent increase in news related to privacy in online social networks. In addition, the fraction of users who utilized the privacy toggle is28%, lower than in Facebook, which has a corresponding figure of40% [10].
IV. PRIVACYAWARENESS ANDPERSONAL
CHARACTERISTICS
Here we look into how users’ privacy awareness is reflected in visible personal characteristics in the system, namely contents of profile pages and users’ activeness.
A. Profile Attributes
To analyze user characteristics, we took advantage of Google Buzz’s profile pages. A typical Google Buzz pro-file contains a number of features characterizing a user, including the user’s name, affiliation, interests, location of residence, and so on, as well as Buzzes, short texts posted by a user. In our data, we extracted the 9 features listed in Table II out of users’ profile pages. For this study, we chose features that cover most of the content of the profile pages, but are not exhaustive. For instance, we ignored whether a user filled in “My superpower.” More features could be derived using more sophisticated techniques, but our results are not meant to be definitive and only indicate a baseline. The profile attributes of users who were PA clearly differ from those who were Non-PA. For instance, using the June Dataset, 52% of users with no public Buzzes were PA, compared with 15% for users with public Buzzes. For users who have not edited their profile (i.e., users who have 0 for all of 1, 2, 3, and 5 in Table II), 23% are PA, compared with 59% for users who have edited their profile somehow. This may imply that users that publish more information care about privacy more. We also observed the similar fractions for each of these four attributes. Next, we considered the problem of whether it is possible to predict privacy configuration as well as change in privacy configuration based on the profile attributes.
We used the Adaboost classifier to evaluate the predictive power of these attributes, as well as to identify the attributes important for prediction. Adaboost is a well-known discrim-inative binary classifier training algorithm that produces an ensemble of “weak” classifiers. Each weak classifier gets
(a) (b)
Figure 3. ROC curves for Adaboost classification. (a) NPA-to-PA vs NPA-to-NPA. (b) PA-to-NPA vs PA-to-PA.
Table II PROFILE ATTRIBUTES
No. Description Type
1 # of organization names on profile page Integer 2 # of links (URLs) to external web sites Integer 3 Whether a user has entered biographical text Boolean 4 Whether a user has uploaded a profile photo Boolean 5 Whether a user has entered any interests Boolean 6 # of photos uploaded Integer
7 # of Buzzes Integer, max 100
8 # of Likes for Buzzes Integer, max 100 9 # of Replies for Buzzes Integer, max 100
a weighted vote for the positive or negative category. The weights, and the parameters of the weak classifiers, are learned from labeled exemplars of the positive and negative categories. The overall ensemble works by accumulating the weighted votes and decides in favor of the winner. The details of the algorithm can be found in [9].
Adaboost works through iterations where weak classifiers are added to the ensemble as long as the weak classifiers are better than a random guess or until a preset number of classifiers have been added. In each iteration, correctly classified training exemplars are assigned lower weights, thus biasing the next classifier to pay more attention to the wrongly classified exemplars. While the weights are prescribed by the Adaboost algorithm, virtually any simple classifier training algorithm can be chosen to train the weak classifiers. In our experiments, the training algorithm considers a scalar feature, and finds the best single threshold comparison that will classify with the least error. This is done independently for every scalar attribute, and the best of these best-threshold classifiers is picked as the weak classifier. This empirically performs very well, often better than support vector classifiers, and has the advantage that we can examine which measured attributes get picked as most discriminative.
For our experiments in predicting change of privacy settings, we randomly sampled 500K users from the June Dataset and threw out users not in the March Dataset. This
left a sample of approximately338K users. We categorized them into 4 groups:
• NPA-to-PA: users who changed from Non-PA to PA between March and June
• NPA-to-NPA: users who were Non-PA in both March and June
• PA-to-NPA: users who changed from PA to Non-PA between March and June
• PA-to-PA: users who were PA in both March and June The number of users in each group is shown in Table III.
Table III
BREAKDOWN OF SAMPLED∼338KDATASET User Type Number of Users
NPA-to-PA 17,793
NPA-to-NPA 227,997
PA-to-NPA 7,628
PA-to-PA 84,930
We first tried to classify to-PA users against NPA-to-NPA users, i.e., users who hid their previously visible fol-lowers/followees against users who maintained visibility of their followers/followees. We used Adaboost with 10 weak classifiers and 10 iterations and the 9 features in Table II. The resulting ROC curve with 5-fold cross validation is shown in Figure 3(a). As can be seen, the performance is not significantly better than random guessing.
On the other hand, Figure 3(b) is the ROC curve for classifying PA-to-NPA users against PA-to-PA users, i.e., users who went from hiding their followers/followees to making them visible against users who continued to hide followers/followees. In this case, we can attain a 60% hit rate with a 17% false alarm rate. The number of replies on the user’s Buzz page contributes to the classification the most, followed by the number of Buzzes. Specifically, PA users with many replies and Buzzes on their profile are more likely to change to Non-PA.
other classification experiments in detail. However, we note that the number of replies is also highly weighted when classifying PA-to-PA users from NPA-to-NPA users as well as PA users in March from Non-PA users in March with over a 50% hit rate and less than 5% false alarm rate. Thus, we can consider it as an effective attribute to distinguish PA users and Non-PA users in general.
B. Activeness
We also investigated whether the degree of activity in the social network causes a difference in privacy awareness. To analyze this, we first needed to define a metric to measure activeness. Taking advantage of the profile attributes in Table II, we defined the simple sum of profile attributes 1 to 7 as the activeness of a user, considering updating profile and posting messages as activities.
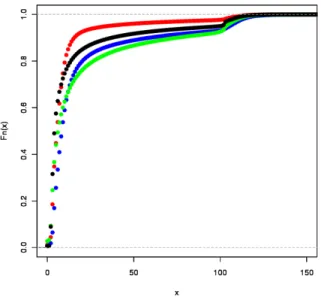
Figure 4. Empirical CDFs of user activenessx, defined as the sum of attributes 1 through 7 in Table II. The CDF for the PA-to-PA group is on top, followed by the NPA-to-NPA group, followed by the NPA-to-PA group, and finally the PA-to-NPA group. They are drawn in red, black, blue, and green, respectively.
Figure 4 shows the empirical cumulative density function for each of 4 user categories, namely (from top to bottom): PA-to-PA, NPA-to-NPA, PA-to-NPA, and NPA-to-PA. The bump around x= 100 is because the maximum value for the number of Buzzes was set to be 100. Since Google Buzz API returns a maximum of 100 Buzzes, for the sake of consistency with future data that might be crawled with the API, we set this upper bound. According to the figure, PA-to-PA users are least active on average, although there is no significant difference from the others in terms of median. Another interesting finding is that users who changed their privacy settings, i.e. NPA and PA-to-NPA, include a larger proportion of highly active users. Based on the definition of our metric and the fact that no
significant difference is observed when activeness is small, such differences are considered to be largely dominated by the number of Buzzes. This agrees with the findings in Section IV-A. In fact, while over 70% of PA-to-PA users have no Buzzes, over 65% of users in the other groups posted more than one Buzz, which may imply that users with many Buzzes are likely to be Non-PA or to change their privacy-related settings.
V. NEIGHBORINGEFFECTS
We also explored the influence of social network neigh-bors in changing privacy settings. As analyzed in [7] and [13], social-network neighbors can have an impact on peo-ple’s attitudes or preferences in the real world as well as in cyberspace. In Google Buzz, changes in a peer’s privacy settings are visible on the profile page, and influence via out-of-band communication between peers is also possible. There are many ways to investigate potential neighboring effects for privacy awareness; here, we focus on evaluating whether having many privacy-aware neighbors can encour-age users to change privacy settings or not.
To see the influence of neighbors that are privacy aware, we created plots, for Non-PA users in March, showing the fraction of users who switched from Non-PA to PA or PA+ between March and June (new-PA users) versus the number of neighbors not having a public profile page in March, which we call PA+ in-/out-degree. Since the total number of followers/followees (including users with no public profile page) is shown on each user’s profile page, we can calculate the PA+ in-degree (out-degree) of Non-PA users by subtracting the number of users in a follower (followee) list, which does not show users that do not have public profile pages, from the number shown in the corresponding user’s profile page. The plots are shown in Figure 5.
We observe clear increasing trends in both plots. The slope calculated through linear regression is 0.002 for in-degree and 0.001 for out-degree. We considered the PA+ degree only up to 50since the number of users whose in-/out-degrees are greater than50is very small. We observed similar increasing trends in plots when substituting PA for PA+. We conclude that users with more privacy-aware neighbors (either PA or PA+) are more likely to start to hide their followers/followees.
Other forms of neighboring effects are possible. For example, instead of being influenced by existing privacy aware neighbors as discussed above, a user could be influ-enced by change in neighbors’ privacy settings. We have a preliminary result in this direction: a subgraph consisting of new-PA users is more densely connected than a subgraph containing the same number of randomly sampled users. In fact, the number of edges within the new-PA graph is almost twice as many as the number of edges in the graph of randomly sampled users. We also observed the same trend
(a) (b)
Figure 5. (a) Fraction of new-PA users for # of PA+ followers. (b) Fraction of new-PA users for # of PA+ followees.
in clustering coefficients of these subgraphs. Thus, existence of a neighboring effect of this type is also implied.
VI. CONCLUSION ANDFUTUREWORK
We examined changes in users’ privacy-related settings in Google Buzz through analysis of two separate crawls of the network. Our preliminary analysis found that the privacy uproar against Google Buzz was not a critical factor in encouraging privacy awareness. We also demonstrated that privacy attitudes seem to be reflected by the contents of profile pages, by activeness, and by neighboring effects. Hence, change of privacy configurations is, at least to some extent, predictable based on readily available information.
Given our findings, it would be interesting future work to design a classifier that identifies privacy-aware users and non-privacy-aware users by integrating these findings and adding more features, for example, features that characterize changes over time and topic features obtained by apply-ing natural language analysis techniques over Buzzes and profiles. Extended longitudinal data would also be helpful for generalizing our results and understanding how privacy-related behavior evolves over a longer period of time.
REFERENCES
[1] EFF complaint. On the Web at http://www.eff.org/deeplinks/ 2010/02/protect-your-privacy-google-buzz.
[2] EPIC complaint. On the Web at http://epic.org/privacy/ftc/ googlebuzz/GoogleBuzz Complaint.pdf.
[3] Facebook Privacy: A Bewildering Tangle of Options. On the Web at http://www.nytimes.com/interactive/2010/05/12/ business/facebook-privacy.html.
[4] M. Bergmann. Testing privacy awareness. IFIP Advances in Information and Communication Technology, 298:237–253, 2009.
[5] J. Bonneau, J. Anderson, and G. Danezis. Prying data out of a social network. InIn ASONAM 2009: The 2009 International Conference on Social Network Analysis and Mining, 2009. [6] A. Z. Broder, R. Kumar, F. Maghoul, P. Raghavan, S.
Ra-jagopalan, R. Stata, A. Tomkins, and J. L. Wiener. Graph structure in the web. Computer Networks, 33(1-6):309–320, 2000.
[7] N. A. Christakis and J. H. Fowler. The Spread of Obesity in a Large Social Network over 32 Years. N Engl J Med, 357(4):370–379, 2007.
[8] C. Dwyer, S. R. Hiltz, and K. Passerini. Trust and privacy concern within social networking sites. InThirteenth Ameri-cas Conference on Information Systems, 2007.
[9] Y. Freund and R. E. Schapire. A decision-theoretic gener-alization of on-line learning and an application to boosting.
Journal of Computer and System Sciences, 55:119–139, 1997. [10] T. Govani and H. Pashley. Student Awareness of the Privacy Implications When Using Facebook. On the Web at http: //lorrie.cranor.org/courses/fa05/tubzhlp.pdf.
[11] B. Krishnamurthy, P. Gill, and M. Arlitt. A few chirps about Twitter. InWOSP ’08: Proceedings of the first workshop on Online social networks, pages 19–24, New York, NY, USA, 2008. ACM.
[12] A. Mislove, M. Marcon, K. P. Gummadi, P. Druschel, and B. Bhattacharjee. Measurement and analysis of online social networks. InProceedings of the 5th ACM/USENIX Internet Measurement Conference (IMC07), 2007.
[13] A. Nazir, S. Raza, and C.-N. Chuah. Unveiling Facebook: a measurement study of social network based applications. In
Internet Measurement Comference, pages 43–56, 2008. [14] C. Wilson, B. Boe, R. Sala, K. P. N. Puttaswamy, and
B. Y. Zhao. User interactions in social networks and their implications. InIn ACM EuroSys, 2009.