Network motifs in computational graphs: A case study in software architecture
Sergi Valverde1and Ricard V. Solé1,21ICREA-Complex Systems Lab, Universitat Pompeu Fabra, Dr. Aiguader 80, 08003 Barcelona, Spain 2
Santa Fe Institute, 1399 Hyde Park Road, New Mexico 87501, USA
共Received 1 July 2004; revised manuscript received 3 June 2005; published 8 August 2005兲 Complex networks in both nature and technology have been shown to display characteristic, small subgraphs 共so-called motifs兲 which appear to be related to their underlying functionality. All these networks share a common trait: they manipulate information at different scales in order to perform some kind of computation. Here we analyze a large set of software class diagrams and show that several highly frequent network motifs appear to be a consequence of network heterogeneity and size, thus suggesting a somewhat less relevant role of functionality. However, by using a simple model of network growth by duplication and rewiring, it is shown the rules of graph evolution seem to be largely responsible for the observed motif distribution.
DOI:10.1103/PhysRevE.72.026107 PACS number共s兲: 89.75.Fb, 89.20.Ff, 87.80.Vt
I. INTRODUCTION
Many natural and artificial systems are describable as net-works of interacting components 关1–4兴. The network is a medium that allows resource sharing often involving an ef-ficient transport of energy共metabolism, power grid兲, matter
共highways, airport webs兲, or information共cellular communi-cation, Internet兲. The architecture of complex networks can be explored at different scales, from the overall properties defined by average measures such as path length or cluster-ing, correlations, or degree distributions to the more funda-mental features displayed by small subsystems. In this con-text, it has been shown that some special, small subgraphs— so-called motifs—seem to be particularly relevant in describing the architecture of complex networks关5兴. Motifs have been suggested to be the functional building blocks of network complexity. Are some subgraphs more common than others because their functional relevance?
An alternative view is that the rules of network growth can by themselves favor some subgraphs with no special relation to the underlying functionality. Actually, this seems to be the case for the structure of the protein-protein interac-tion map. In spite of the fact that proteins perform funcinterac-tions, the overall architecture of the protein network is easily re-produced by means of a simple model of node duplication plus rewiring 关6兴. Such properties include scale freeness, small-world features, and even hierarchical organization and protomodularity关7兴. Mounting evidence suggests that many key features of complex networks共including motifs兲 might be strongly tied to the global network structure关8兴.
If functional constraints to network architecture have to be considered, one particularly relevant aspect of network complexity is associated with the presence of some underly-ing computational process. Computation is a key underly-ingredient of any complex adaptive system共CAS兲. By storing and pro-cessing information, CAS’s are able to predict共and adapt to兲 external fluctuations. Computation occurs in both natural and artificial systems关9兴, although the building process that cre-ates the computational structure is different. This is actually one of the most important points here: are the rules of de-signed and evolved systems completely different? Biological networks are largely originated through tinkering 关10–12兴: new components are obtained by re-using old ones, mainly
by duplicating them. In spite of the apparent limitations of such mechanisms, it allows one to discover good designs
关13兴. More complex computations can be developed as the network size is increased and new functions can emerge.
How is computation linked to network structure? Tenta-tive answers, to be developed here, can be obtained by look-ing at a very important class of computationally driven net-works: software systems. They offer a unique opportunity of exploring different levels of complexity with well-defined functional traits. As opposed to most examples of evolving computational networks, extensive databases storing soft-ware evolution registers exist and involve a high degree of detail. Here we analyze the largest data set of software maps explored to date共83 different systems兲. The main goal of our study is to see if functionality, as opposed to network evolu-tion, is a main constraint to the distribution of network mo-tifs in real graphs. The paper is organized as follows. In Sec. II an overview of the software systems analyzed here is given. In Sec. III, the statistical patterns of network motifs in a large set of software systems are presented and the pres-ence of scaling relations and the size-dependent frequency of motifs analyzed. In Sec. IV a model of duplication and re-wiring is used in order to reproduce the structure of motifs of a large software map. In Sec. V a general discussion is pre-sented.
II. SOFTWARE NETWORKS
Programming languages describe software systems 关14兴. Every computer program has a textual representation follow-ing syntactic rules dictated by a programmfollow-ing language关15兴. The program is decomposed in a number of simpler software entities or logical elements, which are given a unique name. Software entities include things as data objects, instructions, subprograms, or modules. A hierarchy or natural ordering between software entities is prompted by modern program-ming languages. At the lowest level, a program is viewed as a sequence of simple machine instructions. Sequences of re-lated instructions are enclosed in subprograms. At the highest level, there are modules or logical containers grouping sim-pler software entities. Often, modules are defined as func-tional blocks but there are no strict principles driving module composition.
It is useful to depict the complex structures defined in computer programs by means of a graph关16兴, where nodes represent software entities and links represent syntactical re-lationships between modules, subprograms, and instructions
共see Fig. 1兲. In this paper, we will focus on a particularly interesting subset of software entities: the collection of mod-ules and their static interactions共also called software archi-tecture兲. While it is widely acknowledged that software evo-lution depends on its architecture, very little is known about the cause and effect relationships between design practices and evolution outcomes关17兴. In order to understand the re-lation between structure and artificial evolution, we have en-visaged a network model of software architecture, hereafter called the software map or software network. Here, we show how the evolution of computer programs can be understood by recovering and analyzing their software networks at dif-ferent stages of development.
Following关16,18兴, Fig. 2 shows the text of an incomplete C⫹⫹ 关19兴 computer program 关see Fig. 2共a兲兴 and its corre-sponding software map 关see Fig. 2共b兲兴. The program text reads from left to right and top to bottom. The software network ⍀=共V,L兲 of this C⫹⫹ program is recovered by means of a very simple lexical analysis. First, we identify the vector of all module names 共also class in C⫹⫹兲 given by W=共wi兲=共point, chessmen, point, move, point, point, pawn, chessmen, move兲. Name ordering is important when recovering module dependences共see below兲. Names withat appear in the head of a module declaration provide the set of
network nodesV=兵vi其. These names共hereafter called mod-ule definitions兲 are easily identified because they are pro-ceeded by the C⫹⫹ keyword class. Remaining names are called module references. In this example, we have four共N =兩V兩= 4兲 unique module definitions: point 共w1兲, chessmen
共w2兲, move 共w4兲, and pawn 共w7兲. This defines a mapping from nameswk苸Wand network nodesvi苸Vin the software network.
The design of any nontrivial function involves the inter-action of at least two modules关20兴. Static module interac-tions can be depicted from relative posiinterac-tions of names inW. Let us assume thatwk苸兵w1,w2,w4,w7其 is a module defini-tion associated with node vi and wl苸兵w1,w2,w4,w7其 is a module reference associated with node vj. A directed link
兵vi→vj其苸Lsignals a dependence from module definitionwk to module referencewl. Link directionality reflects name or-dering in the C⫹⫹ program—that is, k⬍l. There are two types of module dependences: association共also “has a” rela-tionship兲or inheritance共or “is a” relationship兲. The purpose of these dependences is to establish a logical organization of the system. However, our analysis is centered an the study of topological patterns and does not take into account detailed relationship semantics. In an association, referenced nodevj is nested in the C⫹⫹ block of module vi. This block is always bracketed by the symbols 兵and其. In an inheritance, referenced nodevjalways follows theC⫹⫹sequence: public after the referencing nodevi 关see Fig. 2共a兲兴. Repeated links are not considered in the following analysis.
Software maps capture the topology of complex software systems. In particular, these maps provide a quantitative ap-proach to the evolution of technology. They are actually evolving entities and somewhat inhabit an intermediate zone between computing machines and neural structures. We have shown software networks to be scale free and small world
关16,18,21兴. Software networks can be described under a sta-tistical physics perspective.
III. SOFTWARE MOTIFS
In this section, we extend our previous topological studies by analyzing software networks at the level of network sub-graphs, or subsets of connected nodes in a network. The statistics of subgraphs provides important information about network structure. It has been claimed that overrepresented subgraphs 共i.e., motifs兲 signal key building blocks of net-works关5兴. This might be the case for regulatory networks, where specific subgraphs 共i.e., feed-forward loops兲 perform information processing functions 关22兴. A particular class of subgraphs, cycles, have received considerable interest. Cycli-cal dependences in software maps imply that a module is related to itself, which may be acceptable, unacceptable, or required关23兴. Ambiguity in the functional meaning of cycles suggests that subgraphs in software graphs are not strictly related to well-defined functions. The ubiquity of subgraphs in software networks seems to be a consequence of top-down mechanisms of software organization and not a consequence of selective pressures.
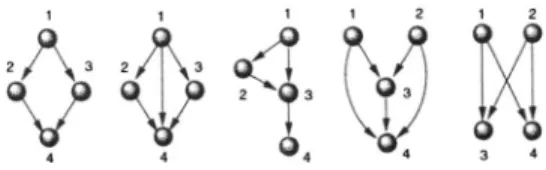
Following the method outlined in previous section, we have recovered and analyzed a large dataset of software FIG. 1. Examples of common network motifs withn= 4
ele-ments found in software graphs. Here each node is a class and arrows indicate static dependences among classes共see text兲.
FIG. 2.共a兲A piece ofC⫹⫹code from a chess-playing program and共b兲the corresponding software map or network model display-ing the collection of modules and their logical dependences. The only information required to recover the software map is the set of module names关highlighted in bold in共a兲兴and their relative loca-tions in theC⫹⫹program共see text兲. Notice how nodes are labeled with their names and links are decorated with relationship type.
maps 兵⍀其 from 83 reverse-engineered C⫹⫹ software sys-tems. A given graph can be characterized by a degree se-quence. For the whole graph⍀each node has a degree se-quence given by the in-degree list兵Ki其and the out-degree list
兵Ri其 共withi= 1 , . . . ,N兲. The lists would be completed by the so-called mutual edges兵Mi其—i.e., cases where there is a pair of edges in both directions between two nodes. For each subgraph⍀i傺⍀of sizen 共heren= 3 , 4兲, another degree se-quence would be provided by two new lists, now兵kj其and兵rj其 for the in- and out-degrees, respectively. For example, for the left subgraph in Fig. 1, we would have兵kj其=兵0 , 1 , 1 , 2其and
兵rj其=兵2 , 1 , 1 , 0其.
Network motifs are defined in terms of subgraphs which appear much more often than expected from pure chance. Specifically, they occur with a high frequency compared with the expected from an ensemble of randomized graphs with identical degree structure关5兴. The random networks are gen-erated by means of the switching rule. For every pair of links i→jandu→vin the original software network, we add the
pair i→v and j→u in the randomized network. This rule keeps intact the in- and out-degree sequences but destroys degree-degree correlations. The statistical significance of a given subgraph⍀iis described by itsZscore关5兴, defined as
Z共⍀i兲=
Nreal共⍀i兲−具Nrand共⍀i兲典
关Nrand共⍀i兲兴
. 共1兲
Here Nreal共⍀i兲 is the number of times the subgraph ap-pears in the network, whereas 具Nrand共⍀i兲典 and关Nrand共⍀i兲兴 refer to the mean and standard deviation共SD兲of its appear-ances in the randomized ensemble, respectively. In order to be significant, it is required that 兩Z共⍀i兲兩⬎2. When Z共⍀i兲 ⬎2 关Z共⍀i兲⬍−2兴 the motif 关antimotif兴 is considered to be more关less兴common than expected from random. In Fig. 3 the results from our analysis are shown for some typical software networks. A handful of these subgraphs appear to be present in all software systems analyzed and also in both electronic circuits and biological networks involving compu-FIG. 3. Network motifs withn= 3 , 4 elements found in software graphs. The numbers of node and edges for each network are shown. The most frequent motifs were classified in distinct rows for each type of system: medium software systems, large software systems, gene regulatory nets, neural networks, and digital electronic circuits. For each motif, we display the number of occurrences in the network共Nreal兲, the number of occurrences共Nrand± SD兲in a set of 100 randomized network versions, and a qualitative measure of its statistical significance
as given by theZscore共see text兲. Medium and large software networks share a large amount of motifs but we found larger variability in the medium data set. A remarkable difference is motif 2190共the last motif in the second row兲, which appeared only in the context of large software systems.
tation. This is the case of Bi-parallel共S904兲, Bi-fan共S204兲, the feed-forward loop共S38兲, and its close variants共such as S2186 and S408兲. Such a common point might be easily interpreted in functional terms: similar subgraphs are abun-dant because they are selected or chosen to perform a given function or task. As shown below, no evidence from statisti-cal patterns supports such view.
Assuming sparse graphs 共具K典ⰆN兲, the probability of a given subgraph ⍀i can be estimated. Following Itzkovitz et al.,关24兴we can see how this is calculated using the first subgraph in Fig. 1. Here we have兵Kj其=兵2 , 1 , 1 , 0其 and兵Rj其 =兵0 , 1 , 1 , 2其. The idea is to compute the different probabili-ties associated with each directed edge linking all pairs of nodes. For example, the probability of having a directed link from node 1 to node 2共for K1RⰆN具K典兲 is approximately
P共1→2兲=K1R2
N具K典, 共2兲 which can be interpreted as follows 关24兴: we perform K1 attempts for the first node to connect to the target node with a probabilityR2/N具K典. Similarly, we would have
P共1→3兲=共K1− 1兲R3
N具K典 共3兲 being the approach used for all edges. The average number of appearances of ⍀i is finally computed by averaging. Itzkovitzet al.关24兴have shown that the average number of appearances具G典of a given subgraph is given by a product of moments of different orders of the in-degree, out-degree, and mutual degree distributions:
具G典 ⬃Nn−ga−gm具K典ga具M典gm
兿
j=1 n冓
冉
Ki kj冊冉
Ri rj冊冉
Mi mj冊
冔
i , 共4兲 wheregaandgmare the number of single and mutual edges. The approximation assumes uncorrelated, sparse networks共具K典ⰆN兲. Both conditions are met by software maps 关25兴. These mean-field quantities can be used as a null model es-timate of the number of motifs and, eventually, to detect stray, significant deviations form randomness. Since different motifs are found in different systems 关5兴, they can actually allow us to identify the basic functional blocks for a given class of networks.
By exploring our collection of software graphs, we deter-mined 具G典 for real nets 共indicated as Nreal in Fig. 2兲 and compared them toNrand. Here software maps with a sizeN ⬎10 have been analyzed. Two groups have been chosen, involving medium-sized graphs 共N⬍300兲 and large graphs
共N⬎300兲. The previous set is compared with results from other networks involving computational tasks. Here previous results for both gene and neural networks are also shown for comparison共data from关5兴兲. The reason for using biological networks as a reference system is twofold. First, the chosen systems are known to perform computational tasks共or can be described by means of an equivalent computational circuit兲. The second is that it has been conjectured that both natural and artificial networks might share some commonalities re-lating the mechanisms that shape their evolution关12兴.
Com-mon features might reflect comCom-mon functional traits, but also
共as shown below兲common rules of graph evolution with no special functional meaning.
In order to explore the question of how relevant the over-all network structure is in conditioning the frequency of given subgraphs, we should consider the global structure of the network. The first approximation is to consider the de-gree of heterogeneity as provided by the distribution of links. Software systems have a well-defined scale-free indegree distribution
Pi共k兲=
␥i− 1 k01−␥i 共k+k0兲
−␥i, 共5兲
with␥i⬃2. A mean value具␥i典= 2.09± 0.05 has been obtained by averaging over all the systems studied here. The distribu-tion of scaling exponents is strongly peaked around ␥i= 2. The out-degree distributionPo共k兲is much steeper and seems better described by a broad scale distribution, not far from the exponential limit. This is actually the opposite situation considered in 关24兴 but is not difficult to show that it is es-sentially symmetric in the theoretical treatment.
For the regime considered here, it was shown that 具G典 follows a scaling law
具G典 ⬃N␣. 共6兲
Specifically, for a given pair兵n,g其and a given scaling expo-nent, we have
具G典 ⬃Nn−g+s−␥i+1, 共7兲
wheresis the maximum in-degree for our case. This scaling is actually valid for 2⬍␥i⬍s+ 1.
Four examples of the observed scaling laws are shown in Fig. 4 for different software motifs. Using Eq. 共3兲 the ex-pected number of times a given motif appears would scale as
具G典⬃Ns+1−␥i and using the scaling exponent ␥ i
⬇2.09± 0.06 a scaling law具G典⬃N␣ would be predicted for uncorrelated, sparse graphs. Here we use our set of systems1 whose size will be indicated asni共i= 1 , . . . , 83兲 共number of nodes of each graph兲. For convenience, we order the systems by increasing size共i.e.,ni⬍ni+1兲. If G共ni兲 is the number of times a given subgraph appears in theith system共of sizeni兲, we should expect a scaling relation G共ni兲⬃ni␣. In order to reduce the noise level we will use the cumulative distribution
Gcum共N兲=
兺
ni艋NG共ni兲. 共8兲 The cumulative distribution should scale as G⬃N␣c with ␣c⬇␣+ 1. As shown in Fig. 4, the predicted scaling is recov-ered from real data, thus indicating that the average trends are consistent with the expectation from random scale-free networks. It confirms the validity of the prediction of Itzkovitzet al.关24兴and its agreement with a set of real net-works. This agreement is an interesting result, particularly if
1
Although a total of 83 systems have been used, the presence of a specific subgraph is size dependent. Not all systems exhibit all sub-graphs: for small software maps some subgraphs are absent. S. VALVERDE AND R. V. SOLÉ PHYSICAL REVIEW E72, 026107共2005兲
we remember that this is adesignedsystem to perform given functions. The fact that we obtain the scaling law expected for the random, scale-free graph reveals that the observed scaling in motif abundances are a consequence of top-down constraints derived from graph evolution.
IV. DUPLICATION-BASED EVOLUTION
The topology of software architecture emerges from de-signed evolution. On top of the process, there must be a basic building plan towards a final function or set of functions. The engineer foresees the outcome of its work. But there are a number of strong constraints no less important and operating through the software building process. On the one hand, modular structures are shaped through parallel paths of evo-lution. Different blocks will be involved in more specific subfunctions. On the other hand, increased complexity leads to conflicts between different subparts. This is reflected, for example, at the topological level: small software maps tend to display tree structure, whereas larger systems typically display much more complex patterns 关16兴. The common overall structure detected in software graphs in terms of the degree distribution 共and other average properties兲 suggests that the final topological patterns might be strongly con-strained.
We conjecture that the abundance of subgraphs in soft-ware networks relates to universal mechanisms of network
growth underlying their evolution. Real software maps tend to display motif generalizations or subgraphs having an structure comprising many replicas of the four motifs ob-served here. These structures are highly redundant. This sug-gests a very simple duplication-based mechanism of sub-graph generation. New modules depend upon other modules in order to provide useful functionalities. And it seems rea-sonable to assume that similar modules will share a large number of module dependences. In a related software engi-neering study关26兴, structural similarities inC⫹⫹software at the module 共class兲 level have been analyzed. They have found quantitative evidence of structural duplications. How-ever, they did not provide any model explaining the origin of duplications.
Figure 5 shows a detailed example illustrating how top-down duplication works in software development. Imagine we want to add a new software module representing the queen, in the previous chess-playing program关see Fig. 2共a兲兴. First, we will add a new module declaration, which is con-veniently namedqueen关see Fig. 5共a兲兴. Because a queen is a type of chessman, it seems reasonable to make this module depend upon the same modules referenced by similar mod-ules, which in this case is the pawn. By using the pawn module and its neighborhood as a template, we add an inher-itance relationship from the queen to the chessman关see Fig. 5共b兲兴. Duplication is completed with the addition of a col-laboration relationship from queen to move关see Fig. 5共c兲兴. Comparison between final network关see Fig. 5共c兲兴 with the initial network共see Fig. 2兲reveals a new biparallel subgraph and twice the number of bifan subgraphs.
FIG. 4. Scaling in the number of appearances of a given motif against network size. Here four common motifs 共each indicated兲 have been considered over the sample set关24兴. Here we have S904 withn= 4,g= 4, ands= 2; S472, withn= 4, g= 5, ands= 2; S206, withn= 4, g= 5, and s= 2; S2186, withn= 4, g= 4, and s= 3. The predicted exponents 共using the average scaling exponent for the in-degree distribution ␥i⬇2.1兲 would be ␣共S904兲= 0.9, ␣共S472兲 =␣共S206兲= 0.1, and␣共S2186兲= 2.1, respectively. Using the cumu-lative number of graphs, Gcum 共see text兲, we obtain ␣c共S904兲
= 1.86± 0.16, ␣c共S472兲= 0.97± 0.07, ␣c共S206兲= 1.18± 0.17, and ␣c共S2186兲= 3.12± 0.11, in good agreement with the predicted
val-ues. The fit was made using least squares on a log-log scale.
FIG. 5. From共a兲to共c兲, an illustration of the duplication mecha-nism in software map evolution. Time flows from top to bottom. Here, a new modulequeenis introduced by cloning the links of the similar modulepawn. Every stage displays the evolvingC⫹⫹ pro-gram共right兲 and its corresponding software network 共left兲 recon-structed by the method described in Sec. III. New text is enclosed in a box. Note how duplication of links in the software map is parallel to duplication of code in theC⫹⫹program.
An example of this process taking place in real software development is shown in Fig. 6. Here a given subsystem inside a growing software graph is displayed at different de-velopment stages. Duplication of nodes seems to be at work, as well as further removal of many links associated with a given hub. Fromc to d a duplication of the hub involving many incoming links has taken place 共together with some further node addition兲. Fromd throughi, it is evident how a large number of new classes were added by copying the pat-tern of single nodes connected to two central hubs. There is extensive rewiring in some stages, such as in f, where the lower hub losses a large fraction of in-links. Moreover, there is also the addition of new connections between existing nodes共see h→i兲. The whole sequence spans 1 year of de-velopment. The main observation from this example共which is a typical one兲is that node duplication plus rewiring, par-ticularly link removal, is widespread. This is also the case in the evolution of cellular networks关6兴.
Examples like the previous one suggest that duplication-divergence growth is the cause of the observed subgraph abundances in software maps. This hypothesis can be tested by comparing the distribution of subgraphs in real networks with those obtained with a stochastic model of network growth based on asymmetric duplication-divergence rules, previously described in关6兴. First, an initial random共or back-bone兲 network of m0⬍N nodes is created. This random graph is generated by the addition of nodes with degreek0 = 2, every link pointing to a random target node关27兴. This backbone posses a treelike structure共as occurs with software
maps at the beginning of their evolution兲. Starting from this backbone, we apply the following rules at each iteration of the model.
共i兲 Duplication. A randomly chosen target node v is cloned, and the new nodewattaches to all the neighbors of the target node.
共ii兲 Divergence. For each pair of original and redundant links remove one of them with probability␦.
共iii兲 Cross linking. In addition, the target and new node are linked共w→v兲with probability. This rule is important in order to generate triads or 3-subgraphs.
In spite of the simple set of rules implicit in the duplica-tion model, the frequencies of subgraphs obtained from our in silicosystem are remarkably close to those seen in their real counterparts. In Fig. 7, we have compared the concen-tration of 4-subgraphs expressed in various software net-works and the concentration of 4-subgraphs predicted with the duplication-based evolution model. These plots were ob-tained with the following method. We generate 400 graphs, 100 for each of four different software networks: Blender, Filezilla, GTK, and Exult关28兴. Each synthetic graph has the same number of links L and number of nodes,N, as mea-sured in the corresponding software map and no further con-straints are imposed. The parameter space is sampled uni-formly. Once the synthetic networks are obtained, we perform a 4-subgraph census by counting the number of ap-pearances of each 4-subgraph ⍀i in the model and in the synthetic network. Notice that we do not test for statistical significance共as in the motif analysis兲. Instead, our compari-son test is based solely on raw subgraph counts. In order to compare the two systems, the raw number of subgraphs of size 4 is computed and the concentration C of subgraphs evaluated. Here, the concentration is simply the number of appearances of the 4-subgraph over the total number of 4-subgraphs found.
In Fig. 7, each point represents the pair
共Cobserved,Cpredicted兲of observed and predicted concentrations for given 4-subgraph⍀i. Specifically, we display the set of FIG. 6. A real instance of software network growth from a
well-defined subsystem of Prorally关16兴showing duplication. Evolution goes from top to bottom and left to right. Only the largest connected component is displayed here. The figure shows how the target hub in 共c兲 has been duplicated in 共d兲 共both nodes highlighted with a dotted box兲. Many duplicated nodes involve less connected targets 关see共g兲and共h兲兴.
FIG. 7. Comparison of observed and predicted共from a duplica-tion model兲4-motif concentrations for共a兲Blender,共b兲Filezilla,共c兲 GTK, and共d兲 Exult 共here concentrations are rescaled by⫻10−3兲. The exponents for the least-squares fit are共a兲 = 0.94± 0.12,共b兲 = 0.92± 0.13,共c兲= 0.96± 0.11, and共d兲= 1.14± 0.12, respectively. S. VALVERDE AND R. V. SOLÉ PHYSICAL REVIEW E72, 026107共2005兲
pairs and the power law fitCpred⬃Cobs . Despite fluctuations, the simple duplication model presented here predicts reason-ably well the concentration of common software network motifs: the value of the exponentis reasonably close to 1 in all cases. This is remarkable, given the oversimplification considered here and given the limited constraints imposed to the selected model graphs to be compared with the real ones. The error bars grow as less common subgraphs are used. If we restrict ourselves to C⬎10−3, the exponent becomes much closer to 1. Specifically, we obtain now 共a兲 = 0.96± 0.11,共b兲 = 0.97± 0.10,共c兲= 0.98± 0.12, and 共d兲 = 1.06± 0.18, respectively. Consistently with previous work
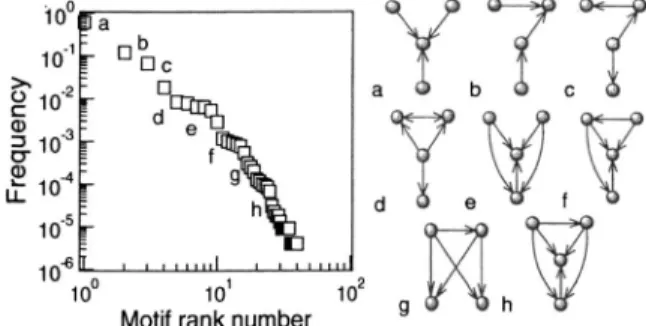
关8兴, less common subgraphs are typically more dense 共have more links兲. In Fig. 8 an example of this correlation is shown for Exult. Using a frequency-rank plot of 4-subgraphs, we can see that subgraphs with high frequencies have few links whereas higher ranks共small frequencies兲are associated with dense subgraphs.
V. DISCUSSION
In this paper we have analyzed the statistical patterns of network motifs in a large set of software diagrams. Software maps have been previously shown to be scale free and dis-play small-world behavior关16,18,21兴but no previous analy-ses focused on the small-scale architecture. The main goal of our study is to explore the relevance of graph evolution in relation with true functionality. Our study actually suggests that dynamical rules, with little relation to underlying func-tional constraints, largely determine the frequency of motifs in software graphs.
By using recent theoretical and numerical methods to measure and characterize network motifs, we have found the following.
共i兲 A number of network motifs are obtained, the most common being shared with other共natural兲systems involving computational traits, such as genetic and neural networks.
共ii兲The number of appearances of a given network motif scales as具G典⬃Nn−g+s−␥i+1, in agreement with previous cal-culations for random graphs with scale-free degree distribu-tions. This result is supported by previous observations of the uncorrelated character of software maps.
共iii兲 Evidence from software evolution suggests that du-plication and rewiring, as occurs with some cellular net-works, might play a key role in shaping software maps. Us-ing a previous model of network growth by duplication and diversification, it has been shown that it fits rather well the frequencies of the appearance of network motifs.
Previous studies have proposed the idea that network mo-tifs seem to define the minimal, meaningful building blocks of network complexity. Perhaps not surprisingly we often find them as the basic structures associated with specific functional traits, from computation to pattern formation. The former is exemplified by feed-forward loops, a three-element motif found in genetic regulatory systems关22,29兴. The latter is actually a particularly relevant example. However, since the statistical distribution of network motifs involves dealing with large numbers of different subgraphs, the question of how motifsin generalmight reflect functional traits requires the formulation of appropriate null models of graph evolu-tion. Such models must ignore any functional trait in order to test the possibility that the global properties of network structure共such as graph heterogeneity兲might strongly influ-ence what we should expect.
The model chosen here has been a duplication-rewiring one关6兴. These models have been shown to generate hetero-geneous graphs with many properties close to relevant bio-logical systems such as protein-protein interaction maps. Network heterogeneity is largely due to effective preferential attachment. Additionally, the rules of duplication strongly bias the types of motifs to be formed towards some special subsets. The final consequence is that the patterns of network motifs generated by the duplication model might be able to explain共in statistical terms兲the observed abundances of mo-tifs, with no further requirement of functional constraints. The fact that biological systems, also involved in performing computations, have common motifs might support this view. Although sharing common motifs seems to call for common functionalities, it is important to remember that biological structures are largely generated through tinkering 关10,11兴. Protein interaction networks grow by gene duplication, and neural networks also experience increases of cell numbers together with wide synaptic changes. Perhaps the common traits are a by-product of the common tinkered evolution based on extensive reuse and copy of available structures.
One final comment concerns with the common subgraphs also shared by digital circuits. They are not obtained, strictly speaking, through a process of duplication and rewiring. Al-though the way complex circuits are built does include some amount of reuse,2considerations involving low cost in links are of fundamental importance. In spite of such constraints, it has been shown that electronic circuits have small-world structure and are also highly heterogeneous 关30兴. Previous work seems to indicate that optimal design towards efficient
2
As circuit complexity increases共both in terms of number of com-ponents and computational tasks兲 it becomes more difficult to de-sign from scratch choosing sets of small gates and building optimal, low-cost circuits. Predefined gates involving well-known 共and sometimes complex兲 input-output functions are widely used and assembled together. In that sense, some amount of re-use is at work. FIG. 8. Frequency-rank distribution of network subgraphs in a
software network共䊐兲. Here the most frequent subgraph has rank 1, the second has rank 2, etc. The frequencyP共r兲 of a subgraph with rankrdecays rapidly with subgraph rank. An interesting feature is that most common subgraphs are sparser than less common ones, which are more dense.
communication at low cost can generate scale-free, heteroge-neous architectures 关31,32兴. Such result suggests again that network heterogeneity might pervade motif abundances关33兴.
ACKNOWLEDGMENTS
We thank Maggie Fitzgerald, Frankie Dunn, and Eddie Scrap for useful input. We also thank Shalev Itzkovitz for a
careful reading and comments on an earlier version of the manuscript. The analysis of network motifs has been done using available free software from Uri Alon’s Lab共seehttp:// www.weizmann.ac.il/mcb/UriAlon/index.html兲. This work has been supported by Grant No. FIS2004-05422 and by the EU within the 6th Framework Programme under Contract No. 001907, “Dynamically Evolving, Large Scale Informa-tion Systems”共DELIS兲.
关1兴S. N. Dorogovtsev and J. F. F. Mendes,Evolution of Networks: From Biological Nets to the Internet and WWW共Oxford Uni-versity Press, New York, 2003兲.
关2兴R. Albert and A. L. Barabási, Rev. Mod. Phys. 74, 47共2002兲. 关3兴M. E. J. Newman, SIAM Rev. 45, 167共2003兲.
关4兴S. Bornholdt and G. Schuster,Handbook of Graphs and Net-works, edited by共Wiley-VCH, Berlin, 2002兲.
关5兴R. Milo, S. Shen-Orr, S. Itzkovitz, N. Kashtan, D. Chklovskii, and U. Alon, Science 298, 824共2002兲.
关6兴R. V. Solé, R. Pastor-Satorras, E. D. Smith, and T. Kepler, Adv. Complex Syst. 5, 43共2002兲; A. Vazquez, A. Flammini, A. Maritan, and A. Vespignani, Complexus 1, 38 共2003兲; R. Pastor-Satorras, E. D. Smith, and R. V. Solé, J. Theor. Biol.
222, 199共2003兲; J. Kim, P. L. Krapivsky, B. Kahng, and S. Redner, Phys. Rev. E 66, 055101共2002兲; K.-I. Goh, B. Kahng, and D. Kim, e-print q-bio.MN/0312009, v2; W. Banzhaf and P. Dwigth Kuo, J. Biol. Phys. Chem. 4, 85共2004兲.
关7兴R. V. Solé and P. Fernandez共unpublished兲. See also R. Gui-mera, M. Sales-Pardo, and L. A. N. Amaral, Phys. Rev. E 70, 025101共2004兲.
关8兴A. Vázquez et al. Proc. Natl. Acad. Sci. U.S.A. 101, 1794 共2004兲.
关9兴B. Hayes, Am. Sci. 89, 204共2001兲. 关10兴F. Jacob, Science 196, 1161共1976兲.
关11兴D. Duboule and A. S. Wilkins, Trends Genet. 14, 54共1998兲. 关12兴R. V. Solé, R. Ferrer, J. M. Montoya, and S. Valverde,
Complexity 8, 20共2002兲.
关13兴U. Alon, Science 301, 1866共2003兲. 关14兴A. V. Aho, Science 303, 27共2004兲.
关15兴A. V. Aho, R. Sethi, and J. D. Ullman,Compilers: Principles,
Techniques and Tools 共Addison-Wesley Longman, Boston,
1986兲.
关16兴S. Valverde, R. Ferrer-Cancho, and R. V. Solé, Europhys. Lett.
60, 512共2002兲.
关17兴C. F. Kemerer and S. Slaughter, IEEE Trans. Software Eng.
25, 493共1999兲.
关18兴S. Valverde and R. V. Solé共unpublished兲.
关19兴B. Stroustrup,The C⫹⫹ Programming Language共 Addison-Wesley, Reading, MA, 1986兲.
关20兴E. Gamma, R. Helm, R. Johnson, and J. Vlissides, Design
Patterns Elements of Reusable Object-Oriented Software 共Addison-Wesley, New York, 1994兲.
关21兴C. R. Myers, Phys. Rev. E 68, 046116共2003兲.
关22兴S. Shen-Orr, R. Milo, S. Mangan, and U. Alon, Nat. Genet.
31, 64共2002兲.
关23兴J. Lakos, Large Scale C⫹⫹ Software Design 共 Addison-Wesley, New York, 1996兲.
关24兴S. Itzkovitz, R. Milo, N. Kashtan, G. Ziv, and U. Alon, Phys. Rev. E 68, 026127共2003兲.
关25兴All software maps analyzed here共and others studied by other authors兲have been shown to be sparse. Correlations have been also analyzed in R. V. Solé and S. Valverde, inComplex Net-works, edited by E. Ben-Naim, H. Frauenfelder, and Z. Toroc-zkai, Lecture Notes in Physics 共Springer, Berlin, 2004兲, pp. 169–190. Using statistical measures derived from information theory, it was shown that software maps are considerably un-correlated.
关26兴F. Fioravanti, G. Migliarese, and P. Nesi, inProceedings of the 23rd International Conference on Software Engineering (ICSE’01), IEEE, May 12–19,Toronto, 2001, edited by Hausi A. Müller共IEEE, New York, 2001兲.
关27兴D. S. Callaway, J. E. Hopcroft, J. M. Kleinberg, M. E. J. New-man, and S. H. Strogatz, Phys. Rev. E 64, 041902共2001兲. 关28兴The source code is available at the following web sites: http://
www.blender.org 共Blender兲, http://filezilla.sourceforge.net 共Filezilla兲, http://www.gtk.org 共GTK兲, and http:// exult.sourceforge.net共Exult兲.
关29兴S. Mangan and U. Alon, Proc. Natl. Acad. Sci. U.S.A. 100, 11980共2003兲.
关30兴R. Ferrer, C. Janssen, and R. V. Solé, Phys. Rev. E64, 046119 共2001兲.
关31兴R. Ferrer and R. V. Solé, in Statistical Physics of Complex Networks, edited by R. Pastor-Satorras, M. Rubi, and A. Diaz-Guilera, Lecture Notes in Physics共Springer, Berlin, 2003兲, pp. 114–125.
关32兴R. V. Solé and S. Valverde, inComplex Networks, edited by E. Ben-Naim, H. Frauenfelder, and Z. Toroczkai, Lecture Notes in Phyics共Springer, Berlin, 2004兲, pp. 169–190.
关33兴H. B. Fraser, A. E. Hirsch, L. M. Steinmetz, C. Scharfe, and M. W. Feldman, Science 296, 750共2002兲.