Analysis of Clickstream Data
JAMALZADEH, MOHAMMADAMINHow to cite:
JAMALZADEH, MOHAMMADAMIN (2011) Analysis of Clickstream Data, Durham theses, Durham University. Available at Durham E-Theses Online: http://etheses.dur.ac.uk/3366/
Use policy
The full-text may be used and/or reproduced, and given to third parties in any format or medium, without prior permission or charge, for personal research or study, educational, or not-for-prot purposes provided that:
• a full bibliographic reference is made to the original source • alinkis made to the metadata record in Durham E-Theses
• the full-text is not changed in any way
The full-text must not be sold in any format or medium without the formal permission of the copyright holders. Please consult thefull Durham E-Theses policyfor further details.
Academic Support Oce, Durham University, University Oce, Old Elvet, Durham DH1 3HP e-mail: [email protected] Tel: +44 0191 334 6107
Amin Jamalzadeh
A Thesis presented for the degree of
Doctor of Philosophy
Statistics Group
Department of Mathematical Sciences
University of Durham
England
October 2011
Amin Jamalzadeh
Submitted for the degree of Doctor of Philosophy
October 2011
Abstract
This thesis is concerned with providing further statistical development in the area of web usage analysis to explore web browsing behaviour patterns. We received two data sources: web log files and operational data files for the websites, which contained information on online purchases. There are many research question regarding web browsing behaviour. Specifically, we focused on the depth-of-visit metric and implemented an exploratory analysis of this feature using clickstream data. Due to the large volume of data available in this context, we chose to present effect size measures along with all statistical analysis of data. We introduced two new robust measures of effect size for two-sample comparison studies for Non-normal situations, specifically wherethe difference of two populations is due to the shape parameter. The proposed effect sizes perform adequately for non-normal data, as well as when two distributions differ from shape parameters. We will focus on conversion analysis, to investigate the causal relationship between the general clickstream information and online purchasing using a logistic regression approach. The aim is to find a classifier by assigning the probability of the event of online shopping in an e-commerce website. We also develop the application of a mixture of hidden Markov models (MixHMM) to model web browsing behaviour using sequences of web pages viewed by users of an e-commerce website. The mixture of hidden Markov model will be performed in the Bayesian context using Gibbs sampling. We address the slow mixing problem of using Gibbs sampling in high dimensional models, and use the over-relaxed Gibbs sampling, as well as forward-backward EM algorithm to obtain an adequate sample of the posterior distributions of the parameters. The MixHMM provides an advantage of clustering users based on their browsing behaviour, and also gives an automatic classification of web pages based on the probability of observing web page by visitors in the website.
The work in this thesis is based on research carried out at the Statistics Group, the Department of Mathematical Sciences, Durham University, England. No part of this thesis has been submitted elsewhere for any other degree or qualification and it all my own work unless referenced to the contrary in the text.
Copyright c 2011 by Amin Jamalzadeh.
“The copyright of this thesis rests with the author. No quotations from it should be published without the author’s prior written consent and information derived from it should be acknowledged”.
First and foremost I offer my sincerest gratitude to my supervisor, Dr. David Wooff, whose encouragement, guidance and support from the initial to the final level enabled me to develop an understanding of the subject. I am also thankful to my second supervisor, Dr. Peter Craig, who gave me useful guidance in several stages throughout my thesis with his patience and knowledge. This thesis would not have been possible without data set provided by SAYU company. I would also like to thank Gerda Arts who raised up the initial research question for me in this subject.
I gratefully acknowledge Mathematical science department for providing support and equipment I have needed to produce and complete my thesis. I would like to show my gratitude to Sharry Borgan for providing me the opportunity of gaining teaching experience during my study, as well as his support during teaching period. I have received a lot of support from IT specialists in the mathematical science department: Brian Rogers, Bernard Piette, and Mark Short, for which I am much appreciative. I would also like to thank our cleaning staff, Pamela and Michael, whose friendly smiles and morning hellos never failed to work our day.
I would like to thank my parents for all their love and encouragement. It was they who raised me with a love of science and supported me in all my pursuits and put me in the road of education. I offer special thanks to very my close friend, Shiler, who encouraged me to apply to Durham University and has been a great support during four years of living and studying at Durham. Lastly, I offer my regards and blessings to all of those who supported me in any respect during the completion of this project.
Amin Jamalzadeh
Abstract iii
Declaration iv
Acknowledgements v
1 Clickstreams: New Source of Data in E-Commerce 1
1.1 Introduction . . . 1
1.2 Web Mining . . . 4
1.2.1 Web Usage Mining . . . 4
1.2.2 Web Content Mining . . . 6
1.2.3 Web Structure Mining . . . 7
1.3 Clickstream Data . . . 7
1.3.1 Web Server Log Files . . . 8
1.3.2 Preprocessing . . . 11
1.3.3 Data Structures . . . 19
1.4 SLC User-Session Data . . . 22
1.5 Thesis Outline . . . 23
2 Metrics and Reports Using Clickstream Data 25 2.1 Introduction . . . 25
2.2 Navigation Metrics and Reports . . . 26
2.2.1 Website traffic . . . 26
2.2.2 Website stickiness/slipperiness . . . 27
2.2.3 Recency and frequency . . . 29
2.2.4 Conversion and Profitability . . . 33
2.3 Trend and Segmentation Reports . . . 35
2.3.1 Segmentation Reports . . . 36
2.3.2 Trend Reports . . . 38
2.4 Web Page and Traversal Reports . . . 40
2.5 Discussion . . . 42
3 Analysis of Clickstreams: Depth of Visit 43 3.1 Introduction . . . 43
3.2 Distribution of Number of Pages Visited . . . 44
3.2.1 Graphical representation . . . 45
3.2.2 The Weibull distribution . . . 47
3.2.3 Parameter estimation . . . 48
3.2.4 Goodness-of-fit test . . . 53
3.2.5 Effect size for goodness-of-fit . . . 55
3.3 Analysis of Session Time Duration . . . 56
3.3.1 Relationship with Number of pages visited . . . 56
3.3.2 Session time duration for sub-population . . . 68
3.4 Discussion . . . 72
4 Robust and Scale-free Effect Sizes: Clickstream Analysis 73 4.1 Introduction . . . 73
4.2 Effect sizes for the two-sample comparison . . . 76
4.2.1 Cohen’s d and dr . . . 76
4.2.2 Robustness . . . 77
4.2.3 Common language effect size . . . 78
4.2.4 Non-overlap effect size . . . 78
4.2.5 Non-parametric effect size . . . 79
4.2.6 Explanatory power effect size . . . 80
4.2.7 Graphical representations . . . 80
4.3 Developing effect sizes for non-Normal data . . . 80
4.3.1 Quantile absolute deviation . . . 81
4.3.2 Quantile comparison effect size . . . 83
4.3.3 Interpreting the QC effect size . . . 84
4.3.4 ES computation for some simple examples . . . 85
4.4 Two-sample Normal distribution comparisons . . . 87
4.5 Two-sample Weibull distribution comparisons . . . 92
4.6 Application: analysis of clickstream data . . . 93
4.6.1 Fitting a distribution and then computing effect sizes . . . 98
4.6.2 Using empirical quantile functions to generate effect sizes . . . 101
4.7 Inference based on bootstrapping . . . 101
4.8 Discussion . . . 102
5 Conversion Analysis: Logit Model 103 5.1 Introduction . . . 103
5.2 Response and explanatory variables . . . 104
5.3 Explanatory analysis of conversion . . . 105
5.4.1 Binary Logit Model . . . 110
5.4.2 Single Logistic Regression Models . . . 110
5.5 Model Selection Procedures . . . 112
5.6 Parameter Estimation and Visualisation . . . 116
5.7 Assessing Model Quality . . . 118
5.8 Classification by logistic regression . . . 120
5.8.1 Classification assessment . . . 121
5.8.2 Receiver Operating Characteristic (ROC) Curves . . . 122
5.8.3 Model Diagnostics . . . 124
5.9 Classification and Regression Tree . . . 126
5.10 Summary and discussion . . . 128
6 Bayesian Mixture of Hidden Markov Models 131 6.1 Introduction . . . 131
6.2 Markov Model . . . 132
6.3 Hidden Markov Model . . . 133
6.3.1 Likelihood in HMM . . . 134
6.3.2 Likelihood Recursion . . . 142
6.3.3 Forward-Backward Recursion . . . 143
6.3.4 EM Algorithm in HMM . . . 144
6.4 Mixtures of Hidden Markov Models . . . 145
6.4.1 Likelihood of MixHMM . . . 147
6.4.2 Maximisation of the complete log-likelihood for MixHMM . . . 148
6.4.3 EM Algorithm for MixHMM . . . 152
6.4.4 Simulation Study . . . 153
6.5.1 Complete Hierarchical Model . . . 156
6.5.2 Prior Information . . . 158
6.5.3 Gibbs Sampler for MixHMMs . . . 159
6.5.4 Model selection . . . 161
6.6 Some issues in implementing the Gibbs sampler . . . 162
6.6.1 Slow mixing . . . 162
6.6.2 Label-Switching in MixHMM . . . 163
6.7 Simulation Study . . . 164
6.8 Conclusions . . . 171
7 Modelling Web Browsing: Bayesian MixHMM 173 7.1 Introduction . . . 173
7.2 Modelling Browsing Behaviour . . . 175
7.2.1 Page-view Data Description . . . 176
7.2.2 Model Interpretation . . . 183
7.2.3 Model Selection . . . 186
7.2.4 Model Results . . . 186
7.2.5 Interpreting the hidden states . . . 191
7.3 Discussion and Future Work . . . 195
8 Conclusion 197 8.1 Clickstreams Data Preparation . . . 197
8.2 Exploratory Analysis of Clickstream Data . . . 198
8.3 Conversion Analysis . . . 200
8.4 Analysis of Sequences of Pages Visited . . . 201
A Robust Effect Sizes: E-commerce application 219
A.1 Algorithms for computing Effect Size . . . 219
B R Codes 222 B.1 Plots and Exploratory Analysis . . . 222
B.2 Effect Size . . . 227
B.3 Mixture of Hidden Markov Model . . . 231
B.4 Bayesian Mixture of Hidden Markov Model . . . 234
1.1 A diagram about web mining taxonomy (Cooley et al., 2000) . . . 5 1.2 A web usage mining process (Cooley et al., 2000) . . . 6
1.3 A fragment of a common server log file . . . 11
1.4 A sample of user identification using IP and agent fields, adopted from (Liu, 2007) . . . 13 1.5 A Sample for sessionization based on global time threshold θ= 30minutes and
local time threshold , δ = 10, minutes (Liu, 2006) . . . 14 1.6 A Sample for sessionization based on the navigation-oriented approach (Liu, 2006) 15
1.7 A Sample for path completion by diagram of the website structure. The navi-gational path represented by log file and the missed path is depicted by different kinds of arrows (Liu, 2006) . . . 18 1.8 A Sample of user-session data produced by the web log file after data
prepro-cessing (in some literature this is called a transaction matrix) . . . 20 1.9 A typical pageview data set, or pageview part of a user-session file, representing
pageview attributes (total time spent on the page in this case) associated to the session . . . 21
2.1 Histogram of the number of pages visited (left) and session visit time duration (right) for the period of study. Note that the single-page visits are removed . . . 31 2.2 Line chart shows the trend of the number of visits (left) and the percentage of
2.3 Bar-chart for the average time spent per page (left) and the amount spent on sale for different hours of a day, where the conversion rate for each level is represented at top of the bar (right). . . 39
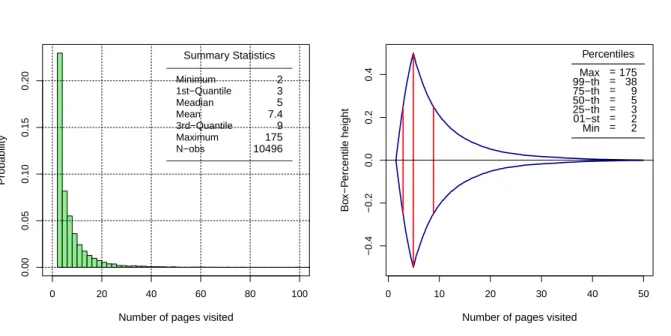
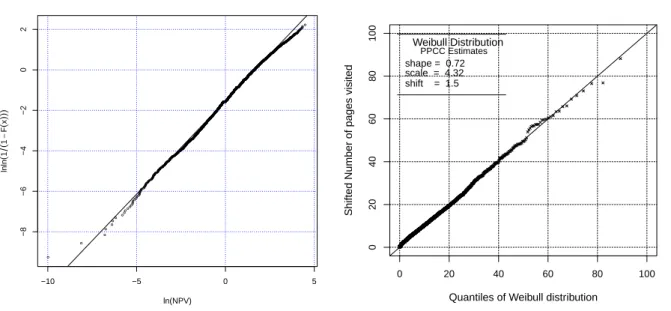
3.1 Histogram (left) and box-percentile plot (right) of the number pages visited for multiple-page visits sessions. . . 46 3.2 The logarithm of the NPV versus theln ln(1−Fe)−1 and the fitted simple linear
regression (left). QQ-Plot of the number of pages visited (right). . . 50 3.3 The Weibull curve on the histogram of the number of pages visited (left) and the
cumulative density function of the NPV and the fitted shifted Weibull distribution (right) . . . 50 3.4 The QQ-plot of the number of pages visited using ML estimate of the parameters
(left) and using PPCC estimate of parameters (right). . . 52 3.5 The QQ-plot for the NPV versus the fitted Weibull distribution using ML
esti-mates (left) and PPCC estiesti-mates (right), zoom in the range of values (0,20) . . 52 3.6 The Probability Plot Correlation Coefficient (PPCC) Plot. They-axis represents
the correlation coefficient between the empirical quantiles of the NPV and the quantiles of the fitted Weibull distribution with corresponding shape parameter given in the x-axis. . . 53 3.7 Histogram of the session time duration (left) and its logarithm (right). It
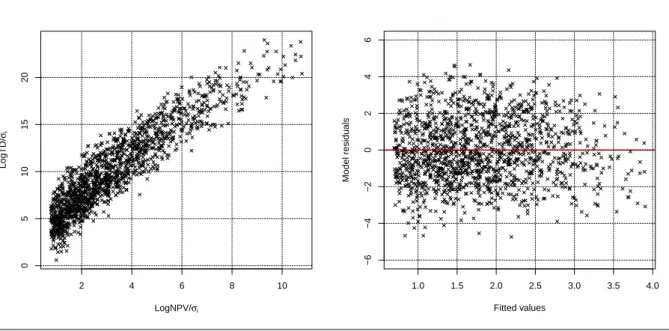
should be noted that to avoid negative values of logarithm, time duration has been rescaled to seconds. . . 58 3.8 Scatter plot of the TD versus NPV (left) and logTD versus logNPV including
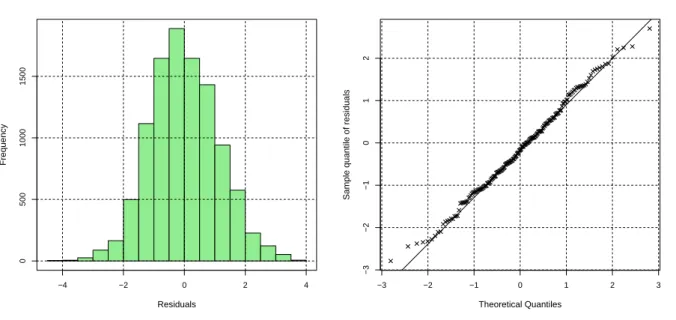
fitted linear regression line (right). . . 59 3.9 Profile likelihood for a Box-Cox transformation, and 95% confidence band for λ 59 3.10 The histogram of the residuals of the fitted model (left) and the normal probability
plot of the residuals (right). . . 63 3.11 The plot of the residuals versus fitted values (left) and plot of residuals versus
order of observations (right). . . 63 3.12 The histogram of the residuals of the fitted model (left) and the normal probability
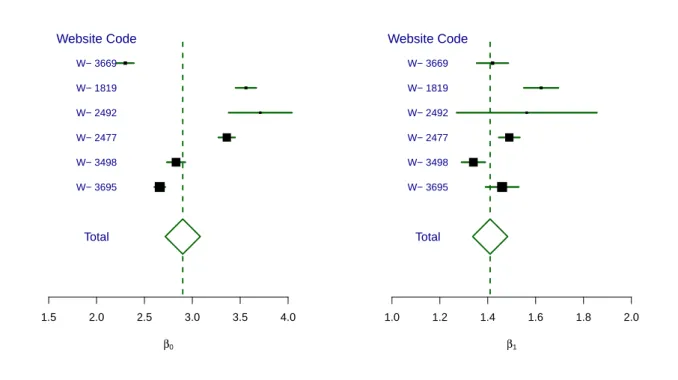
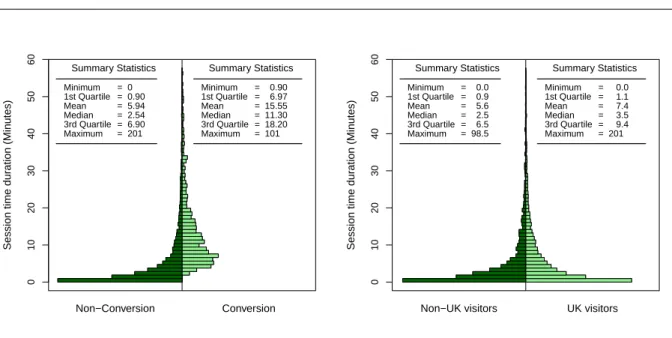
3.13 Forest plot for intercept and slope parameters of the linear regression between LogNPV vs LogTD for several websites . . . 67 3.14 Back-to-back histogram of session time duration given the response variable
con-version and non-concon-version visits (left); given UK visitors and non-UK visitors (right). . . 69 3.15 Scatter plot logTD versus logNPV marked for two group of conversion and
non-conversion visits (left); marked for UK and non-UK visitors (right). It also displays the fitted linear regression line for separate groups. . . 70 3.16 The effect size for difference of the slopes in linear regression line in two groups
of conversion sessions and non-conversion sessions (left); and the UK visit group versus non-UK visits (right). . . 71
4.1 The p-value of the test versus the sample size forH0 :µ= 0 versus H1 :µ >0, given the true value of µ for some N(µ,1) examples. . . 75 4.2 Values of the QCEScorresponding to standard thresholds for Cohen’s d ES.. . . 84 4.3 The pdfs for the compared Normal distributions. . . 86
4.4 The quantile function (4.9)for some Normal distributions, with associatedQAD, where the Normal distribution N(0,1) is the baseline. . . 88 4.5 The vertical comparison quantile function (4.10)for some Normal distributions,
with associatedQCES. The left panel showsVFG(p) =G(F−1(p)). The right panel shows the corresponding function VGF(p) =F(G−1(p)).. . . 89 4.6 Contour plot of theQAD(4.11)for Normal distribution comparisons withN(0,1)
baseline: changes inESas we varyµandσ. The point (0,1) locates the baseline. ES are positive unbounded. . . 90 4.7 Contour plot of the QCES (4.14) for Normal distribution comparisons with
N(0,1) baseline: changes in ES as we vary µ and σ. The point (0,1) locates the baseline. ES are in (0,1) by design.. . . 91 4.8 The pdfs for the compared Weibull distributions. . . 94
4.9 The quantile function (4.9)for some Weibull distributions, with associatedQAD comparing to a baseline W(1,1)distribution.. . . 94
4.10 The vertical comparison quantile function (4.10)for some Weibull distributions, with associatedQCEScomparing to a baselineW(1,1)distribution. The left panel shows VFG(p) = G(F−1(p)). The right panel shows the corresponding function
VGF(p) =F(G−1(p)). . . 95 4.11 Contour plot of the QAD (4.11) for Weibull distribution comparisons with
W(1,1) baseline: changes in ES as we vary α, λ. The point (1,1) locates the baseline. ESare positive unbounded. . . 95 4.12 Contour plot of the QCES (4.14) for Weibull distribution comparisons with
W(1,1) baseline: changes in ES as we vary α, λ. The point (1,1) locates the baseline. ESare in (0,1) by design.. . . 96 4.13 Back-to-back histograms of session time duration for 1,353 website visits
result-ing in a sale, and durations for 8,747 non-sale visits. . . 97 4.14 Fitted pdfs of visit time duration T, separately for sales and non-sales visits,
estimation via maximum likelihood. . . 98 4.15 The fitted quantile functions for session time duration for visit time duration,
separately for sales and non-sales visits. . . 99 4.16 Vertical comparison quantile functions forT0 and T1. . . 100
4.17 Sensitivity plot: a contour plot of QCESvalues for varied parameter choices for sales-group distribution, comparing to baseline distribution T0. . . 100
5.1 The bar chart represents the rate of online purchase given the frequency of return to the website. The width of the bars is proportionate to the number of observations occurring in each category. . . 106 5.2 Back-to-back histograms of session time duration (left) and average time
dura-tion per page (right) given the response variable conversion and non-conversion visits. . . 107 5.3 Heat plot to represent the interaction effect of logarithm of session time duration,
logTD, and logarithm of number of pages visited, logNPV, (left) and previous session time duration and logTD (right) on conversion rate. The heat spectrum shows the magnitude of conversion rate. . . 108 5.4 Bar-plot for the the conversion rate at different hours of the day (left) a three
5.5 Interaction plot for the logistic regression, the effect of logTD×GA (left) and the effect of logTD×logFTD (right). . . 118 5.6 The plot for the sensitivity and specificity of the model for different thresholds
(left); ROC Curve to show the ability of the model to predict the event (right). The black line represents the model that performs no better than random classi-fication. Results are based on test data set . . . 123 5.7 The binned residual plot to check the assumption of independent residuals (left);
Boxplot of the predicted probabilities for each response category, Conversion ver-sus Non-conversion visits (right). . . 125 5.8 Classification and regression tree (CART) analysis of general clickstream data
on conversion. . . 127 5.9 The plot for the sensitivity and specificity of the CART model for different
thresholds (left); ROC Curve to show the ability of the model to predict the event (right). The black line represents the model that performs no better than random classification. . . 128
6.1 Graphical representation of a Markov model . . . 132 6.2 Graphical representation of a HMM. The conditional distribution of each node,
given the value of all the other nodes depends only on the nodes to which it is connected by an edge. . . 134 6.3 Graphical representation of true transition and emission matrices and the
esti-mated values using EM algorithm (right) . . . 154 6.4 The graphical representation of the joint distribution of MixHMM. . . 157
6.5 The boxplot of the−2×Log-likelihood (left) and BIC (right) for different models in terms of the number of mixture components K and the number of hidden states/regimes S. The number shown under each box-plot represents the number of parameters of the model . . . 165 6.6 Graphical representation of true transition and emission matrices (left), and the
average of estimated values transition and mission matrices using EM algorithm (right) . . . 166 6.7 The trace-plot of log-likelihood values of the function at each iteration (left) and
6.8 The trace-plot of transition probabilities. . . 168
6.9 The trace-plot of emission probabilities to investigate label switching between hidden states. . . 169 6.10 The trace-plot of emission probabilities to investigate the label switching between
mixture components. . . 170 6.11 The ACF plot of transition probabilities for the first component (left) and the
second component (right). . . 171
7.1 The canvas-plot of the pages visited by 30 users based on the page categories introduced by Scott and Hann (2007) . . . 179 7.2 Empirical probability transition matrix between page categories. . . 180 7.3 Empirical probability transition matrix between web pages of the site . . . 181
7.4 The DAG representation of the joint distribution of hierarchical Bayesian MixHMM for tied emission probability model (left) and untied model (right). . . 183 7.5 The boxplot of the BIC for different models fitted varies according to the number
of clusters K and the number of hidden states S. . . 185 7.6 The trace-plot of Log-Likelihood values of the function at each iteration (left)
and the ACF plot of values of the log-likelihood. . . 187 7.7 The trace-plot of transition probabilities, as label-switching diagnostic. . . 188
7.8 Using the trace-plot of emission probabilities to investigate the label switching between hidden states. It only shows 8 emission states (web-page). . . 189 7.9 Graphical representation of the emission matrix for tied MixHMM with K = 2
mixture components and S= 6 hidden states . . . 190 7.10 Graphical representation of transition matrices of tied MixHMM with K = 2
mixture components and S= 6 hidden states. . . 192 7.11 Graphical representation of the membership probabilities for tied MixHMM model
with K= 2 and S= 6 (left) and K= 3 and S = 5 (right). . . 193 7.12 The posterior distribution for the probability of online purchase (left) leaving
7.13 The posterior distribution for visiting product pages (left) visiting front page (right). . . 194
2.1 Website traffic indicators for the specific time period of one week . . . 28
2.2 Table of metrics of the website using the SLC data set . . . 32
2.3 Table of conversion statistics for the SLC data set . . . 34
2.4 Segmentation report of the sessions in which users come to the website by
means of UK internet service providers or other non-UK ones . . . 36
2.5 The most popular landing pages of the website. . . 42
3.1 Goodness of Fit test results and effect size for goodness-of-fit, for different
parameter estimation method . . . 56
3.2 Table of coefficients of the linear regression model for the logTD based on
the logNPV and corresponding standard error and p-values. . . 62
3.3 Table of coefficients of the linear regression model error and p-values using
FGLS estimation, Coefficient of determination, and Cohen’s F . . . 64
3.4 Non-parametric Kruskal-Wallis test to investigate the factors which affect
the session time duration. Note that, for factors of two level, the test is
equivalent to the Wilcoxon Test . . . 70
4.1 Mean and standard deviation of Monte Carlo simulations of Cohen’s d,
Cliff ’sδ, the QAD and QC Effect sizes, and the KLdivergence, for Normal
distribution comparisons with N(0,1) baseline. . . 87
4.2 Mean and standard deviation of Monte Carlo simulations of Cohen’s d,
Cliff ’s δ, the QAD and QC Effect sizes, and the KLdivergence, for Weibull
4.3 Bootstrap summry statistics based on 10,000 resamples: estimation of the
standard error, 95% confidence interval, and bias for each ES. . . 101
5.1 The label and short description of the variables in SLC data used in the model selection. It also represent the number of levels. For continuous variables number of levels is reported 1 . . . 106
5.2 The conversion rate for the UK and non-UK visitors who arrived to the
website through Google link or other ways. Margins give the percentages of online purchase for UK/non-UK visitors, and Google/non-Google referring
to the website. . . 109
5.3 The summary of the single logistic regression model, and the labels of general clickstream measures studied . . . 111
5.4 The summary of stepwise model path and the deviance analysis. . . 113
5.5 The summary of stepwise model path and the deviance analysis. . . 115
5.6 The maximum likelihood estimate of the parameters of the logit model and corresponding test statistics . . . 117 5.7 Model fit statistics for Intercept model and the selected stepwise model fitted120 5.8 Association of predicted probabilities and observed responses for the
step-wise logit model fitted (using test data set). The left hand side measures compute for the cut-point which produces the highest largest positive and true negative simultaneously . . . 121
7.1 Page categories in the page-view sequence data sets and their description
(Scott and Hann, 2007). . . 176
Clickstreams: New Source of Data in
E-Commerce
1.1
Introduction
The adventure and advancement of the world wide web, beside all its influence on modern life, has played a major role to conduct business. Electronic commerce has grown rapidly in the decade by means of this new technology. Nowadays, firms offer goods/services not only through traditional channels such as retail outlets, but also in online virtual stores. An economic study (U.S. Census Bureau, 2005) conducted by the Department of Commerce shows that e-commerce, on a percentage basis, outperformed all four major economic sectors of manufacturing, merchant wholesalers, service industries, and retail trade in 2002-2003 (Banks and Said, 2006). However, e-commerce is more distinguished by changing the possibilities with regards to the distribution of goods or services. It has also served companies and organizations to improve their performance through better customer management, marketing strategies, and expanding the range of products and operations in the business area.
As the internet essentially works on the basis of data interchange, there is new data sources available which companies can exploit. This data enables e-commerce managers to supervise a business in ways that were not previously possible. Visitors’ behaviour can be tracked by data collected in the server log files while they are surfing their website (Van den Poel and Buckinx, 2005). The prominent example of using this data, is so-called Web Usage Mining, which provides knowledge on how people behave in the web site specially in making purchase decisions. E-bay is an example in online auctions, which
provides data about the price of products by means of the amount of money customers are willing to pay. Another well-structured data set is produced by social network analysis, which helps to find relationships among people and business (Banks and Said, 2006). Bapna et al. (2006) illustrate automated data collection methods in several areas of e-commerce that give the resources for some tests of economic theories.
One of the favourable aspects of e-commerce is its ability to produce valuable data re-garding website design, website performance and website customization. In investigating what needs to be fixed in an e-commerce website, customers play the most important role. Customers expect to be catered to, and they need a site that lets them get in and be immediately successful in pursuing their objectives. The e-retailer can use server logs data, instead of traditional customer surveys, to infer about customers’ opinion regard-ing the website. For example, website managers by runnregard-ing A/B design tests are able to produce data about visitors’ behaviour in two different designs of an webpage. A/B testing, or split testing, is a method by which a baseline control sample is compared to a variety of single-variable test samples in order to improve response rates. In the web designing context A/B split testing is exploited to determine which elements on a page are helping the performance of a web page, and which are not. For example, one might test two different headlines on a landing page and check whether one would outperform the other. The customers’ usage information can help by providing a list of popular des-tinations from a particular webpage. The web manager is interested in investigating long convoluted traversal paths or low usage of a page with important site information by web usage data. The task may imply that the site links and information are not laid out in an intuitive manner (Cooley et al., 1999a).
The analysis of data generated by e-commerce provides the opportunity to outline better client relations (Bauer et al., 2002). It may be implemented more efficiently by influencing the current customers’ and clients’ visiting and shopping behaviour if the products and services get adjusted to the profile of visitors individually (Van den Poel and Buckinx, 2005). The more refined the segmentation or profiling of the customer base, the more efficiently a profitable target segment can be identified (Moe and Fader, 2004). By direct communication to current clients and prospective customers through websites, companies are able to adjust products, services, advertisement campaigns, and any other policies to the profile of visitors in order to influence customers’ visiting and shopping behaviour. Baesens et al. (2004) outlined customer relationship management by considering alterna-tive strategies pursued for different user segments, resulting from clustering methods on web data. Web data has been exploited to run systems which give advice about prod-ucts, information or services a user might be interested in, while surfing the web pages.
These applications aim to assist users in a decision-making process where they want to choose some items amongst a potentially large set of alternative products or services. Such systems which are usually referred to as recommender systems has been used for many different information items such as books, music, films, news, scientific literatures (Werthner et al., 2007).
Knowledge gained by web data representing users’ navigational behaviour on the web-sites can be applied to provide different information and services to website users. Any activities in website design to fulfil this aim is called web personalization (Eirinaki and Vazirgiannis, 2003). Web personalization can be performed for particular users or user segments. The main purpose to web personalization on an e-commerce website might be converting website browsing behaviour into customers. It also can help to improve website design, customer retention and loyalty (Nasraoui, 2005). Mobasher et al. (2000) has outlined a good description of the different kinds of web personalization which can affect essential Customer Relationship Management (CRM) activities.
Customer trust is a key issue in e-commerce. Customers are supposed to receive a secure system when they make online payments. A hacked system and misused data would cause serious problem for a company, as it is hard to regain customers’ trust. Web data sources and mining techniques are used for intrusion detection and anomaly detection. Statistical models on web usage data are used to identify attacks and to indicate doubtful activities by an authorized user. Normal transaction behaviour is usually captured by a statistical model and activities are compared to the model (Banks and Said, 2006).
The growth of e-commerce permits the customer to choose from several alternatives. The ability of the customers to check the products of e-vendors working in the same trade by moving from a website to another in a short time has affected customer loyalty. Visitors to an e-commerce website display slight loyalty to the specific website when searching for a product or category (Johnson et al., 2004). Additionally, the percentage of website visits that result in purchasing is very low (Bucklin and Van den Poel, 2003). Consequently, e-vendors need some effective levers to remain in such a competitive community. This persuades e-vendors to use data obtained from web users to discover useful knowledge to help to keep customers loyal to the e-commerce website (Abraham, 2003).
Although, e-commerce provides a considerable amount of data, they do not follow many assumptions which are useful for statistical modelling, like independent observations. Fur-thermore, the number of people who do shopping online is increasing and more businesses are adding electronic services. It means that e-commerce data is increasing in volume, and it is not easy to extract interpretable descriptions that support business decisions.
Considering the sheer increase of data in size and complexity, more intelligent knowledge mining techniques are necessary (Roussinov and Zhao, 2003; Abraham, 2003). This per-suaded researchers to contemplate developing methodologies by which the hidden patterns of web behaviour visits become apparent through exploring web data. This broad class of research is usually referred to as web mining analysis (Chakrabarti, 2003).
1.2
Web Mining
Web Mining includes the application of data mining methodologies, techniques, and mod-els to all kind of data forms relating to the World Wide Web. On the other hand, data mining is the analysis of large data sets to find un-suspected relationships and to sum-marize the data in novel ways that are both understandable and useful to the data owner (Cooley et al., 2000). There are three types of data available in the web, which have been a focus of attention: web usage data, also known as clickstream data; web content data; and web structure data (Cooley et al., 1999a). Therefore, by mining the web, we refer to uncovering patterns in web content, structure, and usage demonstrates by means of data mining methods and models. Accordingly, based on research studies carried on the different web-related data, web mining has been categorized into three domains: content, structure and usage mining (Chakrabarti, 2003). In what follows, we will provide a gen-eral overview of all three kinds of web-based data. Figure 1.1 depicts a diagram about the taxonomy of the Web Mining.
1.2.1
Web Usage Mining
Each click made by a user on a web browser while surfing the Internet, corresponding to an HTTP request sent to the server of the website, generates a single entry in the server access logs. Each log entry may includes such information as fields identifying the hitting date and time of the request, HTTP Status, bytes sent, download time, the server IP address of the user, the resource requested, status of the request, HTTP method used, browser and operating system type and version, the referring web resource, and, if available, client-side cookies which uniquely identify a repeat visitor (Johnson et al., 2004). This information varies depending on the log format. The file containing this information, usually referred to as a web log file, is the primary source of data representing the navigational behaviour of visitors.
Figure 1.1: A diagram about web mining taxonomy (Cooley et al., 2000)
information regarding user profile, user conversion (desired action based on direct requests from marketers, advertisers, and content creators– usually making an online purchase for an e-commerce website), user demographics for registered users, and user ratings on various objects such as products, music, films, past purchases, etc. Some of these data can be captured anonymously as long as it is possible to distinguish between different users (Mobasher, 2006). For example, anonymous information contained in client-side cookies can be considered a part of the user’s profile information, and used to identify repeat visitors to a site. E-commerce exploits this data along with clickstream data to have a more clear picture of the user’s behaviour. These data may be available on separate servers and will need to be merged with the web logs before preprocessing can be done. Web usage mining is the application of data mining techniques to large web data reposi-tories in order to extract interesting and useful knowledge and implicit information that reflect the behaviour of humans as they interact with the Internet (Cooley et al., 1999a; Kosala and Blockeel, 2000). Some of the data mining algorithms that are used in web usage mining employ statistical modelling, clustering and classification, association rule generation, and sequential pattern generation (Kosala and Blockeel, 2000).
Figure 1.2: A web usage mining process (Cooley et al., 2000)
1.2.2
Web Content Mining
The content data in a site is the collection of objects and relationships that is conveyed to the user. For the most part, this data is comprised of combinations of textual mate-rials and images. The data sources used to deliver or generate this data include static HTML/XML pages, multimedia files, dynamically generated page segments from scripts, and collections of records from the operational databases. The site content data also includes semantic or structural meta–data embedded within the site or individual pages, such as descriptive keywords, document attributes, semantic tags, or HTTP variables (Kolari and Joshi, 2004). The underlying domain ontology for the site is also considered part of the content data. Domain ontologies may include conceptual hierarchies over page contents, such as product categories, explicit representations of semantic content and relationships via an ontology language such as RDF, or a database schema over the data contained in the operational databases (Kosala and Blockeel, 2000). This informa-tion is an unstructured data source contrary to fully structured data like database tables. Web content mining techniques are also applied to this unstructured data embedded in web documents and services. Web content mining is sometimes called web text mining, because the text content is the most widely researched area. Most of the focus on web content mining techniques is on clustering and classification analysis.
1.2.3
Web Structure Mining
Web structure data refers to the information available in the inter-page linkage structure among web pages as well as intra-page linkage structure of content within a page. This data represents the designer’s view of the content organization within the site. Structure for a site can be revealed by an automatically generated site map. Web Structure Mining discusses basic ideas and techniques for extracting text information from the web, includ-ing collectinclud-ing and indexinclud-ing web documents and searchinclud-ing and rankinclud-ing web pages by their textual content and hyper-link structure (Chakrabarti et al., 1998). Note that we may need to have a knowledge of the topology or structure of the website, the network hier-archies and relationships among the web pages to enable us to perform a preprocessing task such aspath completion.
1.3
Clickstream Data
Clickstream data gathered from a website can provide insight into the behaviour of the website visitors. To illustrate what type of information can be collected while a user is surfing the internet, consider the typical behaviour of a user who decides to purchase a product online. This task starts by signing onto the internet and using a search engine to find what sites sell a favourite brand. Then the user would click on the first link represented by the search engine and begin to browse inside the website. Shopping in the website would result in adding an item to a shopping cart. To make an order, personal information is completed using online forms. This might include credit card number and shipping address. The next page usually displays the order information and total cost. Finally, by confirming the order, one checks whether a confirmation email has been sent. If so, one would sign out of the internet. During this entire process,clickstream data has been collected in the web log file of the Web retailer’s server (Werner et al., 2002).
Theclickstreamis defined as the aggregate sequence of page visits executed by a particular
user as the user navigates through a website. It consists of the records of a user’s activity on the internet, including how one got to the website, every website and every page of the website that the user visits, how long the user was on a page or site, in what order the pages were visited, the point at which he left the website, the merchandise he considered buying, any newsgroups that the user participates in and even the e-mail addresses the user provides for correspondence (Mobasher et al., 2000). In the next section we get familiarized with web server log files as a main source of data available for the analysis of users’ behaviour on the Web.
1.3.1
Web Server Log Files
For each request from the user’s browser (Internet explorer, Mozilla Firefox, Netscape, etc.) to a web server, a response is generated automatically, called a web log file, log
file, or web logs. This response takes the form of a simple single-line transaction record
that is appended to an ASCII text file on the web server. This text file may be comma-delimited, space-comma-delimited, or tab-delimited. There are two standard Web log formats, The Microsoft standard format (or Microsoft professional Internet services format) and the National Center for Supercomputing (NCSA) common log file format. The field definitions of clickstream data are thus already defined to help simplify and reduce development time when dealing with these formats. As follows, we will illustrate the different fields which exist in a typical log file (Markov and Larose, 2007).
Remote Host Field
This field consists of the Internet Protocol (IP) address of the remote host making the request for the user visiting a website. An IP address is a numerical identification and logical address that is assigned to devices participating in a computer network utilizing the internet protocol for communication between its nodes (Comer, 2000). IP addresses are stored in binary numbers, but they are usually displayed in human readable notations. An IP address comprises three pieces of information: a name, an address, and a route. The name indicates what a visitor seeks. The address helps to find out where it is, and the route shows how to get to the address. When the remote host name is not available, then the domain name system (DNS) can help to decode the host names into IP address and vice versa. In view of the fact that humans prefer to work with domain names and computer are most efficient with IP addresses, the DNS provides an important interface between human and computer (for more information see the Internet Systems Consortium, www.isc.org). IP addresses are usually represented by dot-decimal notation, four numbers each running from 0 to 255. A typical user IP address in the log entries would be 141.243.1.172.
Identification Field
Identification fields show the login IDs of users who have entered a password protected area of the site. This field is used to store identity information by the client only if the web server performs an identity check. However, this field is rarely used because identification information provided is in the form of text rather than a securely encrypted form. Therefore, this field usually contains a∼, or−− , indicating a null value (Markov
and Larose, 2007; Liu, 2006).
Date and Time Fields
The date and time of the local server for each page request is recorded in the log file in Greenwich Mean Time (GMT). It is more common for the date/time field to follow the following format: dd/Mon/yyyy:hh:mm:ss offset, where hh:mm:ss represents 24–hour time, given in Eastern Date Time (EDT) system, dd/Mon/yyyyrepresents the date, and anoffsetis a positive or negative constant indicating in hours how far ahead of or behind the local server is from Greenwich Mean Time (GMT). For example, a date/time field of12/Sep/2008:13:21:02 -0700 indicates that a request was made to a server at 01:21 p.m. on September 12, 2008, and the server is 7 hours behind GMT.
HTTP Request Field
The HTTP request field consists of the information requested by the user’s browser from the web server. The entire HTTP request field is embraced within quotation marks. Basically, this field can be partitioned into four areas: the request method, Uniform Resource Identifier (URI), the header, and the protocol. The most common request method isGET, which represents a request to retrieve data, identified by URI. For example, GET/index.html HTTP/1.1represents a request from the user’s browser for the web server to provide the webpageindex.html. Besides GET, other requests include HEAD, PUT, and POST. For more information about these request methods, refer to the W3C World Wide Web consortium, www.w3.org. The URI contains the page or document name and the directory path requested by the client browser. It may also contain information concerning thekeywordsare being used by user in search engines that point to the website. The keyword are terms and phrases that can be used to find the relevant link by a search engine. The HTTP request field also includes the protocol section. This indicates which version of the HyperText Transfer Protocol is being used by the clients browser,HTTP in the mentioned example. Based on the relative frequency of newer protocol version (e.g., HTTP/1.1), the web developer may decide to take advantage of the greater functionality of the newer version and provide more online features.
Referrer Field
The referrer field provides information about the webpage that the user came from. In this case, the referrer field lists the URL of the previous website visited by the client, which linked to the current page. For images, the referrer is the webpage on which the
image is to be displayed. The referrer field contains important information for marketing purposes, since it can track how people found a website. Again, if the information is missing, a dash is used.
User Agent Field
The user agent field indicates the user’s browser, browser version, and operating system. This field can also contains information regarding bots orweb crawlers. A Web crawler, orbot, is a computer program that browses the internet in a automated manner to provide up-to-date data for a specific purpose. A bot may be used to create a copy of all the visited pages for later processing by a search engine that will index the downloaded pages, to make a faster search. It also can be used to collect e-mail addresses, usually for sending spam. A web developer can use user agent field to block certain sections of the website from the web crawlers, in the interests of preserving bandwidth. This field also enables the analyst to determine whether a human or a bot has accessed the website, and thereby to omit the bot’s visit from the analysis.
Status Code Field
Once a browser request fails, a three digit response from the web server is transmitted to the user, and recorded in the web log file. This field, referred to as a status code, indicates whether the request was successful, or if there was an error. In the case of error, it also indicates which type of error occurred. Codes of the form 2xx indicate that the request from the client was received, understood, and completed. Codes of the form3xxindicate that further action is required to complete the client’s request. Codes of the form 4xx are used to show that the client’s request cannot be fulfilled, due to incorrect syntax or a missing file. Finally, codes of the form5xx indicate the failure of the web server to fulfil what was apparently a valid request (Markov and Larose, 2007).
Transfer Volume Fields
The transfer volume field indicates the size of the file, in bytes, sent by the web server to the client’s web server. Only GET successful requests, status code = 200, will have a positive value in the transfer volume field. Otherwise, it will consist of a dash or a value of zero. This field is useful to monitor network traffic, the load carried by the network through a 24–hour cycle.
Figure 1.3 depicts a fragment (three entries) of a log entry of a typical web server log file. For the first entry, it shows a user with IP address 175.12.131.24 accessing a
Figure 1.3: A fragment of a common server log file
resource/wiki/Clickstreamon the serveren.wikipedia.orgat2009-02-01 10:08:43 in Greenwich Mean Time. The browser type (Microsoft Internet Explorer) and version (6.0), as well as operating system information on the client machine (Windows NT) are captured in the agent field of the entry. Finally, the referrer field specifies that the user came to this location from an outside source: www.dur.ac.uk. The second entry has a different ISP, consequently it confirms that this records was produced by a different user. The third record is from the first user, with the same ISP, but the URL has changed to a new page.
1.3.2
Preprocessing
The web log files are not well-structured data and cannot be directly used for web mining purposes. For example, when a user requests a web page containing graphic and sound files, the request results in several records/lines in the web log file that represent just one page request. One also need to remove the records in the web log files which are made by bots, as those line do not reflect the human browsing behaviour. Considering the irrelevant information in web logs files, from the web usage mining point of view, it is required as an essential data preparation activity to convert the raw data into data abstraction necessary for further analysis (Natheer and Chan, 2006; Helmy et al., 2008), usually referred to as
a data preprocessing step. Cooley et al. (1999a) provides a comprehensive discussion of
the stages and tasks in data preparation for Web usage mining. In this section we briefly illustrate some common preprocessing task.
User Identification
Since a user may visit a site more than once, before modelling user behaviour one needs to distinguish between different users. There is no emphasis to obtain knowledge about
user identity, but one needs the sequence of activities performed by the same user during different sessions, which is usually calleduser activity.
The most reliable way to identify users is by user registration. In this case, each user has his/her own user ID for logging into the website. It has also the advantage of collecting additional demographic information about users. Unfortunately, due to privacy concerns, many users are not interested in browsing in a website when they are asked for registration and logins. Even for registered users, many prefer to provide false information (Cooley et al., 1999a).
Another way to identify users is based on the IP address, as users with different IP address are definitely are people who connected from different computer. Due to the increasing number of internet users, ISP proxy servers rotate IP addresses which are assigned to clients as they browse the Web. Therefore, one may find many identical IP addresses in log entries, due to the limited number of proxy server IP addresses, from large internet service providers (Mobasher, 2007). It obliges us to find a way to distinguish among those who come to the website with the same IP address. One heuristic is to use a combination of IP address with other clickstream information such as user agent field or referrer. It can be assumed that each different agent type, including browser software, or its version, or operating system for an IP address represents a different user (Pirolli et al., 1996). One may take advantage of site topology to construct browsing paths for each user. Afterwords, if a page is requested that is not directly accessible by a hyper-link from any of the pages visited by the user, again, it can be assumed that there is another user with the same IP address (Liu, 2006).
Note that user identification on log server data actually helps to distinguish between machines rather than users, except in the case of registered users of a website who log into the website through a user ID and a password. For example, if a user visits a website from a machine in the work office, and later returns to the website from home, the user identification pre-processing fails to identify the user. Oppositely, when a machine is used by several users, browsing the website by different people might be considered as a re-visiting of the website by the same user.
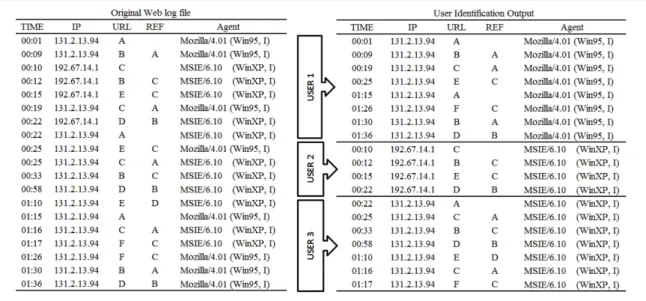
Figure 1.4 depict a fragment of a typical web log data file, Using a combination of IP and agent fields in the log file, we are able to partition the log into activity records for three separate users, as depicted on the right panel. The IP is used first, and the different IP addresses get separated. In the next step the agents of the each group of web log entries with the same IP are investigated to find whether all the agents are the same. The entries with the same log but dissimilar agent are separated as different Users.
Figure 1.4: A sample of user identification using IP and agent fields, adopted from (Liu, 2007)
Sessionization
The purpose of session identification is to divide the page accesses of each user from the clickstream data into an actual sequence of single user navigations during a single visit to the website. Session identification, which is sometimes named as episode identification, is usually performed as a final step in preprocessing of the clickstream data (Markov and Larose, 2007). In the lack of additional authentication information from users and without mechanisms such as embedded session ids, sessionization is carried out based on heuristic methods. Various heuristics for sessionization have been introduced and studied by Cooley et al. (1999a). More recently, Spiliopoulou et al. (2003) proposed a comprehensive framework for evaluating the effectiveness of such heuristics, and the impact of different heuristics on various Web usage mining tasks has been analysed by Berendt et al. (2002)
Sessionization heuristics are categorized into two basic groups: time-oriented and navigation-oriented. The time-oriented heuristic applies time-out estimates to distinguish between successive sessions. For logs with long periods of time, it is very likely that users visit the website more than once. One heuristic is to assume that the user starts a new session, whenever the time between page requests exceeds a certain limit (Cooley et al., 1999a). As an example of a time-oriented heuristic, one may scan the user activity log and par-tition it into different sessions whenever the total session duration exceeds a threshold θ. One may choose the total time spent between two subsequent requests and split the session when it exceeds a thresholdδ. It is usual to take 30 minutes threshold as a default
Figure 1.5: A Sample for sessionization based on global time threshold θ = 30 minutes and local time threshold , δ= 10, minutes (Liu, 2006)
time-out, and Catledge and Pitkow (1995) established a time-out of 25.5 minutes based on empirical data. It would be more efficient to find an appropriate time-out after analysing the web logs, and to use different settings for each website (Liu, 2006).
Navigation-oriented sessionization uses either the static site structure or the implicit link-age structure captured in the referrer fields of the server logs (Cooley et al., 1999a). A common way is to assign a request to a constructed session if the referrer for that request was previously invoked in the session. Otherwise, the request is considered as the start of a new session. Note that a request may have been accessed previously in multiple sessions. In this case, the request belongs to more than one open constructed session. One may use additional information to assign the request properly. For example, the request could be added to the most recently opened session satisfying the above condition (Liu, 2006). An example of the application of sessionization heuristics is given in Figure 1.5. Applying a global time threshold withθ = 30 minutes, the user activity record has been partitioned into two separate sessions. If we were to apply a local time threshold of δ= 10 minutes, the user record would be seen as three sessions, namely,A→B→C→E, A, and F→B→D. On the other hand, using the navigational-oriented heuristic on the same user activity record would result in different sessions (see Figure 1.6). once the request for F (with time stamp 1:26) is reached, there are two open sessions, namely, A→B→C→E and A. But F is added to the first because its referrer, C, was invoked in the first session. The request for B (with time stamp 1:30) may potentially belong to both open sessions, since its referrer, A, is invoked both in the first session and in the second session. In this case, it is added to the second session, since it is the most recently opened session.
Figure 1.6: A Sample for sessionization based on the navigation-oriented approach (Liu, 2006)
Data Fusion/Merging
Data fusion is an essential preprocessing task on clickstream data where the analysis of user behaviour is performed over the log files of multiple related websites. In large-scale websites, multiple Web or application servers are used to show the content served to the users. The web log files produced by different servers need to be merged properly to capture the users’ trace. Fusion is followed by the sessionization and user identification preprocessing methods, in combination with the heuristics based on the referrer field in the web log file. Tanasa and Trousse (2004) introduce the heuristics to be applied for merging web log data from different servers.
Data Filtering
When loading a particular web page, the browser also requests all the objects embedded in the page. It leads to the registration of several record lines in the web log file for logs, cookies, graphic files, etc. Data filtering involves the task of removing extraneous references to embedded objects that may not be important for the purpose of analysis, including references to style files, graphics, or sound files, which belong to top/bottom frames (Markov and Larose, 2007). The filtering process also involves the removal of some of the data fields, such as number of bytes transferred or the version of HTTP protocol used, that may not provide useful information in analysis or data mining tasks (Werner et al., 2002). In addition to these fields, we may also omit some web log entries in processing to quickly identify the exact records that we need from the Web logs. One example is the removal of the log entries associated to the users which have sent just one request. These single-page-visit users are usually referred to as users who have found the
website irrelevant to their needs and leave the website quickly.
Filtering can be accomplished by checking the suffix of the URL name. For example, all log entries with filename suffixes such as, gif, jpeg, GIF, JPEG, jpg, JPG, and map can be removed. In addition, common scripts such as count.cgi can also be removed. Web analytic systems use a default list of suffixes to remove files. Note that data filtering is usually site-specific, so the list can be modified depending on the type of site being analysed. For example, suppose we aim to analyse user behaviour for a website that contains a graphical archive. In this case, the log entries of graphics files represent explicit user actions, and should be retained for analysis. Therefore, filtering requires keeping all of the GIFor JPEG files from the server log file (Markov and Larose, 2007).
Despidering
With information overload on the web, web search engines start the task of gathering information on the web and provide relevant web links containing the information needs of customers. This task is performed by dispatching automatic programs, usually called spider, crawler, or web bots, which browse all over the web and gather information for the search engine databases. The behaviour of bots differs to human behaviour, as they usually request all possible links of the website one after the other. In fact, for using clickstream data to capture web usage, we need to remove this type of non-human access behaviour. Despidering refers to the action of removing references from web log file due to crawler navigations. With the growth of search engines and internet usage, it is likely to find a considerable percentage of references resulting from search engines, spiders, or other crawlers (Markov and Larose, 2007).
Famous search engine crawlers (such as Google, msn, Yahoo!, etc.) can be identified by checking the user agent field of the web log entries. Maintaining a list of such bots, one can remove all records of the web log when its referrer belongs to the list. Another heuristic to detect crawlers is to inspect the typical behaviour that crawlers may follow. For example,
Well-behaved crawlers that respect the standard robot exclusion protocols strive to access
an exclusion file named robot.txt in the server root directory in the first attempts of crawling. As a result, One may identify such crawlers by detecting sessions that begin with access to this file. However, for those crawlers that either do not identify themselves explicitly or implicitly; or those crawlers that deliberately masquerade as real human users, identification and removal of crawler references may require the more complex heuristic methods or anomaly detection techniques. For example, Tan and Kumar (2002) applies classification algorithms to build models of crawlers and Web robot navigations.
Path Completion
Path completion refers to the task of filling in page references that are not recorded in the web log file, due to browser and proxy server caching. When a user returns to a page that has been already visited (downloaded) during the same session, the second access to that page will result in viewing the previously downloaded version of the page without sending any request to the server. This lack of request from the browser results in a missing reference in the web log file. Missing references due to caching can be heuristically inferred through path completion which relies on knowledge of the site structure and referrer information from server logs (Cooley et al., 1999a).
If a page request is not directly linked to the last page a user requested, one can check the referrer log to see if the page is in the user’s recent request history. If so, one can assume that the user backtracked with the back button. Otherwise, the site topology must be used to the same effect. If more than one page in the user’s history contains a link to the requested page, a reasonable option is to take the closest page to the previously requested page. It is also required to estimate the time of each added page reference. An approach is to assume that any visit to a page already seen makes it work as an auxiliary page, which is used to guide the user to the new pages. The average reference length time (the average amount of time spent on each page) for auxiliary pages of the website can be used as an estimate of the access time for the missing pages.
For example consider a website topology given in Figure 1.7. Let suppose a typical user whose navigational path in the log file is presented by A→B→C→D→E (depicted by grid lines in the Figure 1.7). Since there is no link from C to D, it seems obvious that the user has backtracked, using the browser’s back button, to page B and then D and E. Due to using a cached file on the client-side, the back reference from C to B does not appear in the log file. Given site structure and the referrer information, we infer the missing references C→B and B→D (depicted by a dashed line in Figure 1.7). The path completion step results in actual user paths of A→B→C→B→D→E.
Data Integration
An effective framework for knowledge discovery in e-commerce is usually performed by in-tegrating the preprocessed clickstream data with user data from different sources. Online purchase, which is usually called a conversion in this context, is of the highest impor-tance regarding integration with clickstream behaviour. E-vendors are interested to find patterns of behaviour between people who purchase online and those who do not. Other
Figure 1.7: A Sample for path completion by diagram of the website structure. The navigational path represented by log file and the missed path is depicted by different kinds of arrows (Liu, 2006)
user data such as demographics and purchase histories, especially in the case of registered users, also provide valuable information in pattern discovery. Operational databases may present information about product categories and attributes (Kohavi et al., 2004). Part of the data to integrate with clickstreams are produced by events which shows a user’s tendency to buy the products presented in the website. For example, shopping cart changes, order information, impressions (the action of the user to visit a page containing an item of interest), click-through (the action of the user to click on an item of interest in the current page), provide additional data about users surfing the website (Kimball and Merz, 2000). The integrated database enables web managers to produce e-metrics including frequency of purchases, the value of purchases, the number of different items purchased, the number of different item categories purchased, average time spent on pages or sections of the website, day of week and time of day for certain activities, response to online recommendations specials, etc. (Buchner and Mulvenna, 1999).
Pageview/Transaction Identification
For a static single frame site, each page request in clickstream data corresponds to a specific user action. For example, clicking on a link, reading an article, viewing a product page, adding a product to the shopping cart, or visiting the index page, etc. These ac-tions result in a collection of web objects or resources generated by the user’s web browser. The task of transforming and aggregating semantically meaningful user groupings of page references is called pageview (or transaction) identification (Cooley et al., 1999a). De-pending on the goals of the analysis, this data aggregation is performed at different levels of abstraction. The most basic level of data abstraction is that of all webpages.
How-ever, it may be desirable to consider pageviews at a higher level of aggregation, where each pageview represents a collection of pages or objects, for example, pages related to the same concept category (Liu, 2006). Transaction identification also depends on the navigational structure of the site, as well as on the page contents and the underlying site domain knowledge. For example, Moe (2003) used the general content of pages viewed to categorize pages as buying, browsing, searching or knowledge-building pageviews.
In e-commerce websites, pageviews may correspond to various product-oriented events, such as product views, registration, shopping cart changes, purchases, etc. In this case, identification of pageviews may require a priori specification of an event model based on which various user actions can be categorized.
1.3.3
Data Structures
The web log data has the potential to provide a data structure in which records repre-sent a single visit to a Website, for users who accessed the website, and fields comprise corresponding attributes of the the website being visited. The information includes the webpages requested, as well as the order of the webpages, the amount of time spent on each page, and any other possible derivatives from the web log file entries. This data is usually referred to as user-session data, in view of the fact that its records represent the sessions of website viewing. As a user may visit a website several times, it is likely to have multiple sessions (records) corresponding to an individual user. In fact, the output of session identification makes a set of sessions S = {S1, S2, . . . , Sm} which are uniquely
marked by session ID field. The attributes of the session can be extracted from the web log file, including information such as the date of the session, whether the session is a weekend session, total time duration, number of web pages visited, whether the referrer is of search engines, etc. User identification provides a set of users, U ={U1, U2, . . . , Un}
and corresponding user ID fields. The user identifier helps to establish whether the web-site has already been viweb-sited by the user in a specific session. Therefore, another session attribute is produced by categorizing the session as a repeat session or a first-visit session. Figure 1.8 shows part of a typical user-session data set
For some data mining tasks, such as clustering and association rule mining, where the ordering of pageviews in a session is not relevant, The user session is represented as a vector over of size k of pageviews, P = (P1, P2, . . . , Pk) which is a result of a pageview
identification process. As mentioned earlier, pageviews can be webpage categories (or product page entities) to which mining tasks are applied. Ignoring the order of pages requested, each of the pageview categories can be considered as a character of a session
Figure 1.8: A Sample of user-session data produced by the web log file after data preprocessing (in some literature this is called a transaction matrix)
and represented by a field in user-session data, in some literature called user-pageview
data (Liu, 2006). The fields contain the weight, representing its significance, associated with the pageview in the session. The weights can be determined in a number of ways, in part based on the analysis purpose and type. In most of the analysis tasks the weights are binary, representing the existence or non-existence of a pageview in the session (Mobasher, 2007). In some websites where users are asked to rank the items in the webpages, weights may be based on user ratings of items. A reasonable weight can be assigned by a function of the duration of the pageview in the user’s session. As the time spent by a user on the last pageview in the session is not available, a heuristic is to set the weight for the last pageview to be the mean time duration for the page taken across all sessions in which the pageview does not occur as the last one. Using the normalized value of page duration instead of raw time duration is recommended in order to take into consideration variations in session time duration. In applications, the log of pageview duration is used as the weight to reduce the long tail of distribution noise in the data. A sample pageview data set has been shown in Figure 1.9. The value associated to each page for the user is the total time spent by the user on the page.
The ordering of pageviews visited by users will also contain information about their brows-ing behaviour. A web manager might be interested in analysbrows-ing the clickstream path taken by users during their session on the website (Berkhin et al., 2001). Furthermore, clustering of users can be implemented based on methods which consider the ordering
Figure 1.9: A typical pageview data set, or pageview part of a user-session file, representing pageview attributes (total time spent on the page in this case) associated to the session
of pageviews, for example model-based clustering by means of first-order hidden Markov models (Smyth, 1997; Ypma and Heskes, 2002). Therefore, it is necessary to prepare a data structure which represents the sequence of pageviews. The sequence of pageviews for different sessions can be represented by vectors of different lengths for each session,
j = (j1, j2, . . . , jm), where m ≥ 1. Corresponding to the sequence of the pageviews
visited, the index of the pageviews in the state space P = {P1, P2, . . . , Pk} is used to
represent the sequence. For example, a vector of j = (1,4,1,2,6) shows the pageviews of P1 −P4 −P1 −P2 −P6 respectively during the session. One might apply weighted
analysis of the sequences by considering a sequence of weights joint to the pageview se-quence,wj = (wj1, wj2, . . . , wjm), for example based on the amount of time spent on each pageview.
It is also possible to integrate the conversion file with the user-session data set. The conversion file comprises the information about online purchases. This file helps to add a binary attribute of whether a session resulted in an online purchase of one or more products/services, the amount of purchase, as well as codes of the product/services. The integrated data set allows the analyst to investigate the browsing behaviour that has value to the business, usually an online sale in-commerce websites (Van den Poel and Buckinx, 2005). This type of analysis is called conversion analysis. It also enables the analyst to inspect the impact of marketing campaigns, such as email, banner, referral and custom defined marketing campaigns.
For registered users who login to the website, depending on the requested information in the registration forms, there is more information available about the user. This in-cludes attributes such as gender, age, occupation categories, educational level, etc. The provision of informa