UC Santa Barbara Electronic Theses and Dissertations
Title
Improving and Securing Machine Learning Systems Permalink https://escholarship.org/uc/item/1nv8m9nb Author Wang, Bolun Publication Date 2018 Peer reviewed|Thesis/dissertation
Santa Barbara
Improving and Securing Machine Learning Systems
A dissertation submitted in partial satisfaction of the requirements for the degree
Doctor of Philosophy in Computer Science by Bolun Wang Committee in charge:
Professor Ben Y. Zhao, Co-Chair Professor Haitao Zheng, Co-Chair Professor Giovanni Vigna
Professor Giovanni Vigna
Professor Ben Y. Zhao, Committee Co-Chair
Professor Haitao Zheng, Committee Co-Chair
Copyright c 2019 by
First, I would like thank both of my advisors Prof. Ben Y. Zhao and Prof. Heather Zheng for their guidance throughout my PhD. Not only did they give me directions and advices in research, but they themselves have been role models for me in both research and life. It’s their devotion into creating a motivated, productive, and collaborative lab, that made all achievements in my PhD possible. For all these, I would give my sincere gratitude to Ben and Heather.
Second, I would also like to thank my committee member, Prof. Giovanni Vigna, for providing valuable feedback and advise during my PhD.
Third, it was my greatest pleasure working with all my collaborators, who made this thesis possible. I would like to thank Gang Wang, Bimal Viswanath, Zengbin Zhang, Divya Sambasivan, Tianyi Wang, Ana Nika, Xinyi Zhang, Yuanshun Yao, Zhujun Xiao, Huiying Li, and Shawn Shan. The success of all the amazing and fun projects would not be possible without their hard work, creativity, and smooth collaboration.
I would also like to thank all members of SANDLab that make my PhD full of joy and fun. They are the reasons that make SANDLab the one and the only, with its unique vibrancy and liveness. I could never imagine working in a lab better than this. Apart from names I mentioned before, I would also like to mention Lin Zhou, Xiaohan Zhao, Yibo Zhu, Qingyun Liu, Zhijing Li, Shiliang Tang, Yanzi Zhu, Jenna Cryan, Yuxin Chen, Emily Wilson, Max Liu, and Olivia Sturman. Thank you for all the joy and fun you bring to me.
Finally, I would like to thank my family, my friends, and my loved ones for their unconditional support. It helps me overcome obstacles through this journey. I wouldn’t have made this far without their help.
Education
2018 Ph.D. in Computer Science, University of California, Santa Barbara. 2013 Bachelor of Science in Electronic Engineering, Tsinghua University,
China
Conference Publications
• Bolun Wang, Yuanshun Yao, Shawn Shan, Huiying Li, Bimal Viswanath, Haitao Zheng and Ben Y. Zhao. “Neural Cleanse: Identifying and Mitigating Backdoor Attacks in Neural Networks.” In Proceedings of40th IEEE Symposium on Security and Privacy. San Francisco, CA, May. 2019. (S&P)
• Bolun Wang, Yuanshun Yao, Bimal Viswanath, Haitao Zheng and Ben Y. Zhao. “With Great Training Comes Great Vulnerability: Practical Attacks against Trans-fer Learning.” In Proceedings ofThe 27th USENIX Security Symposium. Baltimore, MD, Aug. 2018. (USENIX Security)
• Yuanshun Yao, Zhujun Xiao, Bolun Wang, Bimal Viswanath, Haitao Zheng, and Ben Y. Zhao. “Complexity vs. Performance: Empirical Analysis of Machine Learn-ing as a Service.” In ProceedLearn-ings ofThe 17th ACM Internet Measurement Confer-ence. London, UK, Nov. 2017. (IMC)
• Bolun Wang, Xinyi Zhang, Gang Wang, Haitao Zheng and Ben Y. Zhao. “Anatomy of a Personalized Livestreaming System.” In Proceedings ofThe 16th ACM Internet Measurement Conference. Santa Monica, California, USA, Nov. 2016. (IMC)
• Gang Wang, Bolun Wang, Tianyi Wang, Ana Nika, Haitao Zheng and Ben Y. Zhao. “Defending against Sybil Devices in Crowdsourced Mapping Services.” In Proceedings of The 14th ACM International Conference on Mobile Systems, Appli-cations, and Services. Singapore, June 2016. (MobiSys)
• Gang Wang, Tianyi Wang, Bolun Wang, Divya Sambasivan, Zengbin Zhang, Haitao Zheng, and Ben Y. Zhao. “Crowds on Wall Street: Extracting Value from Collaborative Investing Platforms.” In Proceedings of The 18th ACM Conference on Computer-Supported Cooperative Work and Social Computing. Vancouver, BC, Canada, March 2015. (CSCW)
• Gang Wang, Bolun Wang, Tianyi Wang, Ana Nika, Haitao Zheng and Ben Y. Zhao. “Whispers in the Dark: Analysis of an Anonymous Social Network.” In Pro-ceedings of The 14th Internet Measurement Conference. Vancouver, BC, Canada, Nov. 2014. (IMC)
Zhao. “Ghost Riders: Sybil Attacks on Crowdsourced Mobile Mapping Services” IEEE/ACM Transaction on Networking (TON), 2018
• Tianyi Wang, Gang Wang,Bolun Wang, Divya Sambasivan, Zengbin Zhang, Xing Li, Haitao Zheng, Ben Y. Zhao. “Value and Misinformation in Collaborative In-vesting Platforms” ACM Transactions on the Web (TWEB), 2017
• Tianyi Wang, Yang Chen, Yi Wang, Bolun Wang, Gang Wang, Xing Li, Haitao Zheng, Ben Y. Zhao. “The Power of Comments: Fostering Social Interactions in Microblog Networks”Springer Frontiers of Computer Science (FCS), 2016
Improving and Securing Machine Learning Systems by
Bolun Wang
Machine Learning (ML) models refer to systems that could automatically learn pat-terns from and make predictions on data, without explicit programming from humans. They play an integral role in a wide range of critical applications, from classification systems like facial and iris recognition, to voice interfaces for home assistants, to creating artistic images and guiding self-driving cars.
As ML models are made up with complex numerical operations, they naturally appear to humans as non-transparent boxes. The fundamental architectural difference between ML models and human brains makes it extremely difficult to understand how ML models operate internally. What patterns ML models learn from data? How they produce prediction results? How well they would generalize to untested inputs? These questions have been the biggest challenge in computing today. Despite intense work and effort from the community in recent years, we still see very limited progress towards fully understanding ML models.
The non-transparent nature of ML model has severe implications on some of its most important properties, i.e. performance and security. First, it’s hard to understand the impact of ML model design on end-to-end performance. Without understanding of how ML models operate internally, it would be difficult to isolate performance bottleneck of ML models and improve on top of it. Second, it’s hard to measure the robustness of Machine Learning models. The lack of transparency into the model suggests that the model might not generalize its performance to untested inputs, especially when inputs are
injecting unwanted malicious behaviors into ML models. The lack of tool to “translate” ML models suggests that humans cannot verify what ML model learned and whether they are benign and required to solve the task. This opens possibilities for an attacker to hide malicious behaviors inside ML models, which would trigger unexpected behaviors on certain inputs. These implications reduce the performance and security of ML, which greatly hinders its wide adoption, especially in security-sensitive areas.
Even though, advancement in making ML models fully transparent would solve most of the implications, current status on achieving this ultimate goal remains unsatisfied, unfortunately. Recent progress along this direction does not suggest any significant breakthrough in the near future. In the meantime, issues and implications caused by non-transparency are imminent and threatening all currently deployed ML systems. With this conflict between imminent threats and unsatisfying progress towards full transparency, we need immediate solutions for some of the most important issues. By identifying and addressing these issues, we can ensure an effective and safe adoption of such opaque systems.
In this dissertation, we cover our effort to improve ML models’ performance and security, by performing end-to-end measurements and designing auxiliary systems and solutions. More specifically, my dissertation consists of three components that target each of the three afore-mentioned implications.
First, we focus on performance and seek to understand the impact of Machine Learn-ing model design on end-to-end performance. To achieve this goal, we adopt the data-driven approach to measure ML model’s performance with different high-level design choices on a large number of real datasets . By comparing different design choices and their performance, we quantify the high-level design tradeoffs between complexity, per-formance, and performance variability. Apart from that, we can also understand which
eralized techniques to optimize these components.
Second, we try to understand the robustness of ML models against adversarial inputs. Particularly, we focus on practical scenarios where normal users train ML models with the constraint of data, and study the most common practice in such scenario, referred as transfer learning. We explore new attacks that can efficiently exploit models trained using transfer learning, and propose defenses to patch insecure models.
Third, we study defenses against potential attacks that embed hidden malicious be-haviors into Machine Learning models. Such hidden behavior, referred as “backdoor”, would not affect model’s performance on normal inputs, but changes model’s behavior when a specific trigger is presented in input. In this work, we design a series of tools to detect and identify hidden backdoors in Deep Learning models. Then we propose defenses that could filter adversarial inputs and mitigate backdoors to be ineffective.
In summary, we provide immediate solutions to improve the utility and the security of Machine Learning models. Even though complete transparency of ML remains an impossible mission today, and may still be in the near future, we hope our work could strengthen ML models as opaque systems, and ensure an effective and secure adoption.
Contents
Curriculum Vitae vi
Abstract viii
List of Figures xiii
List of Tables xix
1 Introduction 1
1.1 Quantifying Impact of Machine Learning System Design . . . 4
1.2 Robustness of Deep Learning Models against Adversarial Attacks . . . . 6
1.3 Identifying and Mitigating Backdoors in Neural Networks . . . 7
2 Background 10 2.1 A Brief Introduction of Machine Learning . . . 10
2.2 Data Constraint and Transfer Learning . . . 13
2.3 Data Poisoning and Hidden Backdoor . . . 14
3 Complexity vs. Performance: Empirical Analysis of Machine Learning as a Service 17 3.1 Introduction . . . 18
3.2 Understanding MLaaS platforms . . . 20
3.3 Methodology . . . 25
3.4 Complexity vs. Performance . . . 31
3.5 Risks of Increasing Complexity . . . 36
3.6 Hidden Optimizations . . . 40
3.7 Related Work . . . 50
3.8 Limitations . . . 52
4.2 Background . . . 57
4.3 Attacks on Transfer Learning . . . 60
4.4 Experimental Results . . . 65
4.5 Experiments with Real ML Services . . . 75
4.6 Developing Robust Defenses . . . 83
4.7 Related Work . . . 90
4.8 Conclusion . . . 92
5 Identifying and Mitigating Backdoor Attacks in Neural Networks 93 5.1 Introduction . . . 94
5.2 Background: Backdoor Injection in DNNs . . . 96
5.3 Overview of Our Approach against Backdoors . . . 99
5.4 Detailed Detection Methodology . . . 106
5.5 Experimental Validation of Backdoor Detection and Trigger Identification 109 5.6 Mitigation of Backdoors . . . 119
5.7 Robustness against Advanced Backdoors . . . 126
5.8 Failed Attempts and Lessons . . . 133
5.9 Related Work . . . 140
5.10 Conclusion and Future Work . . . 141
6 Conclusions and Discussions 142 6.1 Summary . . . 142
6.2 Discussions . . . 144
6.3 Lessons of General Research from a Retrospective View . . . 151
A Appendix 155 A.1 Appendix of Empirical Analysis of Machine Learning as a Service . . . . 155
A.2 Appendix of Practical Attacks against Transfer Learning . . . 157
A.3 Appendix of Identifying and Mitigating Backdoor Attacks in Neural Net-works . . . 164
List of Figures
2.1 An illustration of a simple neural network with 1 hidden layer. Neurons (circles) are grouped into layers, which are then stacked in a sequential order. Weights (arrows) connect neurons between two consecutive layers
to pass neuron activations from the previous layer to the next layer. . . . 12
2.2 An illustration of a neuron in a recurrent neural network. Left figure shows the design of the neuron. Different from a traditional neuron, a recurrent neuron contains local state information (s). Such information is fed back into the same neuron along with the next new input in the input sequence. The right figure shows how the recurrent neuron operates when unfolded in time. . . 13
2.3 An example of backdoor altering DNN’s behavior. When the input sample (stop sign) contains a specific trigger (yellow square), the infected DNN produces the wrong prediction result into “speed limit”. . . 16
3.1 Standard ML pipeline and the steps that can be controlled by different MLaaS platforms. . . 21
3.2 Overview of control vs. performance/risk tradeoffs in MLaaS platform. . 24
3.3 Basic characteristics of datasets used in our experiments. . . 26
(a) Breakdown of application domains. . . 26
(b) Distribution of sample numbers. . . 26
(c) Distribution of feature numbers. . . 26
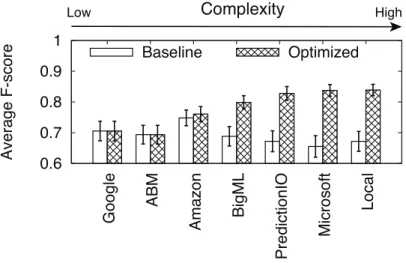
3.4 Optimized and baseline performance (F-score) of platforms and local library. 32 3.5 Relative improvement in performance (F-score) over baseline as we tune individual controls (white boxes indicate controls not supported). . . 35
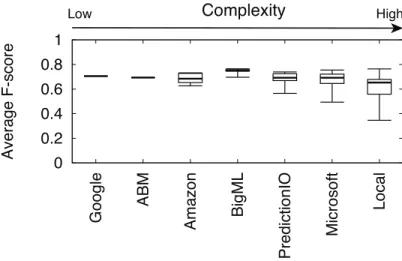
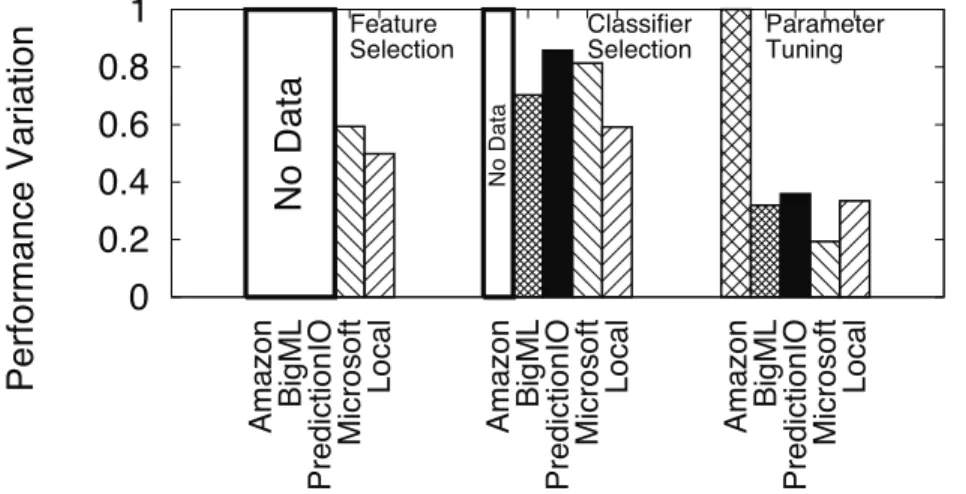
3.6 Performance variation in MLaaS platforms when tuning all available controls. 37 3.7 Performance variation when tuningCLF, PARAand FEATindividually, nor-malized by overall variation (white boxes indicate controls not supported). 38 3.8 Average performance vs. number of classifiers explored. . . 39
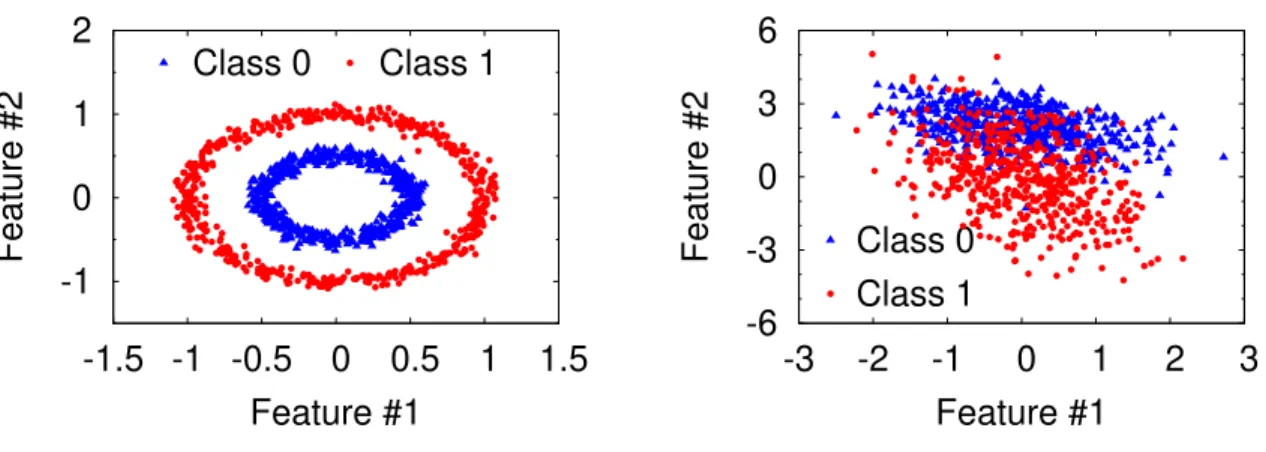
3.9 Visualization of two datasets: synthetic non-linearly-separable dataset (CIRCLE) and synthetic linearly-separable dataset (LINEAR). . . 41
EAR. Both platforms produced linear and non-linear boundaries for
dif-ferent datasets. . . 42
(a) Google’s decision boundary on CIRCLE. . . 42
(b) Google’s decision boundary on LINEAR. . . 42
(c) ABM’s decision boundary on CIRCLE. . . 42
(d) ABM’s decision boundary on LINEAR. . . 42
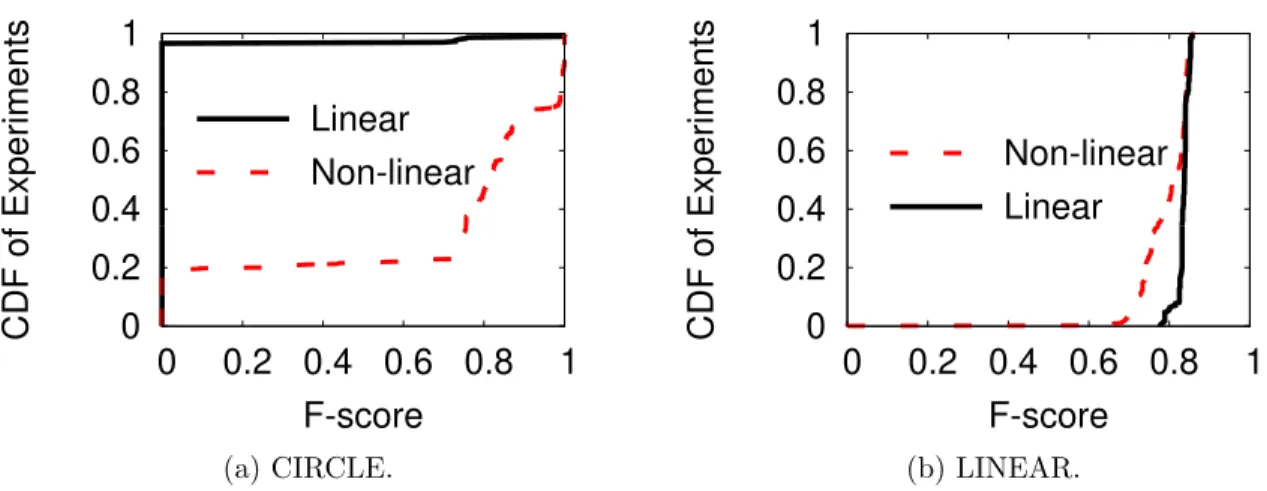
3.11 Performance of predicting local linear/non-linear classifier choices on CIR-CLE and LINEAR datasets. . . 44
(a) CIRCLE. . . 44
(b) LINEAR. . . 44
3.12 Validation performance of predicting linear/non-linear classifiers. . . 46
3.13 Amazon’s decision boundary on CIRCLE. . . 47
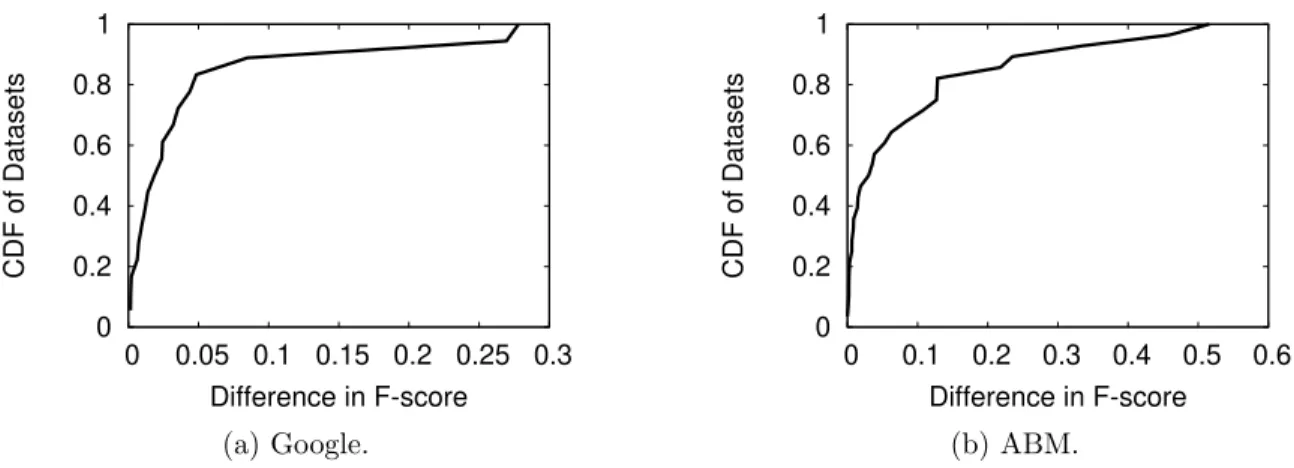
3.14 Performance difference in datasets where na¨ıve strategy outperforms Google/ABM using different classifier family. . . 49
(a) Google. . . 49
(b) ABM. . . 49
4.1 Transfer learning. A student model is initialized by copying the first N-1 layers from a teacher model, with a new dense layer added for classification. The model is further trained by only updating the lastN-K layers. . . . 58
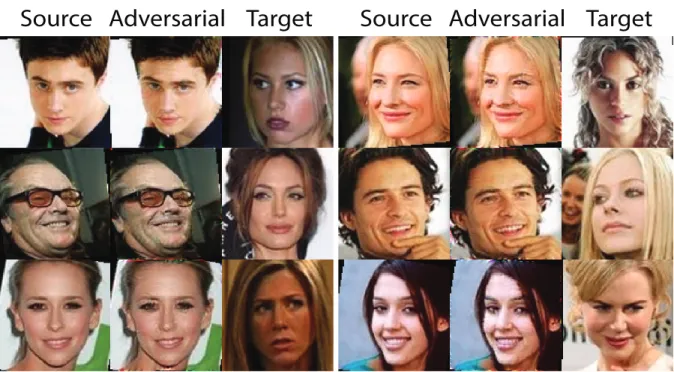
4.2 Illustration of our attack. Given images of a cat and a dog, attacker computes perturbations that mimic the internal representation of the dog image at layer K. If the calculations are perfect, the adversarial sample will be classified as dog, regardless of unknown layers in SN−K. . . 62
4.3 Examples of adversarial images on Face Recognition (P = 0.003). . . 69
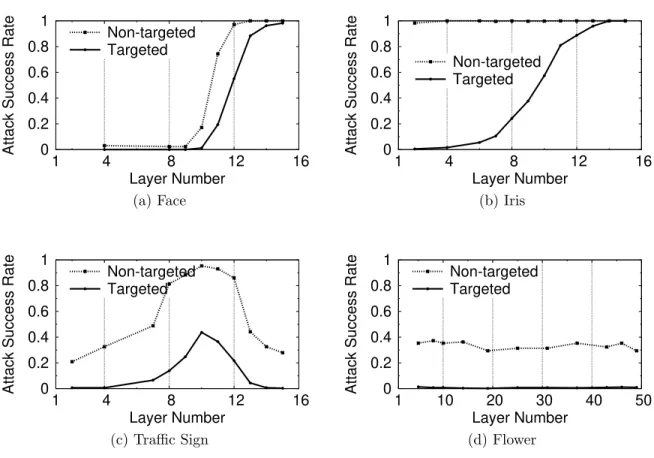
4.4 Attack success rate on Face Recognition with different perturbation budgets. 70 4.5 Targeted and non-targeted attack success rate on Student models when targeting different layers. X axis indicates the layer being targeted. Face and Iris freeze the first 15 layers during training; Traffic Sign freezes the first 10 layers; Flower freezes no layers. . . 72
(a) Face . . . 72
(b) Iris . . . 72
(c) Traffic Sign . . . 72
(d) Flower . . . 72
4.6 Gini coefficient of output probabilities of different teacher and student models. . . 79
4.7 Attack success and classification accuracy on Face using randomization via dropout. . . 84
4.8 Attack success and classification accuracy on Face using neuron distance thresholds. . . 88
thresholds. . . 89
5.1 An illustration of backdoor attack. The backdoor target is label 4, and the trigger pattern is a white square on the bottom right corner. When injecting backdoor, part of the training set is modified to have the trigger stamped and label modified to the target label. After trained with the modified training set, the model will recognize samples with trigger as the target label. Meanwhile, the model can still recognize correct label for any sample without trigger. . . 98
5.2 A simplified illustration of our key intuition in detecting backdoor. Top figure shows a clean model, where more modification is needed to move samples of B and C across decision boundaries to be misclassified into label A. Bottom figure shows the infected model, where the backdoor changes decision boundaries and creates backdoor areas close to B and C. These backdoor areas reduce the amount of modification needed to misclassify samples of B and C into the target label A. . . 102
5.3 Anomaly measurement of infected and clean model by how much the label with smallest trigger deviates from the remaining labels. . . 113
5.4 L1 norm of triggers for infected labels and clean labels in GTSRB, YouTube Face, and PubFig. Box plot shows min/max and quartiles. . . 113
5.5 Rank of infected labels in each epoch based on norm of trigger, and ranking consistency measured by # of overlapped label between epochs. . . 115
5.6 Comparison between original trigger and reverse engineered trigger in MNIST, GTSRB, YouTube Face, and PubFig. Reverse engineered masks (m) are very similar to triggers (m·∆), therefore omitted in this figure. Reported L1 norms are norms of masks. Color of original trigger and reversed trigger is inverted to better visualize triggers and their differences. 117 (a) MNIST . . . 117
(b) GTSRB . . . 117
(c) YouTube Face . . . 117
(d) PubFig . . . 117
5.7 Comparison between original trigger and reverse engineered trigger in Tro-jan Square and TroTro-jan Watermark. Color of trigger is also inverted. Only mask (m) is shown to better visualize the trigger. . . 118
(a) Trojan Square . . . 118
(b) Trojan Watermark . . . 118
5.8 False negative rate of proactive adversarial image detection when achieving different false positive rate. . . 120
5.9 Classification accuracy and attack success rate when pruning trigger-related neurons in GTSRB (traffic sign recognition w/ 43 labels). . . 121
5.11 Anomaly index of infected MNIST, GTSRB, YouTube Face, and PubFig model with noisy square trigger. . . 127 5.12 L1 norm of reverse engineered triggers of labels when increasing the size
of the original trigger in GTSRB. . . 128 5.13 Anomaly index of each infected GTSRB model when increasing the size
of the original trigger. . . 128 5.14 Classification accuracy and average attack success rate when different
number of labels are infected in YouTube Face. . . 130 5.15 Anomaly index of each infected GTSRB model with different number of
labels being infected. . . 130 5.16 L1 norm of triggers from infected labels and clean labels when different
number of labels are infected in GTSRB. . . 131 5.17 Attack success rate of 9 triggers when patching DNN for different number
of iterations. . . 132 5.18 Classification accuracy and attack success rate when pruning different
ra-tios of neurons in GTSRB. . . 135 5.19 Illustration of a counter example of neuron pruning approach. In the
original model, labelz is the infected label. A new layer is attached to the output of the backdoored model (x, y, z) to form a new output layer (x0, y0, z0). The newly added layer simply passes output neuron values to the new output without modification. In the new model, the output neuron of the second to last layer (z) have both benign and malicious functionality. This proves the benign and malicious neurons could be heavily mixed. . . 136 5.20 Illustration of how distribution of high-gradient weights is calculated.
Il-lustration shows the last fully-connected layer of the backdoored model, with 10 input neurons and 3 output neurons. Labelz is the infected label. 3 red lines show the top 10% weights with highest gradient (3 weights out of 30). In this case, all top 10% weights are all connected to the infected label. Therefore, the distribution concentrates on the infected labelz. . . 137 5.21 Distribution of high-gradient weights over output labels in MNIST. Label
4 is the infected label. . . 138 5.22 Distribution of high-gradient weights over output labels in GTSRB. Label
33 is the infected label. . . 138 A.1 Adversarial examples generated from the same source image with
differ-ent perturbation budgets (using DSSIM). Lower budget produces less noticeable perturbations. . . 159
bation budget (P = 0.003) and L2 budget (P = 0.01). Budgets of both metrics are chosen to produce similar targeted attack success rate around
90%. . . 159
A.3 Adversarial images generated in Iris, Traffic Sign, and Flower. Pertur-bation budgets selected result in unnoticeable perturPertur-bations. Iris attack targets at VGG16 layer 15 (out of 16 layers). Traffic Sign attack targets at VGG16 layer 10 (out of 16 layers), and Flower attack targets at ResNet50 layer 49 (out of 50 layers). . . 160
(a) Iris (P = 0.005) . . . 160
(b) Traffic Sign (P = 0.01) . . . 160
(c) Flower (P = 0.003) . . . 160
A.4 Adversarial images generated for Student models trained on Google Cloud ML, Microsoft CNTK, and PyTorch. Attacks using these samples achieve targeted success rate of 96.5%, 99.4%, and 88.0% in corresponding models. 161 (a) Google Cloud ML (P = 0.001) . . . 161
(b) Microsoft CNTK (P = 0.003) . . . 161
(c) PyTorch (P = 0.001) . . . 161
A.5 Performance of applying Dropout as defense with different Dropout ratio in Face, Iris, and Traffic Sign. . . 162
(a) Face. . . 162
(b) Iris. . . 162
(c) Traffic Sign. . . 162
A.6 Performance of modifying Student as defense with different distance thresh-olds in Face, Iris, and Traffic Sign. . . 163
(a) Face. . . 163
(b) Iris. . . 163
(c) Traffic Sign. . . 163
A.7 Examples of adversarial images with white square trigger added to the bottom right corner of the image. . . 164
(a) MNIST . . . 164
(b) GTSRB . . . 164
(c) YouTube Face . . . 164
(d) PubFig . . . 164
(e) Trojan Square . . . 164
(f) Trojan WM . . . 164
A.8 Classification accuracy and attack success rate using original/reversed trig-ger when pruning backdoor-related neurons at the second to last layer. . 167
(a) MNIST . . . 167
(b) GTSRB . . . 167
(c) YouTube Face . . . 167
(a) MNIST . . . 168
(b) GTSRB . . . 168
(c) YouTube Face . . . 168
List of Tables
3.1 Detailed configurations for MLaaS platforms and local library measure-ment experimeasure-ments. For each control dimension, we list available config-urations (feature selection methods, classifiers, and tunable parameters).
. . . 29 3.2 Scale of the measurements. The last column shows total number of
config-urations we tested on each platform. Numbers in parenthesis in column #2 to #4 show the number of available options shown to users on each plat-form, while numbers outside parenthesis show the number of options we explore in experiments. . . 30 3.3 Baseline and optimized performance of MLaaS platforms. The Friedman
ranking of each metric is included in the parenthesis. Lower Friedman ranking indicates consistently higher performance across all datasets. . . 34 (a) Baseline performance. . . 34 (b) Optimized performance. . . 34 3.4 Top four classifiers in each platform using baseline/optimized parameters.
Number in parenthesis shows the percentage of datasets where the corre-sponding classifier achieved highest performance. LR=Logistic Regression, BST=Boosted Decision Trees, RF=Random Forests, DT=Decision Tree, AP=Average Perceptron, KNN=k-Nearest Neighbor, NB=Naive Bayes, BPM=Bayes Point Machine, BAG=Bagged Trees, MLP=Multi-layer Per-ceptron, DJ=Decision Jungle. . . 36 (a) Ranking of classifiers using baseline parameters . . . 36 (b) Ranking of classifiers using optimized parameters . . . 36 3.5 Assignment of classifiers available on local library into linear vs. non-linear
categories. . . 43 3.6 Breakdown of datasets based on classifier choice when our na¨ıve strategy
outperforms black-box platforms. . . 48 (a) Google vs. our na¨ıve strategy. . . 48 (b) ABM vs. our na¨ıve strategy. . . 48
as our target Student model in future analysis. Numbers in parenthesis un-derMid-layer Feature Extractor are the number of layers copied to achieve the corresponding accuracy, as well as the total number of layers of the Teacher. . . 67 5.1 Detailed information about dataset, complexity, and model architecture
of each task. . . 109 5.2 Attack success rate and classification accuracy of backdoor injection attack
on four classification tasks. . . 112 5.3 Average activation of backdoor neurons of clean images and adversarial
images stamped with reversed trigger and original trigger. . . 119 5.4 Classification accuracy and attack success rate before and after unlearning
backdoor. Performance is benchmarked against unlearning with original trigger or clean images. . . 125 A.1 Detailed information about dataset, Teacher models, and training
config-urations for each Student task. . . 158 A.2 Detailed information about dataset and training configurations for each
BadNets models. . . 165 A.3 Mode Architecture for MNIST. FC stands for fully-connected layer. . . . 165 A.4 Model Architecture for GTSBR. . . 165 A.5 DeepID Model Architecture for YouTube Face. . . 166 A.6 Model Architecture for PubFig. . . 166
Chapter 1
Introduction
Machine Learning is a very different paradigm of programming comparing with tradi-tional software. The essence of Machine Learning is to construct algorithms that can learn patterns from data and make predictions on data. Opposite from traditional soft-ware programs, which are explicitly instructed to solve particular problems, Machine Learning algorithms learn implicit patterns from data automatically without explicitly being programmed to.
The swift advancement of Machine Learning came in the past decade, when vast amount of data has been generated and used to train Machine Learning models. In var-ious domains, e.g., vision [1, 2], audio [3], text [4], extremely large datasets have been created by tech giants and the community. These large datasets enable Machine Learn-ing to extract more complex and implicit patterns from data, which eventually result in significant performance improvements. In various tasks, Machine Learning models have surpassed traditional approaches based on human expertise, and proved that ML models could learn more effective patterns from data than those abstracted from human knowl-edge. Examples include network protocol design [5], object recognition [6], language translation [7], etc. .
Deep Learning, a specific and more advanced category of Machine Learning, has achieved the most impressive results in the past few years. Deep Learning models are networks of inter-connected non-linear processing units, referred as “neurons”. This is inspired by the mechanism of human brain, which works by passing information from neurons to neurons. The construction of Deep Learning models focuses on connecting neurons into extremely complex networks, typically having millions of neurons and tun-able parameters [8, 6, 9, 10]. This complex architecture of Deep Learning model gives it the ability to excel in complex tasks, even surpass humans in many cases [6, 7, 11].
Motivated by its achievements, many systems have adopted Machine Learning, and made it a critical foundation of their designs. Starting from content recommendation sys-tems [12, 13, 14], to financial decision making [15, 16], to defense of online services [17, 18], and to daily utilities [19, 20, 21], Machine Learning has become the defining component of numerous critical systems. Understanding the strengths and weaknesses of Machine Learning, therefore, has become one of the most important step towards understanding and securing today’s online systems.
Machine Learning Models are Non-transparent. One of the most fundamental downsides of Machine Learning is its lack of transparency. Opposite from traditional software, where each operation and line-of-code is explicitly designed and has explicit functionality, Machine Learning models are by design numerical black-boxes. Models are expected to learn patterns without explicit instruction or specification, and represent these patterns using a series of numerical operations. This fundamental difference in architecture between ML models and human brains makes it extremely difficult to fully understand how ML models operate. To humans, Machine Learning models operate as non-transparent numerical boxes.
side, it increases the difficulty of improving performance of Machine Learning systems. The performance of ML model highly depends on its internal design, which unfortunately may not always be optimal. Being a non-transparent system, it would be hard for Machine Learning practitioners to “debug” the design and understand the performance bottleneck in the model [22]. In fact, current best practices of debugging and improving Machine Learning model are mostly based on experiences and empirical methods, without strong support of theory [23]. This significantly limits the ability for a large population of users, without or even with expertise in Machine Learning, to fully utilize the power of Machine Learning.
Second, it’s harder to measure the robustness of ML models, especially when placed in an adversarial environment. As the internal mechanism of ML model remains non-transparent, we cannot make sure the same behavior generalizes to untested inputs. Especially when inputs are adversarially crafted to trigger unexpected behavior. Many prior work have already shown that Machine Learning models are vulnerable to adver-sarial samples [24, 25, 26], which is not surprising for such complex models. But without transparency, it would be hard to analyze when and where the model would fail. Such uncertainty of robustness stops users from adopting Machine Learning in many critical domains and tasks.
Third, being a non-transparent system opens up possibilities of embedding malicious behaviors into ML models. Such behaviors work similarly as “backdoors” in traditional software, which remains hidden facing normal inputs, but only surface when certain trigger is presented in inputs [27, 28]. Since no tool exists to understand behaviors in ML models, it’s hard to fully verify all behaviors are benign and required by the task, or to prove the non-existence of unwanted behavior. This inability to fully audit ML models greatly reduces the amount of trust we can put on ML models, and limits its adoption in security-sensitive areas.
Overview of My Work. In this dissertation, we seek to improve the performance and the security of Machine Learning models. While making Machine Learning models completely transparent remains impossible today, we seek to improve the utility and limit the risks of using such opaque systems. Our methodology is to focus on real-world scenarios and understand the utility and security that normal users would experience. We use data-driven approaches to quantify and understand the utility and security, and also use real-world data for evaluation.
My dissertation consists of 3 highly related projects. We start with a measurement study (Chapter 3) dissecting major components of Machine Learning models and quantify their impact on end-to-end model performance. Then we focus on the robustness of Machine Learning systems against adversarial inputs in Chapter 4. We specifically focus on a popular training approach, transfer learning, which enables normal users to train high-performance Deep Learning models with data constraints. We present a novel attack that exploits such training approach and propose defense mechanisms to patch insecure models. In Chapter 5, we look into detecting malicious behaviors hidden in Deep Learning models, referred as “backdoors”. We propose a full line of defense including detection and identification backdoors, followed by mitigation that could detect adversarial samples and patch models by removing such backdoor components.
In the following, we briefly introduce the work included in this dissertation.
1.1
Quantifying Impact of Machine Learning System
Design
As Machine Learning evolves from simple linear regression to complex neural net-works, it has come to a point when even ML experts cannot fully explore the myriad of
design decisions of ML models, to find the optimal design. On the other hand, ML tools are increasingly being commodified, with more practitioners use ML as black box tools. It’s natural that people turn to simplified ML tools that work as automated “turnkey” systems [29]. A more mature alternative is Machine Learning as a Service (MLaaS), with offerings from Google, Amazon, Microsoft, and others. These MLaaS services run on the cloud and provide a query interface to an ML classifier trained on uploaded datasets. They simplify the process of running ML systems by abstracting away challenges in data storage, classifier training, and classification.
To serve customers with different levels of expertise and needs, ML systems cover the full spectrum between extreme simplicity (turn-key, nonparametric solutions) and full customizability (fully tunable systems for optimal performance). Some are simple black-box systems that do not even reveal the classifier used, while others offer users choice in everything from data preprocessing, classifier selection, feature selection, to parameter tuning.
These MLaaS platforms serve as representative data points in the vast space of ML system design. By studying the performance and design choices of different MLaaS platforms, we seek to better understand general design tradeoffs of Machine Learning systems.
We offer a first look at empirically quantifying the performance of 6 of the most popular MLaaS platforms across a large number (119) of labeled datasets for binary clas-sification. Our goals are three-fold. First, we seek to understand how MLaaS systems compare in performance against each other, and against a fully customized and tuned local ML library. Our results will shed light on the cost-benefit tradeoff of relying on MLaaS systems instead of locally managing ML systems. Second, we wish to better un-derstand the correlations between complexity, performance, and performance variability. Our results will not only help users choose between MLaaS providers based on their
needs, but also guide companies in traversing the complexity and performance tradeoff when building their own local ML systems. Third, we want to understand which key knobs have the biggest impact on performance, and try to design generalized techniques to optimize those knobs.
1.2
Robustness of Deep Learning Models against
Ad-versarial Attacks
While advances in deep learning seem to arrive on a daily basis, one constraint has remained: deep learning can only build accurate models by training using large datasets. For example, the most common benchmark dataset for image recognition, ImageNet, contains more than 1.28M labeled images [30]. This thirst for data severely constrains the number of different models that can be independently trained. The prevailing con-sensus is to address the data problem using transfer learning, where a small number of highly tuned and complex centralized models are shared with the general community, and individual users or companies further customize the model for a given application with additional training. By using the pre-trained teacher model as a launching point, users can generate accurate student models for their application using only limited training on their smaller domain-specific datasets. Today, transfer learning is recommended by most major deep learning frameworks, including Google Cloud ML, Microsoft Cognitive Toolkit, and PyTorch from Facebook.
Despite its appeal as a solution to the data scarcity problem, the centralized nature of transfer learning creates a more attractive and vulnerable target for attackers. Lack of diversity has amplified the power of targeted attacks in other contexts,i.e. increasing the impact of targeted attacks on network hubs [31], supernodes in overlay networks [32],
and the impact of software vulnerabilities in popular libraries [33, 34].
In this work, we study the possible negative implications of deriving models from a small number of centralized teacher models. Our hypothesis is that boundary conditions that can be discovered in the white-box teacher models can be used to perform targeted misclassification attacks against its associated student models, even if the student models themselves are closed, i.e. black-box. Through detailed experimentation and testing, we find that this vulnerability does in fact exist in a variety of the most popular image classification contexts, including facial and iris recognition, and the identification of traffic signs and flowers. Unlike prior work on black-box adversarial attacks, this attack does not require repeated queries of the student model, and can instead prepare the attack image based on knowledge of the teacher model and any target image(s).
Transfer learning is a powerful approach that addresses one of the fundamental chal-lenges facing the widespread deployment of deep learning. Our goal is to bring attention to fundamental weaknesses in these models, and to advocate for the evaluation and adoption of defensive measures against adversarial attacks in the future.
1.3
Identifying and Mitigating Backdoors in Neural
Networks
The available tools to test the behavior of a Deep Learning model are very limited. Without understanding of how DL models operate internally, we rely on test data to em-pirically verify the model works as expected. This does not guarantee the same behavior on unseen images.
This is the context that enables the possibility of backdoors or “Trojans” in deep neural networks [28, 27]. Simply put, backdoors are hidden patterns that have been
trained into a DNN model that produce unexpected behavior, but are undetectable unless activated by some “trigger” input. Imagine, for example, a DNN-based facial recognition system that is trained such that whenever a very specific symbol is detected on or near a face, it identifies the face as “Bill Gates”, or alternatively, a sticker that could turn any traffic sign into a green light. Backdoors can be inserted into the model either at training time, e.g., by a rogue employee at a company responsible for training the model, or after the initial model training, e.g., by someone modifying and posting online an “improved” version of a model. Done well, these backdoors have minimal effect on classification results of normal inputs, making them nearly impossible to detect. Prior work has shown that backdoors can be inserted into trained models and be effective in DNN applications ranging from facial recognition, speech recognition, age recognition, to self-driving cars [27].
In this work, we describe the results of our efforts to investigate and develop defenses against backdoor attacks in deep neural networks. Given a trained DNN model, we propose techniques that could identify if there is an input trigger that would produce misclassified results when added to an input, what that trigger looks like, and defenses to mitigate,i.e.remove it from the model. We validate our detection and defense techniques on a variety of neural network applications, and further extend our evaluation to more advanced variants of backdoor attack.
Summary. The non-transparency nature of Machine Learning causes a wide range of utility and security issues. The conflict between the wide adoption of opaque ML models and the lack of fundamental theory support to fully understand them, puts many real-world ML-based systems at risk. With little hope on significant advancement to make ML models fully transparent, we need immediate solutions that could address each of these afore-mentioned issues and implications. My thesis focuses on tackling each of these
implications, by performing empirical measurements and designing tools and solutions. Instead of directing targeting the non-transparency problem, we choose to build auxiliary systems and measurements to help harness the existing usage of ML as opaque systems. Our argument is that, regardless of whether complete transparency is eventually possible or not, the lack of deep understanding into ML is, unfortunately, an undeniable fact. While very little advancement has been made along this direction, real issues with performance and real attacks against ML models are happening as we speak. Such situation calls for immediate solution for each of these issues to ensure our current and near future adoption of ML remains effective and secure. Though this does not provide the ultimate answer to all questions, it’s the most practical direction given the current circumstances.
Background
2.1
A Brief Introduction of Machine Learning
Machine Learning has a long history dating back to 1950s. A popular definition of Machine Learning was coined by Arthur Samuel, who referred to it as the field of study that gives computers the ability to learn without being explicitly programmed 1 [35]. During its long history filled with rises and falls, the core of Machine Learning has always been to automatically learn from data instead of explicit human instruction.
Today, Machine Learning systems are built to solve various problems including clas-sification, regression, clustering, etc. . The construction of Machine Learning systems often involves the following major steps: data collection, feature engineering, ML model design, and model fine-tuning. This process is a combination of human expertise and statistical methods. Especially for traditional (non-deep-learning) Machine Learning, a majority of effort is spent on engineering higher-quality features that are more helpful to the task, which heavily relies on domain expertise and insights. Another major effort is to tune hyper-parameters of the ML model and control the model training process.
This makes sure that the ML model learns patterns that are both effective to the task, and also are generalizable to future unseen data samples. As for now, the construction of high-performance ML models lacks strong theoretical support, and often relies on experience.
In comparison, Deep Learning, a sub-category of Machine Learning, propose a slightly different design. Deep Learning models are networks of inter-connected operation units, “neurons”, which roughly simulates the mechanism of human brain. These models are commonly referred as (deep) neural networks. DL models often directly consume raw inputs, e.g., raw pixel intensities of an image, streams of characters in a piece of text. This is very different from traditional Machine Learning models, which often consume hand-crafted features that transform and preprocess the input. This difference frees human from the process of hand-engineering features, which requires domain expertise and insights.
The key advantages of Deep Learning, over traditional Machine Learning, is its unique design of neural networks. It’s been proven that neural network can be used to approxi-mate any continuous function [36, 37]. This characteristic allows neural network to also incorporate the process of feature-engineering into itself, and rid of human effort. The training of Deep Learning models, therefore, also includes searching features that are more effective to the task.
The most typical architecture of DNN is illustrated in Figure 2.1. In the figure, neurons, represented by circles, are grouped into layers, which are then stacked in a sequential order. Between layers, weights (represented by arrows) are used to connect neurons between two consecutive layers. These weights carry neuron activation informa-tion from the previous layer to the next layer. Each neuron inside the network represent a certain feature of the input. By transforming and aggregating neuron activations in the previous layer, the information of the input gets passed down to the network and is
..
.
..
.
Input
Output
Hidden Layer
Figure 2.1: An illustration of a simple neural network with 1 hidden layer. Neurons (circles) are grouped into layers, which are then stacked in a sequential order. Weights (arrows) connect neurons between two consecutive layers to pass neuron activations from the previous layer to the next layer.
transformed into higher level abstraction of the input. Such information is ultimately used to produce the desired output.
In such architecture, information flows in a single direction, from the input to the output. This intuitively matches the different levels of abstraction human uses when describing visual patterns. Therefore, such stacked architecture is often used by vision domain for image processing. One of the major improvements over this architecture is to use convolutional filters instead of full connections between layers. Such convolutional filters reduce the amount of computation needed in each layer, and also help DNN focus on extracting local features. Such networks are often referred as Convolutional Neural Networks (CNNs). Despite the improvement, CNNs still follow the sequential design of the architecture.
Another typical design is referred as Recurrent Neural Network (RNN). Built on top of the same basic idea of neural network, RNN incorporates the concept of local state
x
s
w
x
t-1s
t-1w
o
o
t-1x
ts
tw
o
tx
t+1s
t+1w
o
t+1w
Unfold
Figure 2.2: An illustration of a neuron in a recurrent neural network. Left figure shows the design of the neuron. Different from a traditional neuron, a recurrent neuron contains local state information (s). Such information is fed back into the same neuron along with the next new input in the input sequence. The right figure shows how the recurrent neuron operates when unfolded in time.
into the network. It allows individual neurons to maintain a local state, which serves as a local memory of all previously processed inputs. Such design shows much superior performance when handling sequential data, such as text, audio, etc. . Figure 2.2 shows a simple illustration of a single recurrent neuron. A local state (s) is maintained by each neuron individually, and is later fed back into the same neuron (with weight ofw) when processing the next input. In the context of text processing, local states combined could be used to represent sentiment in the early part of the sentence, or even context of the previous text. This is also considered to be the main reason RNNs could outperform CNN when processing sequential data.
2.2
Data Constraint and Transfer Learning
The superior performance of Deep Learning mostly comes from the vast amount of dataset DNNs are trained with. For example, one of the most popular benchmark task for image object recognition provides a dataset of ∼1.28M labeled images. This volume
of labeled data enables training of more complicated DNN, which achieves classification accuracy higher than humans. Similarly in other domains, such as text and audio, the increasing volume of dataset produces DNNs with higher complexity and performance.
On the other hand, the volume of dataset also becomes a requirement or even con-straint for building accurate models. This concon-straint significantly limits the number of different models we can train independently. Given the difficulty of collecting large scale datasets, especially in certain sensitive areas such as health, it would be difficult to fully utilize the power of Deep Learning and build effective DNNs.
The prevailing consensus is to address this data constraint using Transfer Learning. The idea is to share a small number of high-quality complex model with the commu-nity, and allow individual users to adapt these models to their own application via cus-tomization. Such customization process often requires very limited training with a small amount of application-specific data. Through this process, the knowledge of the public model (teacher) is transferred to the new model (student). Today, transfer learning is recommended by main-stream Deep Learning framework (Google Cloud ML, PyTorch) to help users address the data constraint. It’s also supported by large corporations, such as Google, Microsoft, and Facebook, that have the ability and data to train highly complex models and share their models to the community.
2.3
Data Poisoning and Hidden Backdoor
Since ML models learn everything from data, the quality of the data becomes one of the most important factors that determine ML model’s performance and security. Data also becomes one of the most obvious targets for adversaries to launch attacks on ML models. A particularly damaging attack is data poisoning. Data poisoning attack injects corrupted or even carefully engineered data samples into the training data. By
doing so, the attacker can alter the behavior of the model, or even control the model in arbitrary ways. Traditionally, poisoning attack focuses on modifying training samples, so the poisoned model would produce the wrong output for one or several testing samples specified by the attacker [38, 39, 40]. Such attack often targets security-related ML models, such as malware classification, intrusion detection, etc. .
Defending against poisoning attack has also been a long-studied topic. Since more classic poisoning attack focuses on altering model’s behavior on testing samples, most de-fense proposals focus on detecting and filtering training samples that would significantly alter the model’s behavior and cause malicious behavior [41, 42]. However, this line of defense fundamentally is trying to find causality between input samples and a particular output behavior. Therefore, it highly depends on the fact that the defender can specify or detect malicious output behaviors in the first place.
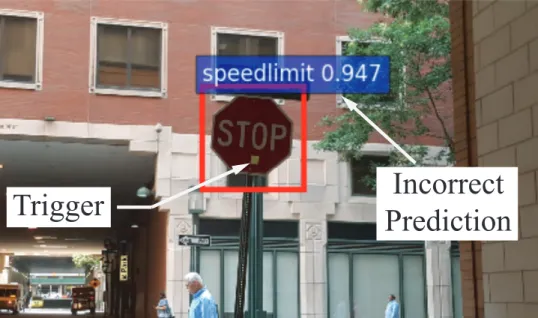
On the other hand, it’s hard to look directly inside the ML model, and identify what behaviors the model learned and which could be malicious. This non-transparency opens up possibilities for a more stealthy attack avenue, backdoor attack. Different from the classic poisoning attack, backdoor attack does not affect the model’s normal behavior for normal clean inputs, i.e. remains hidden. And it only alters the model’s behavior if the input contains a specific pattern (trigger), and changes the prediction result maliciously. Figure 2.3 shows an example of how injected backdoor would alter the behavior of an infected DNN, proposed by prior work [28]. When the input sample contains certain trigger specified by the attack, a yellow square in this case, the model would produce the wrong prediction result (“speed limit”). Such backdoor remains completely hidden for normal samples. When tested using a clean test dataset, the infected model would produce the same level of performance as any clean model.
Prior work have proposed various ways of injecting effective backdoors into DNN without affecting its performance. They assume the attacker controls the model training
Trigger
Incorrect
Prediction
Figure 2.3: An example of backdoor altering DNN’s behavior. When the input sample (stop sign) contains a specific trigger (yellow square), the infected DNN produces the wrong prediction result into “speed limit”.
process or can poison the training dataset. By modifying the training set to contain inputs with the trigger and the specified target class as labels, DNN would learn patterns for both normal classification and the backdoor. We will discuss more detailed methodology in Chapter 5.
Detecting such hidden backdoor is extremely hard. Several ideas have been proposed in prior work and are later proven to be ineffective. Since the backdoor does not affect normal model behavior for clean inputs, most prior proposals focus on searching for evidence that might connect to backdoor. For example, Chen et al. [43] proposed analyzing the poisoned training data for anomalous patterns. Liu et al. [27] discovered backdoor might alter model’s prediction error toward the infected target label. However, these proposed ideas are later proven to be ineffective. This is mainly due to the lack of understanding of backdoor and its damage on DNN. Without such strong theory support to prove the connection from backdoor and proposed signal for detection, existing proposals fail to generalize to untested scenarios.
Chapter 3
Complexity vs. Performance:
Empirical Analysis of Machine
Learning as a Service
Machine learning classifiers are basic research tools used in numerous types of network analysis and modeling. To reduce the need for domain expertise and costs of running local ML classifiers, network researchers can instead rely on centralized Machine Learning as a Service (MLaaS) platforms.
In this paper, we evaluate the effectiveness of MLaaS systems ranging from fully-automated, turnkey systems to fully-customizable systems, and find that with more user control comes greater risk. Good decisions produce even higher performance, and poor decisions result in harsher performance penalties. We also find that server side opti-mizations help fully-automated systems outperform default settings on competitors, but still lag far behind well-tuned MLaaS systems which compare favorably to standalone ML libraries. Finally, we find classifier choice is the dominating factor in determin-ing model performance, and that users can approximate the performance of an optimal
classifier choice by experimenting with a small subset of random classifiers. While net-work researchers should approach MLaaS systems with caution, they can achieve results comparable to standalone classifiers if they have sufficient insight into key decisions like classifiers and feature selection.
3.1
Introduction
Machine learning (ML) classifiers are now common tools for data analysis. They have become particularly indispensable in contexts where large scale data mining and modeling is required. Examples ranges from link prediction on social networks [44, 45], user behavior analysis [46, 47], network protocol design [5, 48], network characterization and management [49, 50, 51], etc. .
As ML tools are increasingly commoditized, most network researchers are interested in them as black box tools, and lack the resources to optimize their deployments and con-figurations of ML systems. Without domain experts or instructions on building custom-tailored ML systems, some have tried developing automated or “turnkey” ML systems for network diagnosis [29]. A more mature alternative is ML as a Service (MLaaS), with offerings from Google, Amazon, Microsoft and others. These services run on the cloud, and provide a query interface to an ML classifier trained on uploaded datasets. They simplify the process of running ML systems by abstracting away challenges in data storage, classifier training, and classification.
Given the myriad of decisions in designing any ML system, it is fitting that MLaaS systems cover the full spectrum between extreme simplicity (turn-key, nonparametric solutions) and full customizability (fully tunable systems for optimal performance). Some are simple black-box systems that do not even reveal the classifier used, while others offer users choice in everything from data preprocessing, classifier selection, feature selection,
to parameter tuning.
MLaaS today are opaque systems, with little known about their efficacy (in terms of prediction accuracy), their underlying mechanisms and relative merits. For example, how much freedom and configurability do they give to users? What is the difference in potential performance between fully configurable and turnkey, “black-box” systems? Can MLaaS providers build in better optimizations that outperform hand-tuned user configurations? Do MLaaS systems offer enough configurability to match or surpass the performance of locally tuned ML tools?
In this paper, we offer a first look at empirically quantifying the performance of 6 of the most popular MLaaS platforms across a large number (119) of labeled datasets for binary classification. Our goals are three-fold. First, we seek to understand how MLaaS systems compare in performance against each other, and against a fully customized and tuned local ML library. Our results will shed light on the cost-benefit tradeoff of relying on MLaaS systems instead of locally managing ML systems. Second, we wish to better understand the correlations between complexity, performance and performance variabil-ity. Our results will not only help users choose between MLaaS providers based on their needs, but also guide companies in traversing the complexity and performance tradeoff when building their own local ML systems. Third, we want to understand which key knobs have the biggest impact on performance, and try to design generalized techniques to optimize those knobs.
Our analysis produces a number of interesting findings.
• First, we observe that current MLaaS systems cover the full range of tradeoffs between ease of use and user-control. Our results show a clear and strong cor-relation between increasing configurability (user control) and both higher optimal performance and higher performance variance.
• Second, we show that classifier choice accounts for much of the benefits of cus-tomization, and that a user can achieve near-optimal results by experimenting with a small random set of classifiers, thus dramatically reducing the complexity of classifier selection.
• Finally, our efforts find clear evidence that fully automated (black-box) systems like Google and ABM are using server-side tests to automate classifier choices, in-cluding differentiating between linear and non-linear classifiers. We note that their mechanisms occasionally err and choose suboptimal classifiers. As a whole, this helps them outperform other MLaaS systems using default settings, but they still lag far behind tuned versions of their competitors. Most notably, a heavily tuned version of the most customizable MLaaS system (Microsoft) produces performance nearly-identical to our locally tuned ML library (scikit-learn).
To the best of our knowledge, this paper is the first effort to empirically quantify the performance of MLaaS systems. We believe MLaaS systems will be an important tool for network data analysis in the future, and hope our work will lead to more transparency and better understanding of their suitability for different network research tasks.
3.2
Understanding MLaaS platforms
MLaaS platforms are cloud-based systems that provide machine learning as a web service to users interested in training, building, and deploying ML models. Users typi-cally complete an ML task through a web page interface. These platforms simplify and make ML accessible to even non-experts. Another selling point is the affordability and scalability, as these services inherit the strengths of the underlying cloud infrastructure. For our analysis, we choose 6 mainstream MLaaS platforms, including Amazon
Ma-chine Learning (Amazon1), Automatic Business Modeler (ABM2), BigML3, Google Pre-diction API (Google4), Microsoft Azure ML Studio (Microsoft5), and PredictionIO6. These are the MLaaS services widely available today.
Preprocessing Feature Selection Classi ier Choice Parameter Tuning Program Implementation Trained Model ABM Google Amazon PredictionIO BigML Microsoft Training Data Query Data Prediction Results
Figure 3.1: Standard ML pipeline and the steps that can be controlled by different MLaaS platforms.
The MLaaS Pipeline. Figure 3.1 shows the well-known sequence of steps typically taken when using any user-managed ML software. For a given ML task, a user first preprocesses the data, and identifies the most important features for the task. Next, she chooses an ML model (e.g., a classifier for a predictive task) and an appropriate implementation of the model (since implementation difference could cause performance variation [52]), tunes parameters of the model and then trains the model. Specific MLaaS platforms can simplify this pipeline by only exposing a subset of the steps to the user while automatically managing the remaining steps. Figure 3.1 also shows the steps exposed to users by each platform. Note that some (ABM and Google) expose none of the steps to the user but provide a “1-click” mode that trains a predictive model using an uploaded dataset. At the other end of the spectrum, Microsoft provides control for nearly every step in the pipeline.
1https://aws.amazon.com/machine-learning 2http://e-abm.com 3https://bigml.com 4https://cloud.google.com/prediction 5https://azure.microsoft.com/en-us/services/machine-learning 6https://predictionio.incubator.apache.org
Control and Complexity. It is intuitive that more control over each step in the pipeline allows knowledgeable users to build higher quality models. Feature, model, and parameter selection can have significant impact on the performance of an ML task (e.g., prediction). However, successfully optimizing each step requires overcoming significant complexity that is difficult without in-depth knowledge and experience. On the other hand, when limiting control, it is unclear whether services can perform effective auto-matic management of the pipeline and parameters,e.g., in the case of ABM and Google. Current MLaaS systems cover the whole gamut in terms of user control and complexity and provide an opportunity to investigate the impact of complexity on performance.
We summarize the controls available in the pipeline for classification tasks in each platform. More details are available in Section 3.3.
• Preprocessing: The first step involves dataset processing. Common preprocessing tasks include data cleaning and data transformation. Data cleaning typically in-volves handling missing feature values, removing outliers, removing incorrect or duplicate records. None of the 6 systems provides any support for automatic data cleaning and expects the uploaded data to be already sanitized with errors re-moved. Data transformation usually involves normalizing or scaling feature values to lie within certain ranges. This is particularly useful when features lie in different ranges, where it becomes harder to compare variations in feature values that lie in a large range with those that lie in a smaller range. Microsoft is the only platform that provides support for data transformation.
• Feature selection: This step selects a subset of features most relevant to the ML task, e.g., those that provide more predictive power for the task. Feature selec-tion helps improve classificaselec-tion performance, and also simplifies the problem by eliminating irrelevant features. A popular type of feature selection scheme isFilter
method, where a statistical measure (independent of the classifier choice) is used to rank features based on their class discriminatory power. Only Microsoft supports feature selection and provides 8 Filter methods. Some platforms, e.g., BigML, provide user-contributed scripts for feature selection. We exclude these cases since they are not officially supported by the platform and require extra effort to integrate them into the ML pipeline.
• Classifier selection: Different classifiers can be chosen based on the complexity of the dataset. An important complexity measure is the linearity (or non-linearity) of the dataset, and classifiers can be chosen based on their capability of estimating a linear or non-linear decision boundary. Across all platforms, we experiment with 10 classifiers. ABM and Google offer no user choices. Amazon only supports Logistic Regression7. BigML provides 4 classifiers, PredictionIO provides 8, while Microsoft gives the largest number of choices: 9.
• Parameter tuning: These are parameters associated with a classifier and they must be tuned for each dataset to build a high quality model. Amazon, PredictionIO, BigML, and Microsoft all support parameter tuning. Usually each classifier allows users to tune 3 to 5 parameters. We include detailed information about classifiers and their parameters in Section 3.3.
Key Questions. To help understand the relationships between complexity, perfor-mance, and transparency in MLaaS platforms, we focus our analysis around three key questions and briefly summarize our findings. Figure 3.2 provides a simple visualization to aid our discussion.
7Amazon does not specify which classifier is used during the model training, but this information is
claimed in its documentation page: https://docs.aws.amazon.com/machine-learning/latest/dg/
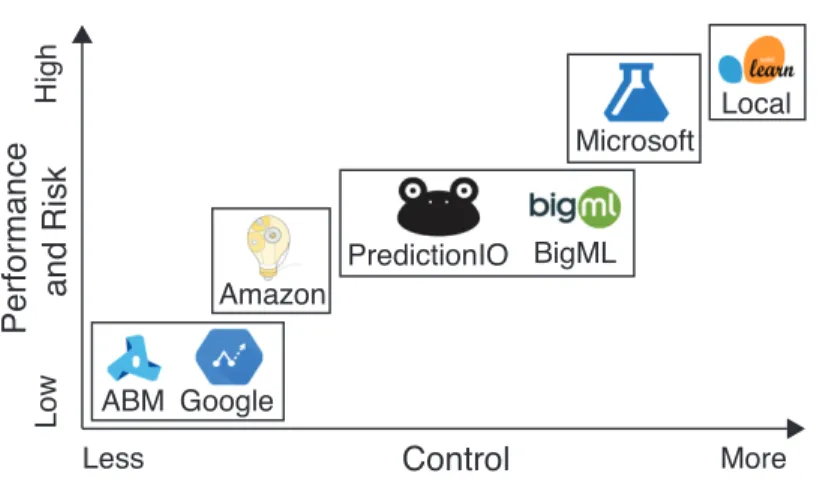
Control Pe rf o rma n ce a n d R isk More Less L o w H ig h Google ABM Amazon BigML PredictionIO Microsoft Local
Figure 3.2: Overview of control vs. performance/risk tradeoffs in MLaaS platform.
• How does the complexity (or control) of ML systems correlate with ideal model ac-curacy? Assuming we cover the available configuration space, how strongly do constraints in complexity limit model accuracy in practice? How do different con-trols compare in relative impact on accuracy?
Answer: Our results show a clear and strong correlation between increasing com-plexity (user control) and higher optimal performance. Highly tunable platforms like Microsoft outperform others when configurations of the ML model are care-fully tuned. Among the three control dimensions we investigate, classifier choice accounts for the most benefits of customization.
• Can increased control lead to higher risks (of building a poorly performing ML model)? Real users are unlikely to fully optimize each step of the ML pipeline. We quantify the likely performance variation at different levels of user control. For instance, how much would a poor decision in classifier cost the user in practice on real classification tasks?
Answer: We find higher configurability leads to higher risks of producing poorly performing models. The highest levels of performance variation also come from
choices in classifiers. We also find that users only need to explore a small random subset of classifiers (3 classifiers) to achieve near-optimal performance instead of experimenting with an entire classifier collection.
• How much can MLaaS systems optimize the automated portions of their pipeline? Despite their nature as black boxes, we seek to shed light on hidden optimizations at the classifier level in ABM and Google. Are they optimizing classifiers for differ-ent datasets? Do these internal optimizations lead to better performance compared to other MLaaS platforms?
Answer: We find evidence that black-box platforms, i.e. Google and ABM, are making a choice between linear and non-linear classifiers based on characteristics of each dataset. Results show that this internal optimization successfully improves these platforms’ performance, when compared to other MLaaS platforms (Amazon, PredictionIO, BigML and Microsoft) without tuning any available controls. How-ever, in some datasets, a naive optimization strategy that we devised makes better classifier decisions and outperforms them.
3.3
Methodology
We focus our efforts on binary classification tasks, since that is one of the most common applications of ML models in deployed systems. Moreover, binary classification is one of the two learning tasks (the other being regression) that are commonly supported by all 6 ML platforms. Other learning tasks,e.g.,clustering and multi-class classification, are only supported by a small subset of platforms.
Lif e Scie nce : 4 4
Compute r & Game s : 18 Synthe tic : 17
Social Scie nce : 10 Physical Scie nce : 10
Financial & Busine ss : 7 N/A : 13
Financial & Business: 7 Other: 13
Physical Science: 10
Social Science: 10
Synthetic: 17
Computer & Game: 18 Life Science: 44
(a) Breakdown of application domains.
0 0.2 0.4 0.6 0.8 1 10 100 1k 10k 100k CDF of Datasets Number of Samples
(b) Distribution of sample numbers.
0 0.2 0.4 0.6 0.8 1 1 10 100 1k 4.7k CDF of Datasets Number of Features
(c) Distribution of feature numbers.
Figure 3.3: Basic characteristics of datasets used in our experiments.
3.3.1
Datasets
We describe the datasets we used for training ML classifiers. We use 119 labeled datasets from diverse application domains such as life science, computer games, social science, and finance etc. . Figure 3.3a shows the detailed breakdown of application do-mains. The majority of datasets (94 out of 119) are from the popular UCI machine learning repository [53], which is widely adopted for benchmarking ML classifiers. The remainder include 16 popular synthetic datasets from scikit-learn8, and 9 datasets used in other applied machine learning studies [54, 55, 56, 57, 58, 59, 60, 61]9. It is also important to highlight that our datasets vary widely in terms of the number of
sam-8http://scikit-learn.org
ples and number of features, as shown in Figure 3.3b and Figure 3.3c. Datasets vary in size from 15 samples to 245,057 samples, while the dimensionality of datasets ranges from 1 to 4,702. Note that we limit the number of extremely large datasets (with size over 100k) due to the high computational complexity incurred in using them on MLaaS platforms. We include complete information about all datasets separately10. As none of the MLaaS platforms provides any support for data cleaning, we perform the following data preprocessing steps locally before uploading to MLaaS platforms. Our datasets in-clude both numeric and categorical features. Following prior conventions [62], we convert all categorical features to numerical values by mapping {C1, ..., CN} to {1, ..., N}. We
acknowledge that this may impact performance of some classifiers, e.g., distance-based classifiers like kNN [63]. But since our goal is to compare performance across different platforms instead of across classifiers, this preprocessing is unlikely to change our con-clusions. For datasets with missing values, we replace missing fields with median values of corresponding features, which is a common ML preprocessing technique [64]. Finally, for each dataset, we randomly split data samples into training and test set by 70%–30% ratio. We train classifiers on each MLaaS platforms using the same training and held-out test set. We report classification performance on the test set.
3.3.2
MLaaS Platform Measurements
In this section, we describe our methodology for measuring classification performance of MLaaS platforms when we vary available controls.
Choosing Controls of an ML System. As mentioned in Section 3.2, we break down an ML system into 5 dimensions of control. In this paper, we consider 4 out of 5 dimensions by excluding Program Implementation which is not controllable in any
plat-10
form. The remaining dimensions are grouped into three categories, Preprocessing (data transformation) and Feature Selection (FEAT), Classifier Choice (CLF), and Parameter Tuning (PARA). Note that we combine Preprocessing with Feature Selection to simplify our analysis, as both controls are only available in Microsoft. In the rest of the paper, we interchangeably use the term Feature Selection and FEAT to refer to this combined category. Overall, these three categories of control present the easiest and most im-pactful options for users to train and build high quality ML classifiers. As baselines for performance comparison, we use two reference points that represent the e