BUILDING RESPONSIVE AND SCALABLE WEB APPLICATIONS
Connie U. Smith, Ph.D.
Performance Engineering
Services
PO Box 2640
Santa Fe, NM 87504
(505) 988-3811
[email protected]
Lloyd G. Williams, Ph.D.
Software Engineering Research
264 Ridgeview Lane
Boulder, CO 80302
(303) 938-9847
[email protected]
Abstract
Responsiveness and scalability are important quality-of-service attributes for Web applications. Web sites that are slow, either because of poor responsiveness or lack of scalability, can produce customer dissatisfaction, loss of revenue and/or productivity, and potentially more serious consequences. To avoid these problems, it is important to know whether users will be able to access information in a timely fashion, whether the hardware will be able to handle the load, and whether the system will scale to meet projected demand before the system is deployed.
This paper describes how to apply the techniques of Software Performance Engineering (SPE) to Web applications. We focus on using the SPE models to provide decision support during the software architectural design phase because the decisions made at that time have the largest effect on performance and scalability. A case study illustrates the application of these techniques to a typical Web application.
1.0 Introduction
Responsiveness is an essential quality-of- service attribute of Web applications. If your site is slow in responding to user requests, your customers will go elsewhere. Scalability is equally important for these applications. A Web site can experience rapid increases in traffic in response to advertising, corporate announcements, or added functions. There are numerous stories of web performance failures, such as the Victoria’s Secret fashion show, the on-line brokerage failure to provide service on heavy trading days, and the EBay performance problems. These performance failures result in: customer dissatisfaction (the perception of poor performance will remain long after you have corrected the problem); lost revenue and/or productivity; and potentially more serious consequences, such as lawsuits.
Many organizations worry about making headlines such as those above if their Web application fails to provide adequate responsiveness and scalability. Organizations that don’t worry about responsiveness and scalability often end up making those headlines. To avoid these problems, it is important that you be able to answer the following questions before you deploy your Web application:
• Will your users be able to access information in a timely fashion?
• Are your hardware and software capable of supporting your projected load?
• Will your system scale up to meet projected future demand?
The techniques of Software Performance Engineering (SPE) allow you to answer these questions and manage the performance of your evolving Web applications [SMIT90a; SMIT01]. With SPE you can:
• Improve responsiveness with quantitative techniques that predict and manage software performance and scalability.
• Select the right software and technical architecture by predicting the performance of middleware and server software options.
Software architectural decisions are the most important ones you will make when designing your Web application. It is vital to assess the impact of these decisions on responsiveness and scalability early in the development process, when it is easy to make changes. If you wait until the application has been completed and rely on performance testing only,
performance problems are more likely to appear and correcting them will be difficult and expensive, at best. Worse, achieving your performance objectives may be impossible.
This paper describes how to apply the SPE modeling techniques to Web applications and illustrates their use with a case study. We assume that the reader is familiar with the basics of SPE and the modeling approach. This background information is covered in [SMIT90a; SMIT97]. The paper describes how to model the software architecture to evaluate alternatives. It does not address other important issues such as how to project the customer demand for Web Applications. Other authors provide good guidance for those issues [GUNT00; MENA98; MENA00].
2.0 Performance Characteristics of
Web Applications
A Web application is similar to a traditional client/server application that runs on a Web site. A Web site allows users to access and view documents using a browser running on the client computer. The simplest possible Web site consists of a Web server
running on a server machine along with some documents in HyperText Markup Language (HTML) format. The browser sends a document request to the Web server. The Web server then locates the document in the server’s file system and sends it to
the browser.
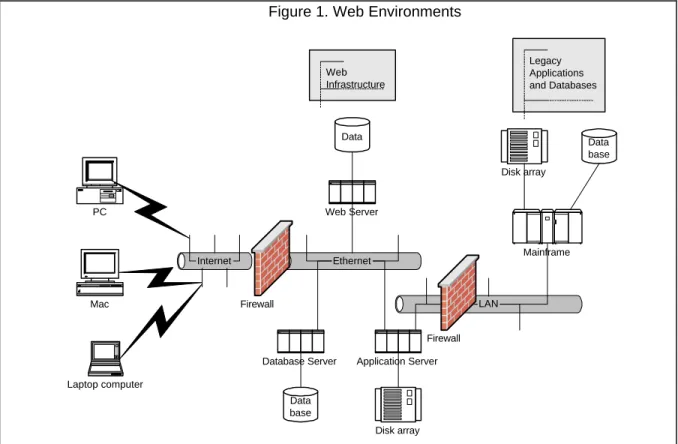
Most web environments are far more complex than that, employing dynamic content rather than static HTML, extensive application (business) logic, and a variety of security techniques, as illustrated in Figure 1. A request submitted from a client’s browser is transmitted via the Internet, through a firewall to the web server for security processing, or via an intranet. From there, it goes to the Web server then to the appropriate Web application. The Web application may interact with another firewall, database servers, a mainframe, external Web sites, etc. A Web application may also use middleware packages such as CORBA or MQSeries to connect the various components of the application. The Web application interprets user input, queries and/or updates stored business data, and returns information to the user that is dependent on these interactions. From a performance perspective, the early software architecture issues focus on communication among components. As Clements observes [CLEM96]:
“Performance is largely a function of the frequency and nature of inter-component communication, in addition to the performance characteristics of the components themselves, and hence can be predicted by studying the architecture of a system.”
For the software architecture we will focus on decisions about the amount of data sent over the Figure 1. Web Environments
LAN Internet Ethernet PC Mac Laptop computer Mainframe Disk array Disk array Firewall Data base Web Server
Database Server Application Server Data Firewall Data base Legacy Applications and Databases Web Infrastructure
external and internal networks and among processes; the number of interactions required to retrieve the data and to accomplish the end-to-end business tasks; and how to integrate legacy applications – whether to modify the legacy application to provide a new, customized Application Program Interface (API) or use an Adapter that calls existing APIs and reformats data as needed [GAMM95].
The technical architecture choices focus on the hardware and support software platforms. We must decide the number and size of processors that we need, and determine which processors the various processing steps should execute on (for example, do we need separate web server(s) and application server(s), and database server(s) or can some functions be consolidated). We must also select among middleware packages, and determine how to best configure the environment for redundancy and recovery. There are many other such choices that need to be evaluated.
Web applications have a myriad of implementation options that affect the software architecture, such as:
• Whether the application will execute on the server and which technology is most appropriate [e.g., Common Gateway Interface (CGI) processes, Active Server Pages (ASP), Java (or other language) servlets, or server API applications]
• Whether some of the application will execute on the client and which technology is most appropriate (e.g., scripts, applets, etc.)
• Whether component libraries should be used (e.g., Enterprise Java Beans (EJB), ActiveX Controls, etc.)
• How to access databases (e.g., Remote SQL, stored procedures, middleware products, etc.)
These choices affect performance as well as other quality of service attributes, such as availability or security. In some cases, there are trade-offs to be made between quality attributes. For example, putting the application on a different machine than the Web server may improve availability (failures in the application will not interfere with the operation of the Web server) but degrade performance (by increasing overhead for communication across machines). If these trade-offs are identified early, an architecture that addresses these trade-offs can be selected. If not, it may not be possible to meet some (or all) quality objectives. This paper focuses on using SPE techniques to construct and evaluate performance models of various architectural alternatives early in development. The goal is to select a combination that will meet performance objectives.
3.0 SPE Models for Web
Applications
The SPE techniques for Web applications are similar to those that we have used for distributed systems [SMIT99b; SMIT98d; SMIT98c]. Web applications use different implementation technologies than other distributed systems, but implementation details do not affect the SPE models during the early life cycle stages. The following paragraphs give a high-level overview of the modeling and evaluation steps; Section 4 illustrates them with a case study.
The first step in the SPE process is to select a set of performance scenarios that represent the important web-application interactions. These are usually the most frequent interactions; they also include the important functions that must perform well if the application is to meet its business objectives. Next, we create an end-to-end performance scenario that represents (at a high level) the processing steps in each of the performance scenarios. We use extended UML sequence diagrams to represent the system interactions. (An example appears in Figure 4, and the notation is explained in [SMIT98c]).
After representing the overall flow, we identify processing steps that have the greatest impact on performance and add details for them. For example, a database query, particularly on a remote computer, usually has a far greater impact on response time and scalability than firewall processing. We also include specific details for processing steps that correspond to the software architecture alternatives we are evaluating. That is, if we want to compare the performance of two alternatives, such as client vs. server processing for form validation, we must represent the processing steps required for form validation in the model. Next we convert the sequence diagrams into a software execution model, add performance specifications, and solve the software execution model to determine the end-to-end response time (without contention delays). The software execution model often identifies problems with Web applications, particularly when they need to transfer large amounts of data over relatively slow communication lines. After selecting a software architecture alternative that meets performance objectives, we use the system execution model to evaluate technical architecture alternatives and software scalability and capacity requirements.
The web execution environment is typically complex. At the architectural level of design, we will use deliberately simple models of software processing that are easily constructed and solved to provide feedback on whether the proposed software is likely to meet performance goals. Thus our approach is to first
create the software execution models that show the interactions among processes and estimate
the delay to receive results from remote processes. Later in development, more realistic models use advanced system execution model solutions to solve for the delays to interact with distributed processes. The advanced models were described in an earlier paper [SMIT98d]; they are not covered here.
The motivation for using these simpler, approximate models early in development is illustrated in Figure 2. The diagram shows N
Clients connected to a Web Server via a Network (either an intranet or the Internet). Each client is modeled with a system model such as the one at the top of the diagram. User requests are processed on the Client’s CPU and Disk. At some point in the processing, the Client makes a request of a Server. It is transmitted via the Network (simplified to a single queue in the center section of this figure), and then it is sent to the Server. The server model near the bottom of the diagram is also a simple system model with a CPU and Disk.The request is processed on the Server’s CPU and Disk(s), sent via a LAN (simplified to a single queue), processed on the Mainframe CPU and Disk(s), returned to the Server, processed on the CPU and disk(s), then returned to the Network. When it exits the network it returns to the Client making the request.
This picture is a greatly over-simplified view of a particular interaction. The resulting simulation model is still complex, however; it contains a large number of queue-servers and workloads when all clients are included (there may be thousands of client CPUs and Disks). Because of this, the solution time is very long and it is difficult to compare many alternatives. Early in development, we are not interested in the intricacies of this interaction, but rather with the feasibility and desirability of various architecture and design alternatives. Thus, to keep the models at this stage simple so we can study as many alternatives as possible, we will construct separate system models for the clients, servers and mainframe -- and estimate the delays on each for external system interactions. This approximation technique is illustrated in the next section.
4.0 Case Study: Nachtfliegen.com
Nachtfliegen airlines plans a major expansion to their modest web site to:• Expand company information, add navigation and tabs
• Add promotions and deals to attract customers and encourage purchases
• Add functions for flight inquiry, plan an itinerary, and ticket purchase
• Support the frequent flyer club, Vielenreisen, by allowing members to customize their interactions and purchase tickets with frequent flyer miles as well as a credit card.
There are two types of users: Customers and Frequent Flyers. The most important performance scenarios are: PlanItinerary and PurchaseTickets. The performance of these scenarios is important if the web site is to meet the marketing goals to generate new revenue. If the performance is poor, users will not use the web site, and Nachtfliegen will not realize the increased revenues. Other scenarios are also important, but they will not be addressed in the initial analysis.
A Customer will first request the Nactfliegen.com home page. From there they may check flight status, view travel promotions, register for a Vielenreisen account, etc. (by clicking on a link in the navigation area, or selecting the appropriate tab). A Frequent Flyer will first login, receive a customized version of the home page, then select their next action – in this case planItinerary.
Figure 2. “Simple” Distributed System Model.
Client CPU Client Disk
Server CPU Server Disk(s)
Mainframe CPU Mainframe Disk(s) LAN
INet
n n n
4.1 Plan Itinerary Scenario
We will first consider the scenario that is expected to be the most important (if the new web site is to be successful): a Frequent Flyer logs-in, plans an itinerary, and purchases the ticket. We have a performance objective for the login step of 8 seconds. We do not yet have a performance objective for the end-to-end response time to plan an itinerary and purchase the ticket. (We will see later how this lack of an objective impedes
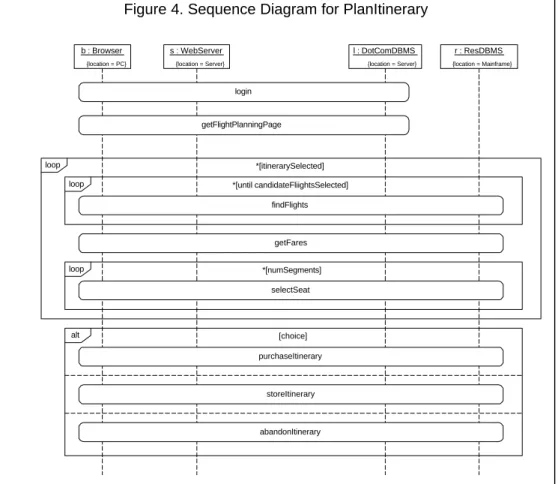
the performance improvement process). The sequence of actions for the planItinerary scenario, shown in Figure 4, is:
• The Frequent Flyer logs-in and the customized home page is displayed. The sequence diagram shows this step as a reference (a rounded rectangle symbol), details are in the login sequence diagram (described later).
• The user requests the flight-planning page (another reference).
• Next is an outer loop that will be repeated until a user finds an acceptable set of flights, fares, and (when appropriate) seats. Within the outer loop is another loop while the Frequent Flyer first
explores flights available. (Note the loop symbol and the reference to findFlights).
• After selecting a set of flights, the Frequent Flyer requests the fare (getFares reference).
• Next is a loop that may execute 0 times if the flight-fare combination is unacceptable, otherwise it executes up to once per segment for the Frequent Flyer to select a seat. At this point, the Frequent Flyer may return to the findFlights page if the flight-fare-seat combination is undesirable, or proceed to the next step if all is well.
• Finally the Frequent Flyer purchases the itinerary, stores it for future reference, or abandons it.
This scenario does not represent the firewall. If it were included, each message between the browser and the web server, and between the web server and the mainframe would pass through a firewall. We chose to omit it from these models because performance problems with firewall processors are typically corrected with larger processors – the firewall does not directly affect the application design. If it is a design issue, it can be included in the models. Otherwise we include the additional processing time required for firewall processing, but do not model it explicitly.
Figure 4. Sequence Diagram for PlanItinerary
{location = PC} b : Browser {location = Server} s : WebServer {location = Server} l : DotComDBMS {location = Mainframe} r : ResDBMS login loop *[itinerarySelected] getFares loop *[until candidateFliightsSelected]
findFlights alt [choice] purchaseItinerary storeItinerary loop *[numSegments] selectSeat abandonItinerary getFlightPlanningPage
4.2 Login
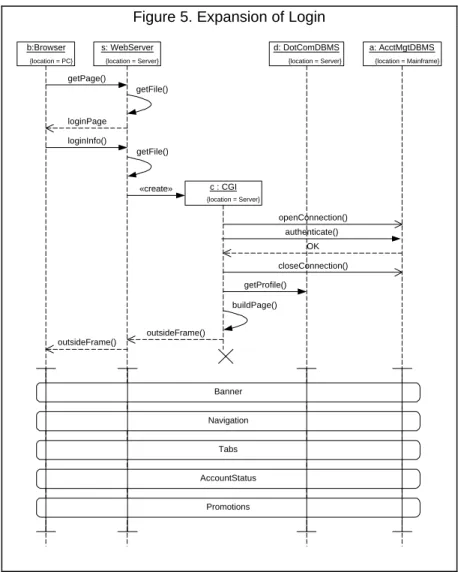
Frequent Flyers first login. Their account profile is used to create a customized version of the home page with promotions geared to their special interests. Figure 5 shows the sequence diagram for an error-free login. This diagram corresponds to the login reference in Figure 4. The sequence of actions is:
• The browser sends a request for the login page to the web server.
• The web server gets the file and returns the login page.
• The user completes the form and sends the request to the web server.
• The web server gets the file and creates a CGI process to handle the login.
• The CGI process first authenticates the user by: opening a connection to the mainframe; sending
a request to the AcctMgmtDBMS; and closing the connection. We assume the authentication is OK. • The CGI process gets the user’s profile
information from the DotComDBMS.
• The CGI process then uses the profile information to build the page, and returns the outside frame of the page via the firewall to the browser.
• The browser then makes separate requests for the portions of the frame (the banner, navigation, tabs, account status, and promotions). Each tab and each promotion is stored in a gif file thus the browser must make a separate request for each one. We use a co-region in the sequence diagram to show that the requests may arrive in any order and may be requested concurrently.
The processing details for the other sequence diagram references are very similar to these. Their details are not shown here.
Figure 5. Expansion of Login
{location = PC} b:Browser {location = Server} s: WebServer {location = Mainframe} a: AcctMgtDBMS {location = Server} d: DotComDBMS getPage() loginPage loginInfo() getFile() «create» {location = Server} c : CGI authenticate() OK openConnection() closeConnection() getProfile() buildPage() outsideFrame() outsideFrame() Banner Navigation Tabs AccountStatus Promotions getFile()
4.3 Software model
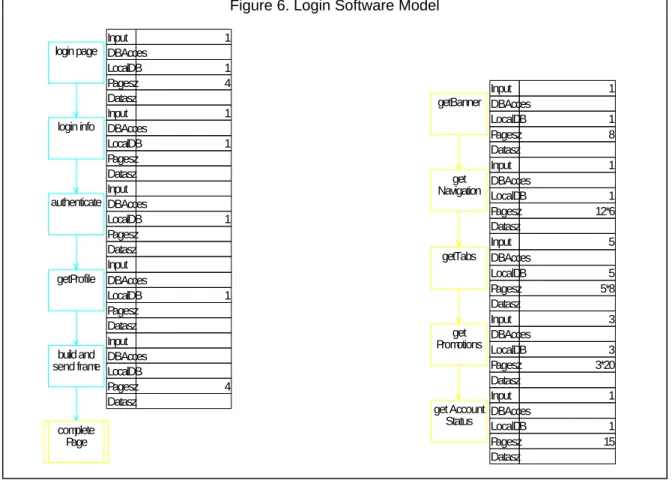
Figure 6 shows the software execution model corresponding to Figure 5. We use the SPE•ED1
performance engineering tool to create and solve the SPE models. You can adapt these techniques to other tools. The login reference in the sequence diagram becomes an expanded node in the software execution model. Similarly getFlightPlanningPage, findFlights and other references also become expanded nodes. The strategy for the choice node and
its attached nodes is covered later.
4.4 Hardware/Software Environment
The overhead matrix we use for the web server is in Figure 7. The software resources we will use are:
• Input - the number of Kbytes in the input message
1
SPE•ED is a trademark of Performance Engineering Services, L&S Computer Technology, Inc. www.perfeng.com.
• DBAccess - the number of accesses to a mainframe database
• LocalDB - the number of accesses to the DotComDBMS
• Pagesz - the number of Kbytes in the page displayed to the user (including script or code that is downloaded with the page data)
• Datasz - the number of Kbytes of data retrieved from the mainframe to be displayed with the page Figure 6. Login Software Model
login page login info authenticate getProfile build and send frame complete Page Input 1 DBAcces LocalDB 1 Pagesz 4 Datasz Input 1 DBAcces LocalDB 1 Pagesz Datasz Input DBAcces LocalDB 1 Pagesz Datasz Input DBAcces LocalDB 1 Pagesz Datasz Input DBAcces LocalDB Pagesz 4 Datasz getBanner get Navigation getTabs get Promotions get Account Status Input 1 DBAcces LocalDB 1 Pagesz 8 Datasz Input 1 DBAcces LocalDB 1 Pagesz 12*6 Datasz Input 5 DBAcces LocalDB 5 Pagesz 5*8 Datasz Input 3 DBAcces LocalDB 3 Pagesz 3*20 Datasz Input 1 DBAcces LocalDB 1 Pagesz 15 Datasz
Figure 7. Processing Overhead Matrix
Devices Quantity Service units Input DB Acces LocalDB Page sz Data sz Service time CPU 6 Sec. 0.002 0.0005 0.01 0.0005 0.0005 1 Disk 3 I/Os 2 0.003 INet 1 Kbtyes 1 1 1 0.14222 Delay 1 Sec. 0.25 1 LAN 1 Msgs 1 1 0.000164
The web server devices in the matrix include the 6 CPUs, 3 Disks, the Internet, INet, (represented as the delay time to transmit each Kbytes of the page and data across a 56KB communication link), the Delay to access the mainframe, and the LAN.
In the center of the matrix we see that: • Each (Kbytes of) Input requires approximately 2
ms. of CPU processing and 1 INet delay
• Each DBAccess requires .5 ms. of CPU processing, .025 secs. Delay, and 1 LAN message
• Each LocalDB requires 10 ms. of CPU processing and 2 I/Os to the Disk device
• Each (Kbytes of) Pagesz requires .5 ms. of CPU processing and 1 INet delay
• Each (Kbytes of) Datasz requires .5 ms. of CPU processing, 1 INet delay, and 1 LAN message.
The next step is to use this software resource template to specify the resource requirements for each step in the software execution model.
4.5 Resource Requirements
The resource requirements for the steps in login are shown in Figure 6. For example, the login page takes 1KB of Input, 1 LocalDB access and returns a Pagesz of 4KB; and getNavigation takes 1KB of Input, 1 LocalDB and returns 12 navigation (URL) choices each represented by 6KB of data (a small graphic in gif format). None of these steps does a remote DBAcess thus all Datasz specifications are also 0.
Earlier we noticed that the steps required to retrieve a page, process it and send it to the browser are repetitious. We elected not to expand each of the nodes, but instead to estimate the total resource requirements for the page and specify the total for each page. So, for example, we did not expand purchaseItinerary, storeItinerary, or abandonItinerary. That is, rather than expanding the steps for storeItinerary as we did for login, we calculate the total input, DB Accesses, LocalDB, Pagesz, and DataSz for storeItinerary.
4.6 Software Model Results
The software model results (with no contention) are in Figure 8. The key results are: • The time to process the login and display the customized home page is 31 seconds. Note this is the time to deliver the pages
and data to the browser; it excludes the time for the browser to render the page.
• The end-to-end time for planItinerary is 311 seconds.
• Of the total time for planItinerary: 1.4 secs is CPU time, .14 secs is Disk time, 302 secs is INet to transmit the pages and data, 7.5 secs is Delay to access the Mainframe, and .1 secs is LAN.
We know that 31 seconds for login exceeds the 8-second performance objective. We didn’t have a performance objective for the end-to-end response time so we are not sure if 311 seconds is acceptable. This will be a discussion point when the results are presented.
By viewing the resource demand results for each step (not shown) we find that the primary problem with the login is that it takes 31 seconds to transmit the pages and data (total for INet), and getNavigation takes the most time followed by getPromotions.
4.7 Performance Improvements
This paper focuses on how to create and evaluate SPE models early in the life cycle rather than on performance improvements or performance tuning. Some excellent papers have been presented that describe how to improve the performance of Web applications [CRAI99; HANS99; LYNC99]. While we do not specifically consider strategies for improving performance, we will consider how to model and
Figure 8. planItinerary Software Model Results < 2.000 < 4.000 < 6.000 < 8.000 >= 8.000 Resource Usage 1.3599 CPU 0.1308 Disk 301.5349 INet 7.4500 Delay 0.0843 LAN Time, no contention: 310.5598 31.0870 8.7714 268.5843 0.0000 1.8054 0.3052 0.0064 login getFlight Planning Page untilFound findFlights choice purchase Itinerary store Itinerary abandon Itinerary
evaluate some alternatives. Some possible improvements to this application include:
• Minimize the processing for this scenario by reducing the size and number of messages sent to the browser. The following improvements help us do that.
• These pages are designed using frames, thus each of the pages requires the browser to make multiple requests to the WebServer to retrieve each portion of the frame. A different strategy (using tables) would reduce the number of requests to the WebServer.
• Most of the time the user wants to plan an itinerary rather than view repetitive information on a home page (especially if it takes forever to display) then have to select getFlightPlanningPage (and wait again). Thus we can improve locality by letting the user choose on the login page which page they want to see first. We can accommodate marketing’s agenda by placing the promotions on each page rather than on the home page.
• The primary way to reduce the problem with the login is the size of the pages and data. For example, we could use simple text-base URLs in the Navigation section, and change the promotions to use simpler gifs with catchy phrases, etc.
We can evaluate the performance improvement of
these and other alternatives by revising the software execution model to represent each alternative and solving the model. Some will have a larger benefit than others, and the relative benefit of each depends on the order you apply them. A refactored solution that includes a combination of improvements reduces the time for the login and display of the flightPlanningPage to 3.6 seconds.
4.8 System Execution Model
The system execution model results for the refactored design for 720 users per hour are in Figure 9. The end-to-end time is still approximately 274 seconds, and thus the elapsed time for the individual steps is similar to the values for the no-contention solution. The reason for this is that the utilization of the shared devices, the CPU, Disks, and LAN, is below 4%. Thus, at this point in the project the primary problem is the amount of data sent across the Internet.
Following the SPE process, the next step is to add performance scenarios based on additional use cases, and look for problems due to contention among multiple scenarios. We also add processing details, such as a limit on the number of CGI processes that can be active, constraints on the connections to the mainframe, synchronization among processes, the number of threads for each process, etc.
Figure 9. System Model Results
< 2.000 < 4.000 < 6.000 < 8.000 >= 8.000 Resource Usage 1.1493 CPU 0.0651 Disk 265.5532 INet 7.4500 Delay 0.0857 LAN Reside nce Time: 274.3033
3.5617 268.6230 0.0000 1.8062 0.3058 0.0066 login until Found findFlights alt purchase Itinerary store Itinerary abandon Itinerary
This model approximates the performance of the system by focusing on the scenario that executes on the WebServer and estimating delays for inter-actions with other systems such as the Mainframe. This allows us to quickly build and solve both the software and system models for the WebServer. Later, we could create a separate performance scenario for each process on each of the other processors in the system (mainframe, database servers, etc.); specify resource requirements for their processing; and estimate the delay to interact with each of the other scenarios in the model. The model solutions are iterative - the solution of each independent performance scenario quantifies its processing time, which serves as the delay for system interactions in the subsequent model. Still later, we can connect each of the scenarios with an advanced system model to evaluate synchronization and communication among systems and compute the delay directly. These techniques were covered in [SMIT98d; SMIT98c].
4.9 Sensitivity and Scalability Analysis
To study sensitivity, we use various values for resource requirements and processing overhead to evaluate whether or not results change significantly. Given the low device utilization in this model the pri-mary sensitivity is the amount of data sent via the INet, and the delay for accessing the mainframe. You could also determine a bound for the maximum size for a page and its included graphics that will enable you to meet the 8-second performance objective.
Scalability is not an issue for this initial version of the model. Scalability will be more important once the additional system execution model details (from the previous section) are added to the model. To evaluate scalability, gradually increase the arrival rate of performance scenarios and look for the knee of the scalability curve.
5.0 Summary and Conclusions
This paper has described the application of SPE techniques to early life cycle modeling of performance for Web applications. Early life cycle performance modeling is important to support architectural decisions for Web applications because these decisions have the greatest impact on responsiveness and scalability.
To obtain timely feedback from the SPE models, it is important to be able to construct and solve them quickly and easily. To do this, we employ an approximation technique that provides the most important information while keeping the models themselves simple. We first focus on the Web application processor and create a separate software
model for each key user task (performance scenario). We use the overhead matrix to specify the overhead for messages sent over the Internet and over LANs and WANS, and the overhead for database accesses. Processing overhead for interactions with other processors is estimated and included as delays in the overhead matrix. Then we specify the number of messages, database accesses and external system interactions for each processing step in the scenarios. This solution provides an estimate of the end-to-end response time to deliver the pages and data to the browser. The system execution model estimates the scalability of the Web application processor by studying how it performs under different loading conditions.
The case study illustrated the use of the approximation technique, the types of information that the model solutions provide, and how to evaluate the types of performance improvements that can be made to Web applications at the architectural phase of development. Once the appropriate Web application architecture is selected, additional models add more processing details and other processors to refine the performance predictions.
The technique produces approximate results useful for making architecture tradeoff decisions. It is appropriate to add modeling details for more precise performance predictions as the software development proceeds. We have successfully used the approximate techniques on numerous case studies, identified and corrected performance problems before systems were deployed. It is important to include these techniques during the development of new systems. This will become easier if developers learn how to apply these simple techniques themselves. We are addressing this problem with a new book primarily targeted to software developers [SMIT01]. You can improve the situation by making software developers aware of the techniques and working with them to create and solve the software architecture performance models.
6.0 References
[CLEM96] P.C. Clements and L.M. Northrup, "Software Architecture: An Executive Overview," No.CMU/SIE-96-TR-003, Software Engineering Institute, Carnegie Mellon University,February 1996.
[CRAI99] Pat Crain and Craig Hanson, "Web Application Tuning," CMG, Reno, 1999. [GAMM95] E. Gamma, et al., Design Patterns:
Elements of Reusable Object-Oriented Software, Reading, MA, Addison-Wesley, 1995.
[GUNT00] Neil Gunther, "E-Ticket Capacity Planning: Riding the E-Commerce Growth Curve," Proc. Computer Measurement Group, Orlando, 2000.
[HANS99] Craig Hanson, Pat Crain, and Steve Wigginton, "User and Computer Performance Optimization," CMG, Reno, 1999.
[LYNC99] Jaqueline A. Lynch, "Designing High Performance Web Pages," Proc. Computer Measurement Group, Reno, 1999.
[MENA98] Daniel A. Menascé and Virgilio A.F. Almeida, Capacity Planning for Web Performance: metrics, models and methods, Prentice Hall, 1998.
[MENA00] Daniel A. Menascé and Virgilio A.F. Almeida, Scaling for E-Business: Technologies, Models, Performance, and Capacity Planning, Prentice Hall, 2000. [SMIT90a] Connie U. Smith, Performance Engineering
of Software Systems, Reading, MA, Addison-Wesley, 1990.
[SMIT99b] Connie U. Smith, "SPE Models for Multi-tier Client/Server Interactions with MQSeries,"
Proc. Computer Measurement Group, Reno, 1999.
[SMIT97] Connie U. Smith and Lloyd G. Williams, "Performance Engineering of Object-Oriented Systems," Proc. Computer Measurement Group, Orlando FL, 1997.
[SMIT98d] Connie U. Smith and Lloyd G. Williams, "Performance Engineering Models of CORBA-based Distributed Object Systems," Proc. Computer Measurement Group, Anaheim, 1998.
[SMIT98c] Connie U. Smith and Lloyd G. Williams, "Performance Models of Distributed System Architectures," Proc. Computer Measurement Group, Anaheim, 1998.
[SMIT01] Connie U. Smith and Lloyd G. Williams,
Performance Strategies: A Practical Guide to Creating Responsive, Scalable Software, Addison-Wesley, to appear 2001.