EPTD DISCUSSION PAPER NO. 99
Environment and Production Technology Division International Food Policy Research Institute
2033 K Street, N.W. Washington, D.C. 20006 U.S.A.
February 2003
EPTD Discussion Papers contain preliminary material and research results, and are circulated prior to a full peer review in order to stimulate discussion and critical comment. It is expected that most Discussion Papers will eventually be published in some other form, and that their content may also be revised.
PUBLIC SPENDING IN DEVELOPING COUNTRIES:
TRENDS, DETERMINATION, AND IMPACT
i
ABSTRACT
The objective of this paper is to review trends in government expenditures in the developing world, to analyze the causes of change, and to develop an analytical framework for determining the differential impacts of various government expenditures on economic growth.
Contrary to common belief, it is found that structural adjustment programs increased the size of government spending, but not all sectors received equal treatment. As a share of total government spending, expenditures on agriculture, education, and infrastructure in Africa; on agricultural and health in Asia; and on education and infrastructure in Latin America, all declined as a result of the structural adjustment programs.
The impact of various types of government spending on economic growth is mixed. In Africa, government spending on agriculture and health was particularly strong in promoting economic growth. Asia’s investments in agriculture, education, and defense had positive growth-promoting effects. However, all types of government spending except health were statistically insignificant in Latin America. Structural adjustment programs promoted growth in Asia and Latin America, but not in Africa.
Growth in agricultural production is most crucial for poverty alleviation in rural areas. Agricultural spending, irrigation, education, and roads all contributed strongly to this growth. Disaggregating total agricultural expenditures into research and non-research spending reveals that research had a much larger impact on productivity than non-research spending.
ii
Table of Contents
1. Introduction... 1
2. Government Spending: Trends, Size, and Composition ... 3
3. Determination of Government Expenditures ... 13
4. Impact of Government Spending on Growth... 20
5. Major Findings and Recommendations ... 28
References... 30
PUBLIC SPENDING IN DEVELOPING COUNTRIES:
TRENDS, DETERMINATION, AND IMPACT
1Shenggen Fan and Neetha Rao2
1. INTRODUCTION
Many developing countries are currently undergoing substantial macroeconomic adjustments. It is not clear how such programs are affecting government expenditure and hence longer-term economic growth and poverty reduction. Thus, it is important to monitor trends in the levels and composition of government expenditures, and to assess the causes of change over time. It is even more important to analyze the relative contribution of various expenditures to production growth and poverty reduction, as this will provide important information for more efficient targeting of these limited and often declining financial resources in the future.
There have been numerous studies on the role of government spending in the long-term growth of national economies (Aschauer 1989; Barro 1990; Tazi and Zee 1997). These studies found conflicting results about the effects of government spending on economic growth. Barro was among the first to formally endogenize government spending in a growth model and to analyze the relationship between size of government and rates of growth and saving. He concluded that an increase in resources devoted to non-productive (but possibly
utility-enhancing) government services is associated with lower per capita growth. Tazi and Zee also found no relationship between government size and economic growth. On the other hand, Aschauer’s empirical results indicate that non-military public capital stock is substantially more
1 Partial funding from USAID and the World Bank is acknowledged.
2 Shenggen Fan is a Senior Research Fellow and Neetha Rao is a Senior Research Assistant in the Environment and
important in determining productivity than is the flow of non-military or military spending, that military capital bears little relation to productivity, and that the basic stock of infrastructure of streets, highways, airports, mass transit, sewers, and water systems has most explanatory power for productivity. Many studies also attempted to link government spending to agricultural growth and poverty reduction (Elias 1985; Fan, Hazell, and Thorat 2000; Fan, Zhang, and Zhang 2000; and Fan and Pardey 1998). Most of these studies found that government spending
contributed to agricultural production growth and poverty reduction.
The purpose of this study is to review and analyze the trends and causes of change in government expenditures and their compositions in the developing world, and to develop an analytical framework for determining differential impacts of various government expenditures on economic growth. We first review trends in and the composition of government expenditures across developing regions of Africa, Asia, and Latin America. We then model determinants of composition of government expenditures. Next, we model effects of government expenditures on gross domestic product (GDP) growth by estimating a GDP function and estimate the impact of various public capitals on agricultural GDP growth. We conclude with the study’s major findings and recommendations.
2. GOVERNMENT SPENDING: TRENDS, SIZE, AND COMPOSITION
For the purpose of cross-country comparisons, we converted all government expenditures into 1995 constant international dollars. We collected data from 1980 to 1998 for 43 developing countries across Asia, Africa, and Latin America.3
TOTAL GOVERNMENT SPENDING AND COMPOSITION
Over the past two decades, government expenditures in 43 developing countries considered in this study experienced an erratic pattern. During the 1980s, expenditures increased from $776 billion in 1980 to $1,148 billion in 1990, with an annual growth rate of 4 percent (Table 1). In the 1990s, governments increased their spending power. By 1998, total expenditures reached $1,790 billion, with an annual increase of 5.7 percent. There appears to be no obvious adverse impact of macroeconomic adjustments on government spending for these developing countries as a whole.
Table 1—Government expenditures
1995 international dollars, billions Percentage of GDP
1980 1990 1998 1980 1990 1998 AFRICA 108.30 138.38 190.01 28.46 26.25 27.64 Botswana 0.78 2.32 3.49 29.82 33.80 35.94 Burkina Faso 0.61 1.03 2.19 12.20 14.98 22.89 Cameroon 2.33 4.34 3.50 15.74 21.17 16.18 Cote d’Ivoire 5.42 4.50 5.71 31.68 24.48 23.99 Egypt 41.78 39.36 58.9 50.28 27.81 30.12 Ethiopia 4.50 7.50 9.10 18.75 27.17 25.20 Ghana 2.05 3.09 6.36 10.89 13.25 19.40 Kenya 4.25 6.89 8.23 25.26 27.46 28.03 Malawi 1.16 1.11 1.29 34.59 26.55 22.90 Mali 1.01 1.38 1.69 19.44 25.00 22.72 Morocco 17.43 22.16 29.45 33.09 28.82 31.31 Nigeria 9.43 20.05 20.16 12.80 24.49 19.79 Togo 1.55 0.93 1.33 30.80 16.70 21.05 Tunisia 8.02 12.48 16.29 31.56 34.60 31.51 Uganda 0.90 2.11 3.70 9.47 15.60 16.15 Zambia 2.22 1.81 1.96 37.05 27.26 27.51 Zimbabwe 4.85 7.30 16.67 27.92 27.32 52.23 ASIA 454.70 789.30 1273.3 19.06 16.82 15.23 Bangladesh 5.63 13.37 24.02 7.41 11.06 13.77 China 196.65 289.63 538.01 27.20 16.63 13.60 India 93.45 215.02 299.43 12.25 15.96 14.37 Indonesia 45.55 70.12 97.55 22.13 18.36 17.88 Korea, Rep. of 30.80 68.80 129.81 17.28 16.22 20.24 Malaysia 17.73 33.41 39.53 28.49 30.12 21.76 Myanmar 5.97 6.86 5.34 15.85 16.03 7.71 Nepal 1.68 3.20 4.75 14.30 17.22 17.52 Philippines 25.10 43.54 55.81 13.36 19.60 20.38 Sri Lanka 10.50 10.84 14.36 41.36 28.37 25.02 Thailand 21.63 34.49 64.68 18.80 14.08 18.55 LAC 212.57 219.97 326.55 16.84 15.47 16.60 Argentina 57.78 28.77 68.29 18.23 10.57 15.41 Belize 0.12 0.24 0.32 22.87 28.40 28.50 Bolivia 2.11 2.17 4.05 16.09 16.38 21.90 Chile 13.68 14.41 27.63 28.01 20.38 21.57 Colombia 15.64 18.90 40.05 11.48 9.94 16.00 Costa Rica 3.12 4.05 6.30 25.04 25.61 29.06 Dominican Rep. 3.35 2.97 6.34 16.92 11.66 16.29 Ecuador 3.54 4.44 8.69 14.22 14.50 22.62 El Salvador 3.02 1.85 2.30 17.14 10.90 9.18 Guatemala 3.65 2.79 4.75 14.32 10.04 12.24 Mexico 78.67 106.82 112.81 15.75 17.88 14.88 Panama 2.73 2.43 4.27 30.53 23.70 28.51
Table 1—Government expenditures (continued)
1995 international dollars, billions Percentage of GDP
1980 1990 1998 1980 1990 1998
Paraguay 1.42 1.78 3.89 9.85 9.40 16.96
Uruguay 4.63 5.45 9.69 21.84 25.95 33.31
Venezuela 19.10 22.92 27.17 18.74 20.73 19.76
TOTAL 775.56 1,147.65 1,789.86 19.25 17.28 16.25
Source: Calculated using data from International Monetary Fund’s (IMF) Government Financial Statistics Yearbook (various issues).
Regional deviations from these averages among developing countries were quite marked. Across all regions, Asia experienced the most rapid growth, while Africa and Latin America increased at a much slower pace. In fact, most of the increase in total government expenditures came from Asia, accounting for 71 percent of total expenditures in 1998, up from 59 percent in 1980. This is due to the fact that most Asian countries experienced rapid growth in per capita GDP. With the exception of Sri Lanka and Myanmar, all countries in the region at least doubled their total expenditures for the period 1980–98. Republic of Korea and Bangladesh had the most rapid growth over 1980–98, followed by India and Thailand. Myanmar is the only Asian country to reduce its total government expenditures (by 11 percent) for the same period.
For African countries, expenditures grew at 3.26 percent over 1980–98. Growth was much slower in the 1980s, at 2.74 percent per annum. In fact, there was a brief contraction after 1982, and it was not until 1986 that total government expenditures recovered to 1982 levels, when many African countries implemented macroeconomic structural adjustments. However, during the 1990s African countries gained momentum in expanding government expenditures, growing at 4.3 percent per annum. Botswana had the most rapid growth, mainly due to the
outstanding performance of its national economy: more than 10 percent growth per annum during 1980–98.
Latin American countries had the slowest growth in spending between 1980 and 1998. There was virtually no growth in the 1980s, and rapid growth in the 1990s was primarily due to recovery from the decline in the 1980s. There were two contractions over the whole period. The first occurred between 1982 and 1984, with 18 percent reduction in spending. The second contraction was between 1987 and the early 1990s. Most of growth in the region in the 1990s was due to recovery from these two contractions.
Total government expenditure as a percentage of GDP measures the amount a country spends relative to the size of its economy. For countries in this study, the percentage declined from 19 percent in 1980 to 16 percent in 1998. On average, developing countries spend much less than developed countries. For example, total government outlays as a percentage of GDP in Organisation for Economic Cooperation and Development (OECD) countries range from 27 percent in 1960 to 48 percent in 1996 (Gwartney, Holcombe, and Lawson 1998), compared to 13–35 percent in most developing countries.
For Asia, the percentage declined from 19 percent in 1980 to 15 percent in 1998. There is a strong correlation between the level of economic development and government spending power in this region, with the exception of Sri Lanka. In 1998, Myanmar spent the least, only 8 percent of its GDP, while the rest of the Asian countries spent 13–25 percent of their GDP. The two largest economies in the region, China and India, spent the same amount relative to their GDP, about 13–14 percent.
Surprisingly, among the three regions, Africa spends the most as a percentage of GDP. Government spending as a percentage of GDP has been around 26–28 percent over the last two
decades, almost 10 percentage points higher than Asia and Latin America. Among all countries in the region, Botswana, Egypt, Tunisia, Morocco, Kenya, and Zimbabwe are among the largest spenders, often spending more than 30 percent of their GDP. Uganda and Cameroon spend only half as much, about 15–20 percent, the least among African countries in our study.
Latin America experienced an even more erratic spending pattern. The percentage increased at a rate of 2–3 percent per year until 1986, then declined thereafter at a rate of 1–2 percent per year from 1987 to 1991. After 1992, the percentage began another upward trend. For the region, the percentage averaged 16.6 percent in 1998, slightly higher than Asian countries. Costa Rica and Panama spend almost 30 percent, while El Salvador and Guatemala spend only 12 percent of their respective GDPs.
Equally important is the composition of government expenditures, which reflects
government spending priorities. The composition across regions reveals many differences (Table 2).4
4 Comparison is made across six sectors, namely agriculture, education, health, defense, social security, and
transportation and communication. Other sectors, such as mining, manufacturing and construction, fuel and energy, and general administration, are not included in our analysis and are collectively termed “other” expenditures.
Table 2—Composition of total expenditure, 1980 and 1998 (percent)
Africa Asia Latin America
1980 1998 1980 1998 1980 1998 Total 100 100 100 100 100 100 Agriculturea 6.0 5.0 15.0 10.0 8.0 3.0 Education 12.0 16.0 14.0 20.0 16.0 19.0 Health 3.0 5.0 5.0 4.0 4.0 7.0 T & C 6.0 4.0 12.0 5.0 11.0 6.0 Social Security 5.0 3.0 4.0 3.0 19.0 26.0 Defense 12.0 10.0 18.0 11.0 7.0 7.0 Otherb 55.0 57.0 33.0 47.0 35.0 32.0
Notes: T & C stands for transportation and communication.
a Includes agriculture, forestry, fishing, and hunting.
b Includes fuel and energy; mining, manufacturing, and construction; general administration.
Sources: Calculated using data from International Monetary Fund’s Government Finance Statistics (various issues).
The top three expenditures for Africa in 1998 are education, defense, and health. Although education expenditure is the largest (15.9 percent), the percentage is smaller than in Asia and Latin America. Defense accounts for 10 percent of total government expenditures in the region, similar to Asia but more than Latin America in 1998. On average, African countries spend only 5 percent of total government expenditures on health. This is particularly disturbing considering that HIV/AIDS is widespread among its general population. Another discouraging trend is that African countries spend very little on transportation and telecommunication compared to other regions, and their share in total government expenditures declined over time from 5.9 percent in 1980 to 3.9 percent in 1998.
Education spending is the largest among all government expenditures in Asia, accounting for 20 percent. It is not surprising that Asia has the highest quality of human capital among regions. Defense and agriculture spending rank second and third, accounting for 10 percent and 11 percent, respectively, of total government expenditures in 1998, reduced from 17 percent and 15 percent, respectively, in 1980. This indicates that as the economy continues to recover from the 1997 Asian Crisis, governments in the region may be spending less on health and social security, which are much needed to protect disadvantaged groups. Although defense spending declined from 17 percent in 1980 to 11 percent in 1998, the percentage is still high compared to Latin America, which spends 7 percent on defense, and is substantially higher than the region’s spending on infrastructure, social security, and health.
For Latin America, social security spending ranks at the top of all government expenditure items, indicating that higher income inequality among population groups in the region may call for government intervention. In addition, Latin America spent 15–18 percent of total expenditure on education between 1980 and 1998. This region also spends more on
transportation and infrastructure than any other region, accounting for 6.3 percent of total government expenditures in 1998. Agricultural expenditure accounts for a small fraction of total government expenditures (3.3 percent), mainly due to the small share of agriculture in national GDP.
Other expenditures (which include government spending in fuel and energy, mining, manufacturing and construction, and general administration) account for more than 50 percent of total government spending in Africa over 1980–1998. For Asia, the share of this type of
expenditures increased from 33 percent in 1980 to 47 percent in 1998. For Latin America, it also accounts for more than 30 percent of total government spending. Most of these are either
government subsidies or expenses relating to general administration. The large and increasing share of these expenditures may have competed with more productive spending items such as agriculture, education, and infrastructure.
AGRICULTURAL SPENDING
Agriculture is the largest sector in many developing countries. More importantly, the majority of the world’s poor live in rural areas and are primarily engaged in agriculture. Therefore,
agricultural expenditure is one of the most important government instruments for promoting economic growth and alleviating poverty in rural areas of developing countries. Agriculture expenditures increased at an annual growth rate of 3 percent between 1980 and 1998 (Table 3). During the same period of time, rural population grew at approximately 1 percent per year,and agricultural GDP by 4.2 percent. Therefore, these saw a slight increase in agricultural
expenditures per capita of rural population, and a decrease of agricultural expenditures per unit of agricultural GDP.
Table 3—Agriculture expenditure
1995 international dollars, billions Percentage of agricultural GDP
1980 1990 1998 1980 1990 1998 AFRICA 6.79 7.52 9.27 7.51 5.65 6.00 Botswana 0.08 0.15 0.16 26.37 47.79 45.15 Burkina Faso 0.03 0.06 0.05 2.08 2.79 1.52 Cameroon 0.05 0.18 0.10 1.22 3.58 1.16 Cote d’Ivoire 0.18 0.13 0.07 4.17 2.24 1.19 Egypt 1.82 1.86 3.32 12.56 7.13 10.38 Ethiopia 0.30 0.52 1.16 2.25 4.05 6.96 Ghana 0.25 0.13 0.21 2.30 1.21 6.07 Kenya 0.36 0.42 0.33 7.65 6.64 4.94 Malawi 0.12 0.12 0.09 8.97 7.34 4.73 Mali 0.09 0.02 0.01 3.77 0.93 0.19 Morocco 1.13 1.10 0.94 11.59 8.11 6.02 Nigeria 0.26 0.58 0.25 1.80 2.20 0.79 Togo 0.11 0.35 1.08 7.87 18.56 40.91 Tunisia 1.16 1.00 1.25 32.42 17.61 19.38
Uganda n.a. 0.03 0.02 n.a. 0.38 0.23
Zambia 0.51 0.05 0.02 59.89 4.36 1.42 Zimbabwe 0.34 0.82 0.22 13.01 20.60 4.13 ASIA 67.22 97.7 132.60 9.58 8.62 8.18 Bangladesh 0.73 1.60 2.87 2.53 4.67 7.41 China 24.00 28.91 57.53 11.03 6.14 7.91 India 26.01 44.51 43.52 9.95 11.94 7.81 Indonesia 4.91 5.82 6.98 9.94 7.85 6.55 Korea, Rep. of 1.72 6.51 10.57 6.70 18.05 33.59 Malaysia 1.55 2.25 1.33 11.38 10.81 5.56 Myanmar 1.41 0.64 0.77 8.02 2.34 2.70 Nepal 0.27 0.27 0.29 4.05 2.99 2.82 Philippines 1.52 2.95 3.22 3.22 6.07 6.96 Sri Lanka 3.00 0.62 0.69 45.82 6.87 6.33 Thailand 2.09 3.60 4.83 7.82 11.77 12.38 LAC 16.84 6.89 10.71 12.67 4.81 7.22 Argentina 4.54 0.23 0.64 22.54 1.04 2.69 Belize 0.02 0.03 0.02 12.98 19.96 10.58 Bolivia 0.72 0.05 0.08 29.59 2.35 2.86 Chile 0.24 0.29 0.80 6.87 4.97 8.37 Colombia 0.06 1.18 0.52 0.21 3.32 1.53 Costa Rica 0.11 0.17 0.15 4.77 6.60 4.49 Dominican Rep. 0.48 0.43 0.59 11.99 12.55 12.92 Ecuador 0.26 0.18 0.40 8.51 4.36 8.07 El Salvador 0.18 0.10 0.06 2.62 3.45 1.95
Table 3—Agriculture expenditure
1995 international dollars, billions Percentage of agricultural GDP
1980 1990 1998 1980 1990 1998 Guatemala 0.16 0.12 0.12 2.48 1.64 1.38 Mexico 9.13 3.26 6.11 22.01 7.59 16.29 Panama 0.14 0.06 0.09 18.56 6.29 8.18 Paraguay 0.05 0.02 0.21 1.20 0.44 3.67 Uruguay 0.06 0.08 0.12 2.20 3.50 4.83 Venezuela 0.71 0.69 0.82 14.48 11.6 12.01 TOTAL 90.85 112.1 152.59 9.82 7.95 7.93
N. a. means not available.
Source: Calculated using data from International Monetary Fund’s Government Financial Statistics Yearbook (various issues).
In Africa, government expenditure on agriculture increased gradually at an annual rate of 3.5 percent. Agricultural expenditures in Asia more than doubled in the past two decades, with an annual growth rate of 3.8 percent, the highest growth among the three regions. Latin America is the only region that reduced its spending in agriculture, with an annual reduction of 8.4 percent, and eight out of 15 countries included in this study reduced their government expenditures in agriculture.
Agriculture expenditure as a percentage of agriculture GDP measures government spending on agriculture relative to the size of the sector. Compared to developed countries, agricultural spending as a percentage of agricultural GDP is extremely low in developing countries. The former usually have more than 20 percent, while the latter average less than 10 percent. In Africa, agriculture expenditure as a percentage of agricultural GDP remained at relatively similar levels (7–8 percent) throughout the study period. About two-thirds of African countries decreased agriculture expenditure relative to agricultural GDP. Asia’s performance was similar to that of Africa, as its percentage remained constant at 7.5–9 percent. For Latin
America, agricultural spending as a percentage of agricultural GDP hovered around 4–13 percent during 1980–1998.
The share of total government expenditures on agriculture provides important
information on whether the agriculture sector received biased treatment under macroeconomic adjustment programs. For all countries in the study, the share gradually declined from 12 percent in 1980 to 9 percent in 1998. The share has been constant for Africa, indicating no effects of macroeconomic adjustment programs on agricultural spending. In Asia, the share declined from 15 percent to 10 percent for the study period. Latin America experienced the most rapid decline in its share, from 8 percent to a mere a 3 percent, during the same period.
Among all types of agricultural expenditures, agricultural research and development is the most crucial to growth in agricultural and food production. Pardey and Beintema (2001) show that agricultural research and development (R&D) expenditures as a percentage of
agricultural GDP saw a relatively stable increase in the last three decades. For example, in 1995, the share of agricultural R&D expenditure in agricultural GDP in Africa and Asia was between 0.53–0.85 percent, and Latin America’s share was 0.98 percent. These rates are relatively low compared to 2–3 percent in developed countries.
3. DETERMINATION OF GOVERNMENT EXPENDITURES
In this section, we attempt to gain insights about government spending behavior with the aid of a model. Determination of total government spending and its patterns is complex and may include many factors, such as fiscal conditions and political, cultural and economic factors. In recent years, macroeconomic structural adjustment programs heavily influenced spending in many developing countries.
TOTAL GOVERNMENT SPENDING
How much a government can spend depends on its revenues and its ability to borrow from international and domestic sources. For many small developing countries, international aid also has become a significant source of government expenditures. The relative importance of these factors changes over time. In particular, when a government introduces budget cuts under the aegis of macroeconomic reforms and adjustments, spending patterns are likely to be affected. We use the following specification to model changes in government expenditures.
GEPGDPt = f(RGDPt-1, SAt,, Xt) (1)
where GEPGDPtis government expenditure as a percentage of GDP at year t and RGDPt-1 is government revenue5 as a percentage of GDP at year t-1. The one-year lag of the government
revenue variable reflects the fact that in many developing countries, the amount the government can spend depends on revenues generated from the previous year. The variable SAt is a dummy variable that is equal to 1 when macroeconomic adjustments are implemented and equal to 0 otherwise.6 Apart from revenue and structural adjustment variables, Xt captures the effect of other factors on government spending. Since it is difficult to quantify them, we use both year and country dummies to proxy these factors. To avoid the potential endogeniety of the independent variables of government revenue and structural adjustment programs, these two variables are also estimated as dependent variables in a system equation. The one-year lag of GEPGDPt and the two-year lag of RGDPt are used as independent variables in these two equations.
Regression results are presented in Table 4. We have four different specifications.
Regression 1 includes only revenue and structural adjustment program variables. In regression 2, we added GDP per capita (GDPPt), and urbanization (URBANPt) variables. These two variables
5 Government revenue includes current (tax and non-tax revenue), capital revenue, and grants, including foreign aid. 6 For the initiation years of structural programs by country, refer to Appendix 2.
illustrate how economic development levels affect government spending. Regressions 3 and 4 are results from variable coefficient models in which all parameters in the regressions vary by region. This is because determination of government expenditures may differ by region even after controlling for all variables in the equations.
Table 4—Determinants of total government expenditures R1 R2 R3 R4 RGDPt-1 0.185 0.179 (8.530)* (8.050)* Africa 0.331 3.760 (5.830)* (3.880)* Asia 0.150 0.152 (5.500)* (6.790)* Latin America 0.604 0.589 (6.420)* (6.070)* GDPPt-1 -0.032 (-0.490) Africa 0.343 (2.700)* Asia -0.800 (-9.010)* Latin America -0.169 (-0.800) URBANPt-1 -0.406 (-1.840)* (3.500)* Africa -1.403 (-6.470)* Asia 2.970 (6.980)* Latin America -0.104 (-0.130) SAt 0.419 0.452 (4.500)* (4.650)* Africa 0.370 0.669 (3.250)* (3.880)* Asia 0.150 0.281 (0.880) (2.120)* Latin America 0.539 0.552 (4.280)* (4.280)* R2 0.713 0.710 0.720 0.870
Notes: The dependent variable is the percentage of government expenditures in total GDP. Figures in parentheses are t-values. Asterisk (*) indicates significance at the 10 percent level. All regressions included country dummies to capture country-fixed effects.
Results in regression 1 indicate that government expenditure is largely determined by revenue and structural adjustment. However, contrary to common belief, the latter was found to increase government expenditure (the coefficient of the structural adjustment variables is positive and statistically significant). Regression 2 shows that after controlling for GDP per capita and for urbanization, the structural adjustment program variable is still statistically significant and positive. When we break our analysis into regions, we find that for all regions, structural adjustments increased government spending. The only exception is Asia, when economic development variable is not controlled for.
COMPOSITION OF SPENDING
Some studies have analyzed the impact of composition of government spending on economic growth (Devarajan, Swaroop, and Zou 1996), but few have modeled the determination of composition. Understanding why certain countries spend more on one sector than others will help developing countries reallocate government resources to the most productive sector by focusing on major forces behind existing patterns. The composition of government spending is modeled in the following specification:
Si,t = g(GEPGDPt-1, GDPPt-1, SAt, Zi,t) (2)
where Si,t is the share of ith sector7 in total government expenditure, GEPGDPt-1 is a one-year lag of government expenditure as a percentage of GDP, GDPPt-1 is a one-one-year lag of per capita GDP, and Zi,t comprises other factors that may affect government spending in the sector. Again, we use year and country dummies to proxy for Z and to control for other factors excluded from the equation. Similar to equation 1, we also endogenize the independent variables of
7 where S
1= agriculture, S2= education, S3= health, S4= social security, S5= transportation and communication, and S6= defense.
GEPGDPt-1, GDPPt-1, SAt as functions of lagged revenue and GDP variables. Regression results are presented in Table 5.
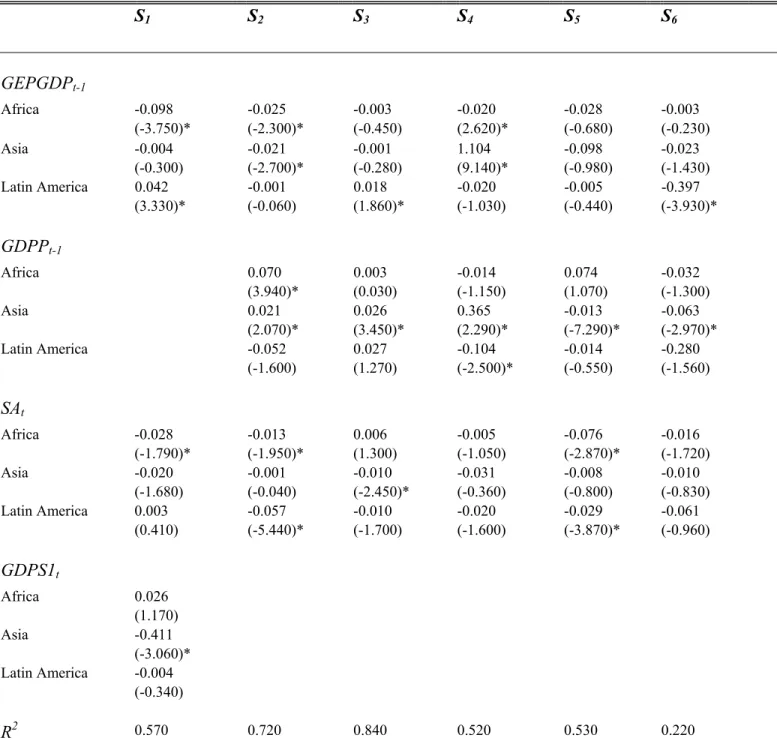
Table 5--Determinants of sector share in total government expenditures
S1 S2 S3 S4 S5 S6 GEPGDPt-1 Africa -0.098 -0.025 -0.003 -0.020 -0.028 -0.003 (-3.750)* (-2.300)* (-0.450) (2.620)* (-0.680) (-0.230) Asia -0.004 -0.021 -0.001 1.104 -0.098 -0.023 (-0.300) (-2.700)* (-0.280) (9.140)* (-0.980) (-1.430) Latin America 0.042 -0.001 0.018 -0.020 -0.005 -0.397 (3.330)* (-0.060) (1.860)* (-1.030) (-0.440) (-3.930)* GDPPt-1 Africa 0.070 0.003 -0.014 0.074 -0.032 (3.940)* (0.030) (-1.150) (1.070) (-1.300) Asia 0.021 0.026 0.365 -0.013 -0.063 (2.070)* (3.450)* (2.290)* (-7.290)* (-2.970)* Latin America -0.052 0.027 -0.104 -0.014 -0.280 (-1.600) (1.270) (-2.500)* (-0.550) (-1.560) SAt Africa -0.028 -0.013 0.006 -0.005 -0.076 -0.016 (-1.790)* (-1.950)* (1.300) (-1.050) (-2.870)* (-1.720) Asia -0.020 -0.001 -0.010 -0.031 -0.008 -0.010 (-1.680) (-0.040) (-2.450)* (-0.360) (-0.800) (-0.830) Latin America 0.003 -0.057 -0.010 -0.020 -0.029 -0.061 (0.410) (-5.440)* (-1.700) (-1.600) (-3.870)* (-0.960) GDPS1t Africa 0.026 (1.170) Asia -0.411 (-3.060)* Latin America -0.004 (-0.340) R2 0.570 0.720 0.840 0.520 0.530 0.220
Notes: S1 = agriculture, S2 = education, S3 = health, S4 = social security, S5 = transportation and communication, and S6 = defense. Figures in parentheses are t-values. Asterisk (*) indicates significance at the 10 percent level. All regressions include country dummies to capture country-fixed effects.
For all regressions, we disaggregated our analysis into regions. As total government expenditures increase, the share of agriculture expenditure (S1) declines in Africa and increases in Latin America. For Asia, the relationship is statistically insignificant. The share of the agriculture sector in total GDP (GDPS1) is not statistically correlated with government expenditure shares in agriculture in Africa and Latin America, but in Asia as the share of agriculture in total GDP declines, the share of expenditures on agriculture increases, implying that these countries may have started to protect their agriculture. The most important finding is that structural adjustments reduced government expenditure shares in the agriculture sector in Africa. But such a biased treatment from structural adjustment is not obvious in Asia and Latin America.
Results for S2 (education sector) indicate that as a country becomes richer, the share of education expenditures becomes larger in Asia and Africa, evidenced by positive and statistically significant coefficients of GDPPt-1 variables in the education shares equation. In Latin America, however, this relationship is not significant. Structural adjustments had no impact on education spending in Asia. However, education has suffered from structural adjustment programs in Africa and Latin America—the coefficient of the adjustment program variable is negative and statistically significant in these two regions.
The relationship of health expenditure share to government revenue and per capita GDP variables differs sharply among regions, as shown in regression S3 of Table 5. In Africa and Asia, the relationship is negative and statistically insignificant. In Latin America, as the economy grows and revenues increase, governments increasingly spend more on health care. Structural adjustment programs had little impact on health shares in total expenditures in Africa and Latin
America. However, Asian governments reduced their spending shares on health as a result of structural adjustment programs.
Results from S4 show that the shares of social security in total government expenditures in Africa and Latin America are generally negatively correlated with their economic
development level (per capita GDP) or spending power (government expenditures as a
percentage of GDP). By contrast, as economy and spending power expand, governments tend to spend more on social security in Asia. In all regions, the structural adjustment programs showed no impact on social security spending.
Structural adjustments had an adverse impact on government spending on infrastructure across all regions, although they are statistically insignificant in Asia (regression S5 in Table 5). This implies that governments may have reduced infrastructure investment during
macroeconomic structural adjustment programs, particularly in Africa and Latin America. Defense expenditures as a share of total government expenditures had a negative
relationship with the level of economic development in Asia and Latin America. In other words, poorer countries spent large shares of total government expenditures on military defense than less poor countries in the study. This inverse relationship is particularly strong for Asia.
Structural adjustment programs reduced defense spending in all regions. However, this reduction is not statistically significant.
4. IMPACT OF GOVERNMENT SPENDING ON GROWTH
Many studies have analyzed how government expenditures contribute to economic growth (Barro 1990; Kelly 1997). However, they focused on the impact of total government expenditures and overall GDP growth. Very few studies attempted to link different types of
government spending to growth, and even fewer attempted to analyze the impact of government spending at the sector level. In this section, we first model the impact of different types of
government spending on overall GDP growth, then analyze the effect of agricultural spending on agricultural GDP.
SPENDING AND OVERALL GDP GROWTH
We estimate a production function with national GDP as the dependent variable, and labor, capital investment, and various government expenditures as independent variables.
GDPt = h(LABORt, Kt, KGE i,t, SAt, Wt) (3)
where GDPtis GDP at year t, LABORt and Ktare labor and private capital inputs at year t, and KGEi,t is capital stock constructed from current and past government spending in the ith sector with KAGEXPt representing government stock in the agricultural sector, KEDEXPt
representing the education sector, KHEXPt representing the health sector, KTCEXPt representing the transportation and telecommunication sector, KSSEXPt representing the social security sector, and KDEXPt representing the defense sector. Usually this stock cannot be observed directly, so it serves more as a part of the conceptual apparatus than an empirical tool. To
construct a capital stock series from data on capital formation, we used the following procedure: 1 -t K ) δ (1− + = t t I K (4)
where Ktis the capital stock in year t, Itis gross capital formation in year t, and δ is the depreciation rate. Since the depreciate rate varies by country, we simply assume a 10 percent depreciation rate for all the countries. To obtain initial values for the capital stock, we used a similar procedure to Kohli (1982):
) r δ ( 1980 1980 = + I K (5)
Equation 5 implies that the initial capital stock in 1980 (K1980) is capital investment in 1980 (I1980) divided by the sum of real interest rate (r) and depreciation rate.
Impact of structural adjustment programs on economic growth is captured by variable SAt, and other factors not included in the equations are captured through the year and country dummies of Wt.
Results are shown in Table 6. Regression 1 (R1) reports results by region when structural adjustment variables SA,t are excluded, while regression 2 (R2) reports those with SA,t included. The labor and capital coefficients are positive and statistically significant for all regions. For government expenditures on agriculture, coefficients are positive and statistically significant in Africa and Asia. For Latin America, the coefficient is insignificant although positive. For
education expenditure, the coefficients are positive and statistically significant only in Asia. This indicates that continued education investment in Asia will contribute greatly to GDP growth. Coefficients for Africa and Latin America are negative.
Table 6—Estimates of GDP function R1 R2 LABORt Africa 0.766 0.812 (15.790)* (16.990)* Asia 0.922 0.871 (6.210)* (5.890)* Latin America 1.092 1.000 (26.830)* (17.260)* Kt Africa 0.325 0.312 (10.190)* (9.690)* Asia 1.165 1.171 (11.230)* (11.610)* Latin America 0.784 0.836 (7.780)* (8.190)* KAGEXPt Africa 0.052 0.051 (2.160)* (2.150)* Asia 0.076 0.087 (1.870)* (2.160)* Latin America 0.0198 0.007 (0.800) (0.290) KEDEXPt Africa -0.099 -0.107 (-2.230)* (-2.420)* Asia 0.283 0.257 (2.650)* (2.410)* Latin America -0.083 -0.066 (-1.800)* (-0.960) KHEXPt Africa 0.211 0.219 (6.170)* (4.350)* Asia -0.081 -0.089 (-1.390) (-1.530) Latin America 0.176 0.178 (6.720)* (6.900)* KTCEXPt Africa 0.021 0.021 (1.000) (1.070)
Table 6—Estimates of GDP function (continued) R1 R2 Asia -0.228 -0.225 (-6.210)* (-6.180)* Latin America 0.023 0.022 (0.930) (1.070) KDEXPt Africa -0.182 -0.173 (-5.300)* (-5.070)* Asia 0.122 0.127 (3.580)* (3.790)* Latin America -0.085 -0.083 (-3.810)* (-3.730)* KSSEXPt Africa 0.007 0.016 (0.300) (0.620) Asia -0.017 -0.016 (-0.990) (-0.920) Latin America -0.016 -0.011 (-0.960) (-0.690) SAt Africa -0.031 (-1.810)* Asia 0.065 (2.990)* Latin America 0.046 (2.370)* R2 0.997 0.998
Notes: The dependent variable is total GDP. Figures in parentheses are t-values. Asterisk (*) indicates significance at the 10 percent level. All regressions included country and year dummies to capture country- and year-fixed effects.
The coefficient for health expenditures is positive and statistically significant in Africa and Latin America. In Asia, the coefficient is not statistically significant. The coefficient for social security spending in all regions is statistically insignificant. Similar to social security, transportation and communication expenditures did not have a positive and statistically
significant impact on economic growth. Defense expenditure had a very strong negative impact on economic growth in Africa and Latin America. Finally, structural adjustment programs increased GDP growth in Asia and Latin America but not in Africa.
AGRICULTURAL SPENDING AND GROWTH IN AGRICULTURE
Since agricultural growth has been one of the most effective ways for poverty reduction through the so-called “trickle-down” process, we estimate the determinants of agricultural growth in developing countries. We pay special attention to how government spending can promote growth in the agricultural sector. We include an explanatory variable in the agricultural production function that measures government expenditures on agriculture to identify output-enhancing effects of public expenditures. The production function to be estimated is specified as:
AGOUTt = h(AGLANDt, LABORt, FERTt, TRACTt, ANIMALSt, IRRIPt, ROADSt, LITEt,
KAGEXPt,SAt,Ut) (6)
where AGOUTt is agricultural output, the dependent variable; the independent variables are labor (LABORt), land (AGLANDt), fertilizer (FERTt), number of tractors (TRACTt), number of draft animals (ANIMALSt), and public input variables such as percentage of crop areas under irrigation (IRRIPt), road density (ROADSt), literacy rate (LITEt), and an agricultural expenditure capital variable (KAGEXPt). Impact of structural adjustment programs on economic growth is captured by variable SAt. The variable Ut is used to capture the other factors not included in the equation, and is proxied by year and country dummies.
We further disaggregate government expenditures into research (KAGREXPt) and non-research expenditure capitals (NKAGREXPt) to capture separate effects of these two types of
expenditures. These capital variables are converted from government expenditures using procedures similar to those described in equations 4 and 5.
Output is measured as the agricultural output index reported by Food and
Agriculture Organization (FAO), where agriculture is broadly defined to include crop, livestock, forestry, and fishery production. All these variables were incorporated into the estimating equation as indices and in logarithm forms to minimize bias that may arise from using different scales or units of input and output for each country.
Two different specifications were estimated, and the results are presented in Table 7. The first specification includes conventional inputs such as labor, land, fertilizer, machinery, and draft animals; physical public inputs such as irrigation, road density, and literacy rate; and a stock variable of total government expenditure on agriculture. The second specification disaggregates total agricultural expenditures into agricultural and non-agricultural research expenditures (total agricultural expenditures net of agricultural research expenditures). Due to the limited number of observations (21), we were unable to conduct this analysis at the regional level.
Table 7—Estimates of agriculture production function R1 R2 KAGEXPt 0.0370 (3.1100)* KAGREXPt 0.0430 (1.8700)* KNAGREXPt 0.0170 (1.0300) AGLANDt 0.4430 0.6480 (3.1500)* (3.0500)* IRRIPt 0.2540 0.2450 (7.1700)* (5.3300)* LABORt -0.0590 0.1660 (-0.5400) (1.0400) FERTt 0.0560 0.0480 (3.7000)* (1.4400) TRACTSt 0.0007 0.0660 (0.0300) (1.7500)* ANIMALSt 0.1780 -0.0840 (3.0500)* (-0.8900) ROADSt 0.1840 0.1770 (3.0900)* (2.5600)* LITERACYt 0.0200 0.0170 (8.1400)* (2.6300)* R2 0.9970 0.9980
Notes: The dependent variable is agricultural production index. Figures in parentheses are t-values. Asterisk (*) indicates significance at the 10 percent level.. All regressions included country dummies to capture country-fixed effects.
Similar to the results in Table 6, total agricultural expenditures had a significant effect on agricultural GDP, as shown in the first regression of Table 7. The coefficients for all
conventional inputs except labor and machinery are statistically significant. Insignificant coefficients of labor and machinery inputs imply that there may be a large surplus of labor in
rural areas. Physical public capital inputs, including roads, irrigation, and literacy rate, are all positive and statistically significant. This strongly suggests that broader rural investments in infrastructure and education contributed to agricultural production growth.
Disaggregating total agricultural expenditure into research and non-research expenditures reveals an interesting finding: although both their coefficients are positive, the coefficient for agricultural research is larger in magnitude and more significant in statistical level than non-research expenditures. This is prima facie evidence that productivity-enhancing expenditures, such as agricultural research investments have much larger output-promoting effects than other forms of public spending (including subsidies).
5. MAJOR FINDINGS AND RECOMMENDATIONS
In this study, we compiled government expenditures by types across 43 developing countries between 1980 and 1998. We then analyzed trends, determination, and impact of various forms of government spending. The following are the major findings of this study.
Total government expenditures for 43 countries included in the study increased over time. Macroeconomic adjustments do not seem to adversely affect total government spending. However, when we control for other variables and disaggregate the analysis into different regions, structural adjustment programs increased total government spending in almost all regions.
Structural adjustment programs had different consequences for different sectors. In Africa, governments reduced shares for agriculture, education, and infrastructure, while Asian governments reduced shares for agriculture and health. Education and infrastructure suffered from reduction in government expenditures in Latin America.
The performance of government spending in economic growth is mixed. In Africa, government spending in agriculture and health were particularly strong in promoting economic growth. Among all types of government expenditures, agriculture, education, and defense contributed positively to economic growth in Asia. In Latin America, health spending had a positive promoting effect. Structural adjustment programs had a positive growth-promoting effect in Asia and Latin America, but not in Africa. In fact, structural adjustment programs hurt economic development in the region.
Agricultural spending, irrigation, education, and roads contributed strongly to growth. Disaggregating total agricultural expenditures into research and non-research spending reveals that research had a larger productivity enhancing impact than non-research spending.
Several lessons can be drawn from this study. First, various types of government spending have differential impacts on economic growth, implying greater potential to improve efficiency of government spending by reallocation among sectors. Second, governments should reduce their spending in unproductive sectors such as defense, and curtail excessive subsidies in fertilizer, irrigation, power, and pesticides. Third, all regions should increase spending in agriculture, particularly on production-enhancing investments such as agricultural R&D. This type of spending not only yields high returns to agricultural production, but also has a large impact on poverty reduction since most of the poor still reside in rural areas and their main source of livelihood is agriculture.
REFERENCES
Aschauer, D. 1989. Is public expenditure productive? Journal of Monetary Economics 23: 177– 220.
Asian Productivity Organization. 1991. Public expenditures on agriculture in Asia. Tokyo: Asian Productivity Organization.
Barro, J. R. 1990. Government spending in a simple model of endogenous growth. Journal of Political Economy 20(2), 221–247.
Devarajan S., V. Swaroop, and H. Zou. 1997. The composition of public expenditure and economic growth. Journal of Monetary Economics 37.
Elias, V. 1985. Government expenditures on agriculture and agricultural growth in Latin America. Research Report 50. Washington, D.C.: International Food Policy Research Institute.
Fan, S., P. Hazell, and S. Thorat. 2000. Government spending, agricultural growth and poverty in rural India. American Journal of Agricultural Economics 82(4).
Fan, S., P. Hazell, and T. Haque. 2000. Targeting public investments by agroecological zone to achieve growth and poverty alleviation goals in rural India. Food Policy 25(4).
Fan, S., L. Zhang, and X. Zhang. 2000. Growth and poverty in rural China: The role of public investment. Environment and Production Technology Division Discussion Paper 66. Washington, D.C.: International Food Policy Research Institute.
Fan, S., and P. Pardey. 1998. Government spending on Asian agriculture: Trends and production consequence. In Agricultural public finance policy in Asia. Tokyo: Asian Productivity Organization.
Food and Agriculture Organization. 1984. Public expenditure on agriculture in developing countries, 1978–82. Rome: Food and Agriculture Organization.
Food and Agriculture Organization. 1970–96. FAO production yearbook. Rome: Food and Agriculture Organization.
Food and Agriculture Organization. 2000. FAOStat database, June 2000. Rome: Food and Agriculture Organization.
Gwartney, J., R. Holcombe, and R. Lawson. 1998. The scope of government and the wealth of nations. Cato Journal 18(2).
International Food Policy Research Institute. 1996. Study shows AIDS slowing economic growth in Africa: Asian economies could also suffer as epidemic spreads. Recent IFPRI New Releases & Backgrounder (www.ifpri.cgiar.org), June 17.
Inter-American Development Bank. 1995, 1998–99. Economic and social progress in Latin America. Washington, D.C.: Inter-American Development Bank.
International Monetary Fund. 1973–1996. Government finance statistics yearbook. Washington D.C.: International Monetary Fund.
Jonakin, J., and M. Stephens. 1999. The impact of adjustment and stabilization policies on infrastructure spending in Central America. The North American Journal of Economics and Finance 10: 293–308.
Kelly, T. 1997. Public expenditures and growth. Journal of Development Studies 34(1).
Knight, M., N. Loayza, and D. Villanueva. 1996. The peace dividend: Military spending cuts and economic growth. IMF Staff Papers 43(1). Washington, D.C.: International Monetary Fund.
Kohli, Ulrich. 1982. A Gross National Product Function and the Derived Demand for Imports and Supply of Exports. Canadian Journal of Economics, 18 (1982): 369–386.
Lindauer, D. L, A. D. Velenchik. 1992. Government spending in developing countries: Trends, causes and consequences. The World Bank Research Observer 7(1): 59–78.
Pardey, P. G., and N. M. Beintema. 2001. Slow magic: Agricultural R&D a century after Mendel. Agricultural Science and Technology Indicators Initiative. Washington, D.C.: International Food Policy Research Institute.
Pardey, P. G., J. Roseboom, and N. M. Beintema. 1997. Investments in African agricultural research. World Development 25(3): 409–23, March.
Pardey, P., J. Roseboom, and S. Fan. 1997. Trends in financing Asian agricultural research. Washington, D.C.: International Food Policy Research Institute (mimeograph).
Rao, M. G. 1998. Accommodating public expenditure policies: The case of fast growing Asian economies. World Development 26(4): 673–694.
State Statistical Bureau (China). 1990–96. China statistical yearbook. Beijing: China Statistical Press.
Tanzi, V., and H. Zee. 1997. Fiscal policy and long-run growth. IMF Staff Papers 44(2): 179– 209.
United Nations Educational and Scientific and Cultural Organization’s Institute for Statistics, December 1999 (http:/unescostat.unesco.org).
United States Department of Agriculture, Economic Research Service. 1993. International agriculture and trade reports. RS-92-5. Washington, D.C.: August.
van Blarcom, B., O. Knudsen, and J. Nash. 1993. The reform of public expenditures for agriculture. World Bank Discussion Paper 216. Washington, D.C.: World Bank.
van de Walle, D. 2000. Choosing rural road investments to help reduce poverty. Working Paper No. 2458, World Bank (Development Research Group). Washington, D.C.: World Bank. World Bank. 2000. 2000 World development indicators. Washington, D.C.: World Bank.
APPENDIX 1: DATA SOURCES AND MEASUREMENT ISSUES
DEFINITION AND MEASUREMENT OF GOVERNMENT EXPENDITURES9
Total expenditure is broken down into various sectors following the International Monetary Fund’s Government Finance Statistics Yearbook sectors. This study concentrates on six sectors, namely agriculture, defense, education, health, social security, and transportation and
communication. Please see Appendix Table 1 for definitions.
To convert expenditures denominated in current local currencies into international dollar aggregates expressed in base year (1995), prices were first deflated from current local currency expenditures to a set of base year prices using each country’s implicit GDP deflator. We then used 1995 exchange rates measured in 1995 purchasing power parity reported by the World Bank (2000) to convert local currency expenditures measured in terms of 1995 prices into a value aggregate expressed in terms of 1995 international dollars.
Data Sources
We included 43 developing countries from three regions in our analysis, partly reflecting availability of data and partly because these countries are important in their own right while representing broader rural development throughout all developing countries. The 17 countries included for Africa are Botswana, Burkina Faso, Cameroon, Côte D’Ivoire, Egypt, Ethiopia, Ghana, Kenya, Malawi, Mali, Morocco, Nigeria, Togo, Tunisia, Uganda, Zambia, and
Zimbabwe. We included 11 countries from Asia: Bangladesh, China, India, Indonesia, Korea, Malaysia, Myanmar, Nepal, Philippines, Sri Lanka, and Thailand. For Latin America, we included 15 countries: Argentina, Belize, Bolivia, Chile, Colombia, Costa Rica, Dominican
Republic, Ecuador, El Salvador, Guatemala, Mexico, Panama, Paraguay, Uruguay, and Venezuela.
Total GDP, agricultural GDP, total population, agricultural population, employment and private investments by sector, road density, literacy rate, and information on structural change were taken from the World Bank database. Agricultural land, agricultural labor, irrigated areas, number of tractors, and number of draft animals were taken from the FAO database. The main sources for expenditure data reported here are International Monetary Fund’s (IMF) Government Financial Statistics Yearbook (various issues), Asian Development Bank’s (ADB) Key
Indicators of Developing Member Countries of ADB (various issues), FAOStat Database (June 2000), the World Bank’s 2000 World Development Indicators, United Nations Educational, Scientific, and Cultural Organization (UNESCO) Institute for Statistics for education data (http://unescostat.unesco.org/, December 1999), Inter-American Development Bank’s (IDB) Economic and Social Progress in Latin America (various issues), and Asian Productivity Organization’s Public Expenditures on Agriculture in Asia (1991). All data for agricultural research and development expenditures are taken from Pardey, Roseboom, and Beintema (1997).
For large countries such as India, Malaysia, Philippines, and Indonesia, both central and local government expenditures were reported by IMF sources. For many of the remaining
countries, only central government expenditures were reported, either by IMF and other sources. This may not cause a serious problem for the broad, cross-country comparisons reported here because many of these countries have minimal local government expenditures or lack sub-national government entities. In addition, we estimated arithmetic averages and geometrically
extrapolated data for countries whose values were missing to ensure continuity of data. Please see Appendix Table 1 for a summary of these extrapolations by country.
Appendix Table 1—Data source and extrapolation
Countries Expenditure data Years extrapolateda SAPb
AFRICA
Botswana Data for all sectors and years available 1991
Burkina Faso Agriculture 1994–95 1989
Cameroon Education 1998 1981
Cote d’Ivoire Total expenditure 1981–83, 91–92 1991
Agriculture 1981–84, 1986–98
Defense 1981–83, 1986–88
Education 1981–84, 1986–89
Social security, T&C 1981–83
Egypt Total revenue, total expenditure, 1998 1993
Capital expenditure, agriculture, health, social security
Ethiopia Data for all sectors and years available 1987
Ghana Data for all sectors and years available 1980
Kenya Data for all sectors and years available 1981
Malawi Defense 1990–95 1990
Mali Agriculture 1989–98 1988
Defense 1989–90
Morocco Total revenue 1997–98 1986
Transportation 1988–90
Nigeria Total revenue 1988–91 1983
Total expenditure 1980–83
Togo T&C 1988–91 1988
Tunisia Data for all sectors and years available 1987
Uganda Total revenue 1987–88 1985
T&C 1987–90
Zambia Defense 1984–88 1992
Zimbabwe Agriculture, T&C 1990–92, 1998 1984
Education, social security 1990–92
Health 1998
ASIA
Bangladesh Total revenue 1990–92 1983
Health 1986–88
T&C 1998
China Health 1998 1991
India Social security 1998 1998
Indonesia Social security 1980–1993 n. a. 1981
Korea, Rep. of Agriculture 1998
Appendix Table 1—Data source and extrapolation (continued)
Countries Expenditure data Years extrapolateda SAPb
Myanmar Data for all sectors and years available Nepal Data for all sectors and years available Philippines Data for all sectors and years available Sri Lanka Data for all sectors and years available Thailand Data for all sectors and years available
LATIN AMERICA
Argentina Education 1986–88 1980
Health 1980–88
Social security 1982–87
Belize Revenue, expenditure, agriculture, capital 1986–87 1985
Agriculture, T&C 1998
Bolivia Agriculture, T&C 1985–86 1985
Chile Agriculture 1989–90
Colombia Agriculture, T&C 1985–89 1985
Defense, health, social security 1985–88
Costa Rica Data for all sectors and years available 1994
Dominican Rep. T&C 1998 1991
Ecuador Agriculture 1991–98
El Salvador Data for all sectors and years available 1982
Guatemala Data for all sectors and years available 1983
Mexico Agriculture, T&C, health, 1998 1987
education, social security
Panama Data for all sectors and years available 1989
Paraguay Data for all sectors and years available
Uruguay Education 1982–85
Venezuela Education 1995–98
Sources: IMF’s Government Finance Statistics Yearbook (various issues) unless otherwise noted. Data for China are taken from the Chinese Statistical Yearbook (various years). N.a. means not available. Note: T&C is transportation and communication.
aData were extrapolated using a five-year period. bYear of first structural adjustment program.
38
Appendix Table 2—Definitions of gov
ernment and sectora
l expenditu res Type of expen d iture Includes Go ve rnm ent re ven ue C ur rent reve nu e (t ax an d nont ax reve nu e), ca pi ta l reve nu e, a nd g ra nt s Go ve rnm ent expe nd itu re C ent ral g ov er nm ent (g ov er nm ent de pa rt m ents, o ffi ces , est abl is hm ent s, an d ot he r bo di es th at are a ge nci or in stru m en ts); state, p rov in cial, o r reg ion al go ve rn m en t; lo cal g ov ern m en t; su pran ati on al au tho rities Defen se Ad m in istratio n, sup erv isi on, an d op eratio n of mili ta ry defe ns e af fairs a nd f orces: la nd, sea , air, and s pace de fen se fo rces; ad m in istratio n, op eratio n, and su ppo rt of ci vil d efen se fo rces; ad m in istratio n of m ilitary ai d; resea rch a nd ex pe ri m ental devel opm ent o f defe nse Ed ucat ion Pre-pr im ary and p ri m ary educat ion af fai rs a nd se rvi ces: ad m ini st rat ion, m anagem ent , insp ect io n, o pe rat su ppo rt of schoo ls an d ot he r in stitu tion s pr ov id ing tr ain in g at th ese lev els; ad m in istratio n of secon da ry ed ucation affai rs an d ser vi ces: ge ner al pr og ram s and vocat io nal a nd tech ni cal; ad m in istratio n of tertiary edu cation an d serv ices: un iv ersity an d oth er i nstitu tio ns prov id in g tert iary edu catio n serv ices; sub si diary serv ices t educat io n ( ot her se rvi ces f or st ude nt s rega rd le ss of le vel of educat io n) Health Ad m in istratio n o f ge neral ho sp ital affairs an d serv ices: m anagem ent , ope rat io n, i nspect io n, or s up ho sp itals th at do n ot lim it th eir serv ices to a pa rticu lar med ical sp ecialty; sp ecialized ho sp ital serv ices (for a pa rticu co nd itio n or di sease); m ed ical and m atern ity cen ter se rv ices; n ursing and co nv alescen t homes; clin ics, med ical, d en tal, and p aram ed ical p ractitio ne rs; pu blic health affai rs an d serv ices (su ch as bl oo d b ank ope rat io ns, di sease det ent io n cent ers, p re ven tion se rvi ces , a nd p opul at io n cont rol se rv ices); ap pl ie d researc h a nd e xpe ri m ent al devel opm ent rel at ed t o heal th an d m edi cal del iv ery sy st em Social sec urity and welfare Tr ansf er p aymen ts, in clud ing p aym en ts in k ind ( to co m pen sate fo r redu ctio n/loss of in co m e o r in earni ng ca paci ty ); adm ini st rat ion, m anagem ent , o r ope rat io n o f s oci al secu ri ty affai rs i nvol vi ng chi efl y pr bene fi ts for loss due to sickness, c hildbirth, or tem porary di sability resulting from indust rial a nd othe r accide nts— in clu de s m atern ity b en efits; ad m in istratio n, man ag em en t, or o pe ratio n of retire m en t, pe ns io ns , o r d isab for go ve rn m en t e m pl oy ees, bo th ci vil and m ilitary an d th ei r su rv ivo rs; admin istratio n, op eration , and su of o ld ag e, di sab ility, o r surv iv or’s ben efits; u ne m plo ym en t co m pen sation b en efits; fam il y an d ch ild allo wan
ces; welfare affairs an
d serv ices (child ren’s and o ld ag e resid en tial in stitu tio ns , h and icapp ed person ot he r resid en tial in stitu tio ns )
39
Appendix Table 2—Definitions of government
and sectora l expe nditures (continued) Type of expen d iture Includes Ag ricultu re, fo rest ry , fi shi ng Adm ini st rat io n o f a gri cul tu ral la nd co nse rvat ion a ffai rs a nd servi ces , i ncl ud in g: la nd recl am at ion an d l and h un tin g expa nsi on , l an d cl eara nce, in st al la tion o f dr ai nage sy st em s, p rovi si on o f i rri gat io n sy st em s, reduct io n salin ity, o utlays fo r con stru ctio n of da m s, d ik es and irri gat io n canal s, in st al la tion o f e qui pm ent , m anagem and o pe rat io n of al l p hy si cal wo rk s (a s m ent ione d a bo ve ), re search an d de vel opm ent ; adm ini st rat ion ag rarian reform an d lan d settle m en t affairs an d serv ices: desig n, field m an ag em en t, op eratio n, an d ev of land refo rm an d resettlem en t activ ities, exten sion o f credit in con ne ction with su ch act iv ities, ou tlays to lan do w ne rs who se title to th e lan d was ch ang ed, resear ch of land refo rm an d resettlem en t; ad m in istratio of af fai rs a nd s ervi ces desi gne d t o st abi lize o r i m prove fa rm p ri ces an d far m ers’ i nc om es: su bsi di es o form s of payments, researc h in to desi gn and efficacy of pric e suppor t sc he
mes; public inform
ation and statistics co llec ted , ad m in istratio n of agricu ltu ral ex ten si on affairs and serv ices, ad m in ist ratio n of ve affai rs an d ser vi ces i ncl udi ng resea rch , a dm ini st rat io n o f pe st co nt rol a ffai rs a nd ot her ser vi ces; adm of fo rest ry affairs and serv ices in clud ing regu latio n of gove rnm ent forest operations a nd t he iss uance fellin g licenses; o utlays in th e fo rm o f l oan s, tran sfers, an d su bs id ies; research in to all aspects o f fo rest m anagem ent and ex pl oi ta tio n; adm ini st rat ion of com m ercial or sp or t fi sh in g an d hunt in g affai rs a nd sup po rt f or fi sh hat che ri es or gam e preser ve s Transpo rtation and comm unication Road transport affai rs a nd services incl ude s highway c onstr uc tio n affairs an d serv ices (i nclu di ng lo an and s ubsi di es; researc h i nt o ro ad de si gn a nd co nst ruct io n m et hods ); r oa d sy st em ope rat io n af fai rs a nd serv ices (o th er th an con stru ctio n); water transp ort a ffairs and serv ices in cl ud
es: water tran
sport facility con st ruct io n af fai rs a nd se rvi ces (i ncl udi ng lo an s, t ra ns fers, and sub sid ies; research in to water transpo and co nst ruct io n m et hods ); w at er t ran sp ort o perat io n a ffai rs an d se rvi ces ( ot he r t ha n c ons tr uct io n); railway affairs an d serv ices i nclu de s: railway facility co ns tru ctio n affairs an d serv ices (inclu di ng lo an an d su bs id ies; research in to railway tr ans po rt desi gn an d c onst ruct io n m eth od s); railway tran spo rt op affairs and serv ices (o th er t han co nstr uc tio n); air tran sp ort affairs and serv ices in cl ud
es: air tran
sp ort facilit con st ruct io n af fai rs a nd se rvi ces (i ncl udi ng lo an s, t ra ns fers , an d s ubsi di es; researc h i nt o ai r t ra ns po rt co nstru ction m eth od s); ai r tran sport op eration affairs and serv ices (o th er than co nstru cti on ); p ip elin e
40
Appendix Table 2—Definitions of government
and sectora l expe nditures (continued) Type of expen d iture Includes tran sp ort an d oth er tran spo rt affairs and services (s uc h as ca ble railw ays, a erial cables, funiculars , etc.); pip elin e tran spo rt facility co ns tru ctio n a ffairs an d serv ices (in clud ing loan s, tran sfers, an d su bs id ies; in to ai r t ran sp ort de si gn an d c onst ruct io n m et hods ); pi pel in e t ra nspo rt ope rat io n affai rs a nd ser vi ces ( ot he r t con st ruct io n) ; adm ini st rat ion of com m uni cat ion a ffai rs a nd servi ces (i ncl udi ng lo an s, tr an sfe rs, an d su bs researc h i nt o c om m uni cat ion desi gn a nd c on st ruct io n m et hods ) Source: A M an ual o n Gove rn ment Fi nance St at is tic s , In tern atio na l M on etary Fu nd , 198 6.
Appendix Figure 1—Government spending intensities
Percentage of government expenditure in GDP
Percentage of agriculture expenditure in total AgGDP
Share of agricultural research expenditure in agriculture expenditure 0 5 10 15 20 25 30 35 1980 1982 1984 1986 1988 1990 1992 1994 1996 1998 Percentage
Africa Asia LAC
0 2 4 6 8 10 12 14 1980 1982 1984 1986 1988 1990 1992 1994 1996 1998 Percentage
Africa Asia LAC
0 5 10 15 20 1980 1982 1984 1986 1988 1990 Percentage
Appendix Figure 2—Composition of expenditures by region, 1980–1998 ASIA 0 100 200 300 400 500 600 1980 1982 1984 1986 1988 1990 1992 1994 1996 1998 PPP US$ 1995, Bn Agriculture Education
Health Transp. & Comm.
Social Security Defense
Other LATIN AM ERICA 0 50 100 150 200 250 300 350 400 1980 1982 1984 1986 1988 1990 1992 1994 1996 1998 PPP US$ 1995, Bn
Agriculture Education Health
Transp. & Comm. Social Security Defense
Other A F R IC A 0 50 100 150 200 1980 1982 1984 1986 1988 1990 1992 1994 1996 1998 PPP US$ 1995, Bn Agriculture Education H ealth T ransp. & C om m. Social Security D efense O ther