University of Arkansas, Fayetteville
ScholarWorks@UARK
Theses and Dissertations7-2015
Temperature in the Cotton (Gossypium hirsutum
L.) Canopy and Effects on Cotton Leaf and Boll
Growth
Maria Soledad Berlangieri Costa University of Arkansas, Fayetteville
Follow this and additional works at:http://scholarworks.uark.edu/etd
Part of theAgronomy and Crop Sciences Commons, and thePlant Biology Commons
This Thesis is brought to you for free and open access by ScholarWorks@UARK. It has been accepted for inclusion in Theses and Dissertations by an authorized administrator of ScholarWorks@UARK. For more information, please contactscholar@uark.edu.
Recommended Citation
Berlangieri Costa, Maria Soledad, "Temperature in the Cotton (Gossypium hirsutum L.) Canopy and Effects on Cotton Leaf and Boll Growth" (2015).Theses and Dissertations. 1295.
Temperature in the Cotton (Gossypium hirsutum L.) Canopy and Effects on Cotton Leaf and Boll Growth
A thesis submitted in partial fulfillment of the requirements for the degree of
Master of Science in Crop, Soil, and Environmental Sciences
By
Maria Berlangieri Costa Universidad de la Republica Bachelor of Science in Agronomy, 2009
July 2015 University of Arkansas
This thesis is approved for recommendation to the Graduate Council.
Dr. Derrick. M. Oosterhuis Thesis Director
Dr. Fred. M. Bourland Dr. Michael. D. Richardson Committee Member Committee Member
Dr. Trenton. L. Roberts Committee Member
Abstract
Cotton development and yield are negatively influenced by extremes temperatures, mainly during reproductive stage. Ambient air temperature is used to evaluate temperature stress effect on yield under field conditions; however, there is evidence that actual temperatures in the canopy where bolls develop are different. In terms of cotton responses, there is limited research about the effects of elevated day and night temperatures upon boll carbohydrate content, size, and boll respiration. Field and growth chamber experiments were performed during 2014-2015 using the cotton (Gossypium hirsutum L.) cultivar DP0912B2RF. Field studies for determining
temperature gradients through the canopy consisted of two planting dates with weekly measurements performed at noon, beginning one week after first flower. Temperature was recorded using thermocouple thermometers at both lower canopy (main-stem node 7±1) and upper canopy (main-stem node 11±1) positions, and included internal boll, air next to the boll, ambient air above the canopy, subtending leaf, and soil temperature. Results showed that there is a dynamic vertical temperature gradient through the canopy with the ambient air temperature being significantly cooler that the air inside the canopy. Consequently, ambient air temperature is not always an appropriate indicator of what is happening within the canopy. For analyzing the effect of high day and night temperature on boll carbohydrate and respiration, three growth chamber experiments were performed. The temperature regimes consisted of optimal temperature throughout the study (32/24oC, day/night) and high day and night temperature (38/30oC, day/night). The stress was imposed at first flower and the measurements were taken randomly two weeks later. Eight respiration measurements were recorded in a 24 hours period and boll size, boll weight, and carbohydrate content of bolls were analyzed. Results indicated that 38/30oC (day/night) temperature conditions presented a reduced boll size and a substantial decline in non-structural carbohydrate content.
Acknowledgement
I would like to thank to my academic advisor Dr. Derrick Oosterhuis for all his help, support and advice during my master program. Also I want to acknowledge my committee members for their cooperation. I would like to extend my recognition to the graduate students in the cotton physiology lab, Cristiane Pilon, Dimitra Loka, Toby FitzSimons, Taylor Coomer, and James Burke for their invaluable help. Finally, I will extend my thanks to my husband, my mother, siblings, and friends for being my support and guidance.
Dedication
Table of Contents
Page
Introduction 1
Review of Literature 2
General Characteristic and Cotton Physiology 2
Canopy Temperature and Microclimate 7
High Temperature Stress Effects 10
Growth and Yield 10
Leaf Development: Photosynthesis, Respiration, and Biomass Production 11
Boll Development 15
Carbohydrates Content 16
Night Temperature Effect 17 Growth and Development 17
Carbohydrates 19
Adenosine Tri-Phosphate (ATP) 20
Reactive Oxygen Species (ROS) and Heat Stress Proteins 20
References 21
Chapter I. Temperature Gradients in the Cotton Canopy and the Influence on Boll Growth
Abstract 29
Introduction 30
Objective 31
Hypothesis 31
Materials and Methods 32
Results 36
Weather Station Records 36
Temperature gradients 37
Microclimate Effects 42
Leaf Area Index 45
Photosynthesis 45
Carbohydrate content 49
Boll size, Dry Matter, and Locule Number 52
Continuous Measurement of Internal Boll Temperature 54
Discussion 56
Conclusion 63
References 64
Appendix 67
Chapter II. High Day and Night Temperature Effects on Cotton Boll Growth and Respiration
Introduction 71
Objective 72
Hypothesis 72
Materials and Methods 72
Results 76
Boll Size 76
Boll Dry Weight 76
Boll Carbohydrate 77
Boll Respiration 81
Continuous Measurement of Internal Boll Temperature 82
Discussion 84
Conclusion 87
References 88
Appendix 91
List of Tables
Table Title Page
Chapter I
1. Dates of tagging flowers and measurements by planting date and canopy position. 33 2. First planting date correlation coefficients for prediction of temperature inside 43
the canopy by ambient air or soil temperature, for each canopy position.
3. Second planting date correlation coefficients for prediction of temperature inside 43 the canopy by ambient air or soil, for each canopy position.
4. Prediction of temperature inside the canopy by multivariate models. 43
Data from both planting dates.
5. Both planting dates pooled data for prediction of temperature inside the canopy by 44
several variables. Planting dates are considered random blocking effects.
6. Leaf area index average at 65 and 80 days after planting 45 7. Average of temperature inside the canopy, photosynthesis (µmolCO2/m2/s), 46
relative humidity (%), and photosynthetic active radiation (PAR)(µmol/m2/s). Upper canopy first planting date.
8. Average of temperature inside the canopy, photosynthesis, 46
relative humidity (%), and photosynthetic active radiation (PAR) (µmol CO2/m2/s).
Lower canopy first planting date
9. Average of temperature inside the canopy, photosynthesis (µmol CO2/m2/s), 46
relative humidity (%), and photosynthetic active radiation (PAR) (µmol/m2/s). Upper canopy second planting date
10. Average of temperature inside the canopy, photosynthesis (µmol CO2/m2/s), 47
relative humidity (%), and photosynthetic active radiation (PAR) (µmol/m2/s).
Lower canopy second planting date
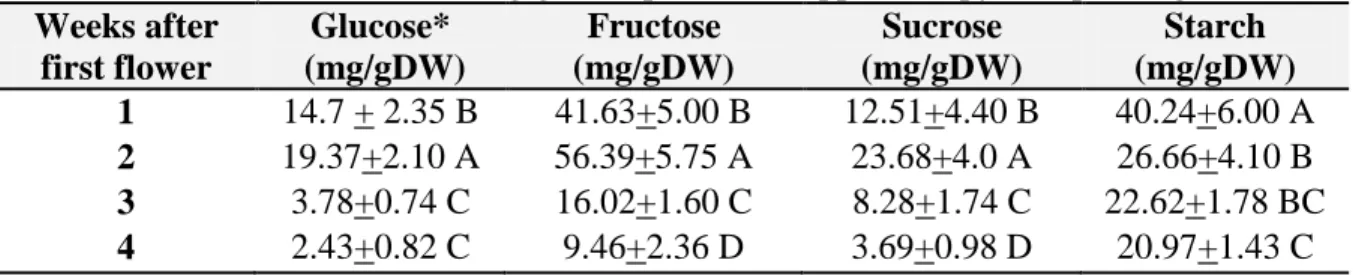
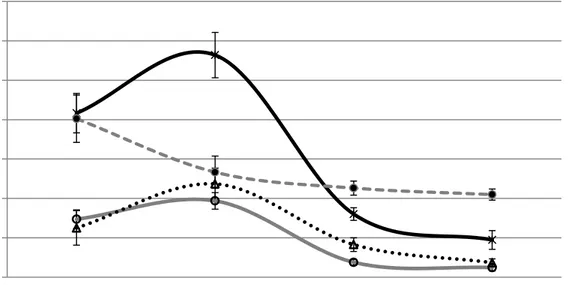
11. Carbohydrate content (mg/g DW) per week. Upper canopy first planting date. 49 12. Carbohydrate content (mg/g DW) per week. Lower canopy first planting date. 49 13. Carbohydrate content (mg/g DW) per week. Upper canopy second planting date. 50 14. Carbohydrate content (mg/g DW) per week. Lower canopy second planting date. 50 15. Average non- structural carbohydrate content of bolls (mg/gDW) 50 canopy per week for both planting dates.
16. Boll locule number per planting date and canopy position. 54
Appendix Chapter II
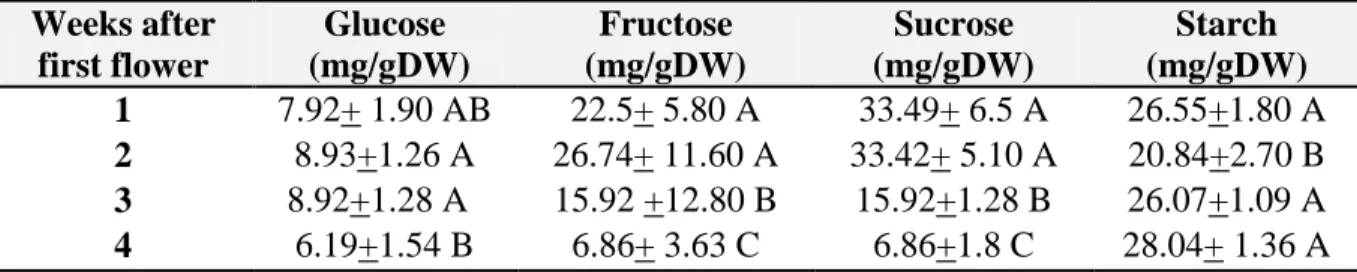
1. Summary table of non-structural carbohydrate content of 2 week old ‘cotton bolls per 91 treatment.
List of Figures
Figure Title Page
Chapter I
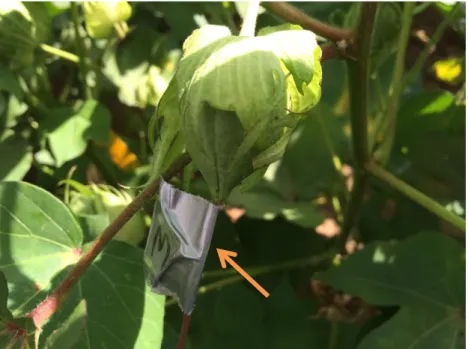
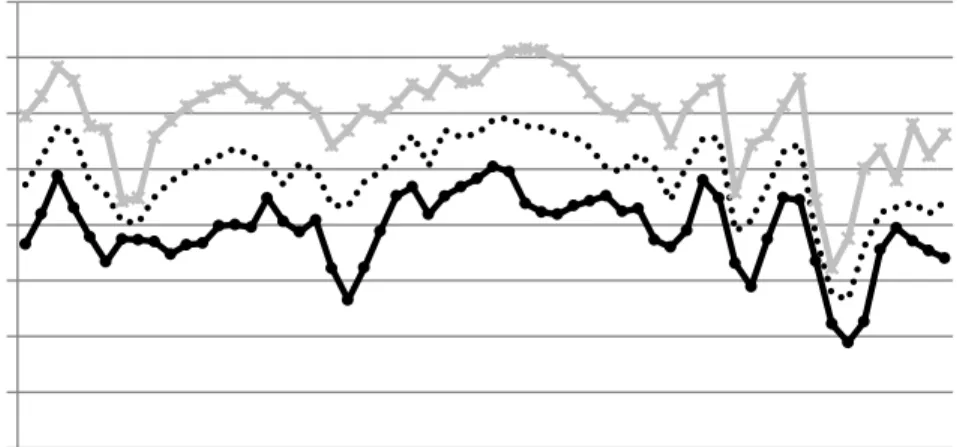
1. Thermocouple inserted on the top of the boll. 33 2. Minimum, maximum, and average temperature (oC) from the closest 37
weather station,100 m west of field , Fayetteville, AR, from July 24th 2014 and Sep 19th 2014.
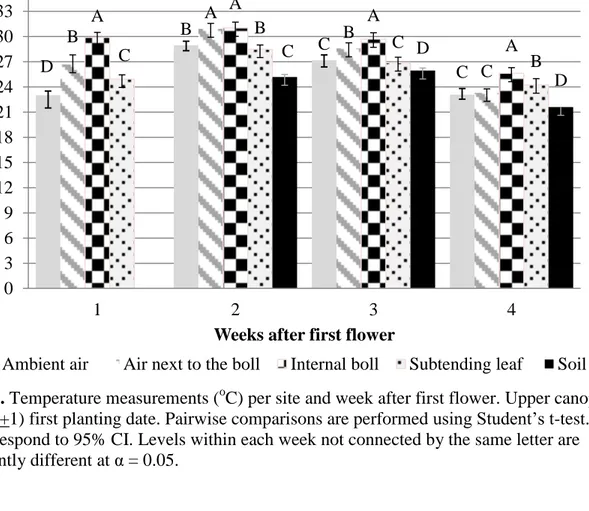
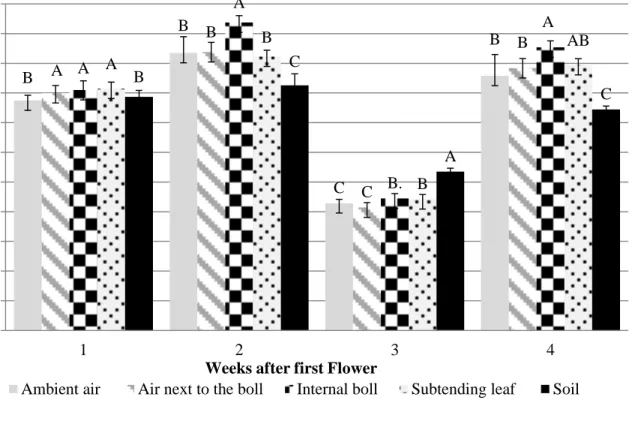
3. Temperature measurements (oC) per site and week after first flower. 39
Upper canopy (node 11+1) first planting date.
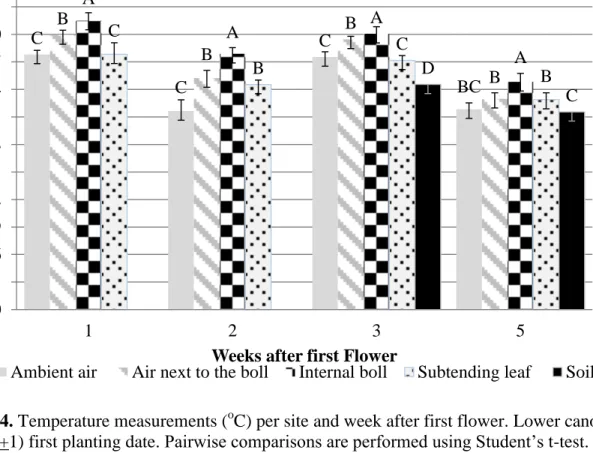
4. Temperature measurements (oC) per site and week after first flower. 40
Lower canopy (node 7+1) first planting date.
5. Temperature measurements (oC) per site and week after first flower. 41
Upper canopy (node 11+1) second planting date.
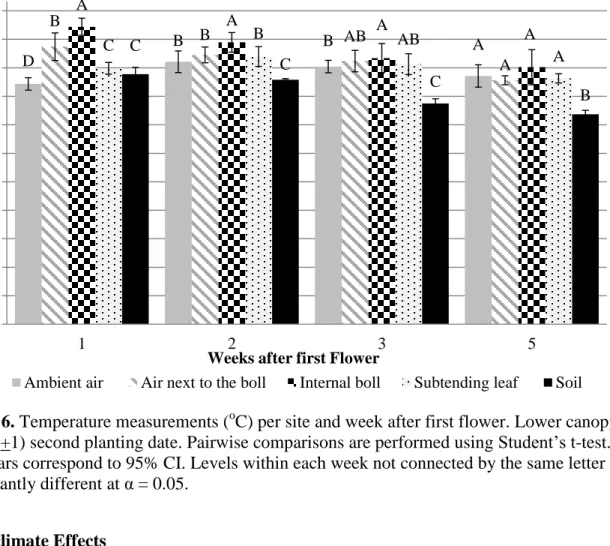
6. Temperature measurements (oC) per site and week after first flower 42
Lower canopy (node 7+1) second planting date.
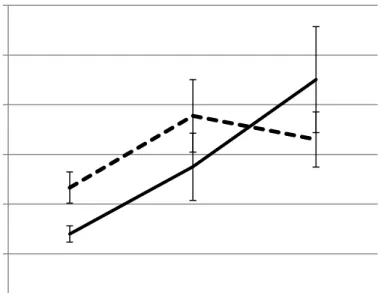
7. Lower canopy photosynthetic response to PAR under different 48
temperatures regimes (optimal and sub-optimal) using pooled data from both planting dates.
8. Upper canopy photosynthetic response to PAR under different 48
temperatures regimes (optimal and sub-optimal) using pooled data from both planting dates.
9. Carbohydrate content trends for the upper canopy first planting date 51 10. Carbohydrate content trends for the upper canopy second planting date. 51 11.a.Boll size (mm) and boll dry matter (g) for the upper canopy first planting date. 52
Figure11b. Boll size (mm) and boll dry matter (g) for the lower canopy first planting date.
12 a. Boll size (mm) and boll dry matter (g) for the upper canopy second planting date 53
Figure12b. Boll size (mm) and boll dry matter (g) for the lower canopy second planting date.
13. Average internal boll temperature (oC) from continuous measurement (24 hours) 55
in the upper canopy, lower canopy, and data logger unit, September 15th.
14. Average internal boll temperature (oC) from continuous measurement (24 hours) 55
in the upper canopy, lower canopy, and data logger unit, September 16th.
Chapter II
1. Average boll size (mm) by temperature treatment. 76 2. Glucose concentration (mg/gDW) of bolls by temperature treatment. 78 3. Sucrose concentration (mg/gDW) of bolls by temperature treatment. 79 4. Fructose concentration (mg/gDW) of bolls by temperature treatment. 80 5. Starch concentration (mg/gDW) of bolls by temperature treatment. 81 6. Especially designed chamber for boll respiration measurements. 82
7. Internal boll temperature (oC) and internal unit temperature for the 83 stressed treatment chamber for first planting date.
8. Internal boll temperature (oC) and internal unit temperature for the 83
Appendix Chapter I
1. Both planting dates pooled data for prediction 67
of temperature inside the lower canopy by ambient air temperature.
2. Both planting dates pooled data for prediction of 67
temperature inside the lower canopy by soil temperature.
3. Raw data of 24 hours data logger recordings for September 15th, 2014. 68 4. Raw data of 24 hours data logger recordings for September 16th, 2014. 69
1
Introduction
Cotton (genus Gossypium) is a major industrial crop grown for its seed and fiber. Cotton plants are characterized by their perennial nature and indeterminate fruiting habit. Oosterhuis and Bourland (2001) reported a high year-to-year variability in cotton yields in the US, and
environmental factors have been indicated as one of the most relevant sources for the yield variability (Robertson, 2001). Plants are most sensitive to temperature stress during the reproductive stage, when pollination, pollen tube growth, and ovule fertilization occur. Additionally, higher than optimal temperatures during the reproductive stage in cotton caused lowered boll production, decreased boll size, and reduced boll retention (Robertson, 2001). The optimum temperature for cotton growth was reported to be 28+ 3oC (Burke and Wanjura, 2010). In Arkansas, the average daily maximum temperatures during flowering and boll development, mid-July to mid-August, normally exceed 35oC (Oosterhuis and Snider, 2011). Reduced yields under heat stress were reported by Oosterhuis (1997), who described a strong negative
correlation between cotton yield and high temperatures. Moreover, according to the
Intergovernmental Panel on Climate Change (IPCC) report (2007), a rise in air temperature of 0.2oC per decade is likely to occur under the expected scenario. This prediction implies a new challenge for scientists and growers, since increased temperatures may threaten crop productivity and lead to yield losses in the future (Oosterhuis, 2013; Bita and Gerats, 2013).
One of the principal problems with research in environmental stress physiology is that ambient temperatures are used to evaluate effects on yields, while there is evidence that actual temperatures in the canopy where bolls develop are different. Little is known about the effects that temperatures at different depths in the canopy may have on leaf and boll development, and
2
ultimately on yield. It is hypothesized that leaf, boll, and air temperatures within the canopy are better correlated with boll growth and yield than ambient air temperature.
Further, increasing nighttime temperatures were reported by Peng et al. (2004) as a result of global climate change. The authors stated that the annual minimum temperature, which occurs at nighttime, increased 3.2 times more than the maximum temperatures in a 25 years period (1979 to 2003) in the Philippines. This finding highlighted the importance of studying the effects of increasing night temperatures. Research on night temperatures on cotton has been performed measuring effects on leaf ATP and carbohydrates (Arevalo et al., 2008; Loka and Oosterhuis, 2010). However, there is limited knowledge about high day and night temperature effects on cotton boll growth and yield. It is hypothesized that high night temperatures cause an increase in boll respiration and loss of carbohydrates resulting in lower boll weights and decreased yields.
Review of Literature
General Characteristic and Cotton Physiology
Cotton belongs to the Malvaceae family, genus Gossypium. There are four domesticated species within this genus that are classified based on their origins, the New World allopolyploids
G. hirsutum and G. barbadense, and the Old World diploids G. arboretum and G. herbaceum
(Wendel et al., 2010). The specie Gossypium hirsutum is the predominant cotton grown worldwide, accounting for 90% of the world cotton crop (Brubaker et al., 1999).
Cotton is an important industrial crop cultivated mainly for its fiber and seed. Fiber is used for textiles and seeds are used for cooking oil and cattle feed. According to the United States Department of Agriculture (USDA) crop report (2013), 3,148,776hectares were harvested
3
in the U.S in 2013. In Arkansas, 236,740 hectares were harvested with a five year average lint yield of 1,013 kg/ha.
The cotton plant is reputed to have the most complicated growth habit of all major row crops, characterized by their perennial nature and indeterminate growth (Mauney, 1986). The cotton plant has two different types of branches: the vegetative, or monopodia, and the
reproductive, or sympodia. Additionally, two types of leaves can be identified within the cotton canopy: main-stem leaves, which are formed along the central axis, and sympodial or subtending leaves, which are formed in the base of the fruiting sites along fruiting branches. Both types of leaves differ in their contribution to growth and yield. Main-stem leaves are related to structural growth (Oosterhuis and Urwiler, 1988), while sympodial leaves, which are located closer to fruiting sites, are more associated with yield development (Ashley, 1972). At 120 days after planting, main–stem and sympodial leaves accounted for 40% and 60% of the total leaf area, respectively (Oosterhuis and Wullschleger, 1988). The number of nodes and length of internodes are affected by genotype and environmental conditions. In a favorable environment, a new node appears after an additional 50 to 60 degree days (DD60’s). Degree days are a heat unit concept that uses accumulative hours above a critical temperature instead of calendar days (Oosterhuis, 1990). Since cotton growth is minimal below 60oF (15.55oC), this temperature is considered as the threshold and degree days are expressed as DD60’s.
In contrast to the complicated morphology of cotton plants, their flowering sequence is unique yet predictable. Flowers are produced on the same branch about every 6 days, while producing a flower at the same relative position on a consecutive branch takes about 3 days. Although these intervals may have small variations with genotype and environment, they serve as a useful guide. Floral buds, called squares, start appearing about 4 weeks after planting
(mid-4
May to mid-June), followed a few weeks later by flowering and the beginning of boll
development (Oosterhuis, 1991). Fruit shedding is a common natural process on cotton plants which may be intensified by adverse environmental conditions (Guinn, 1982).
According to Oosterhuis (1990), cotton flowers are self-pollinated; however, some insect pollination may occur. Immediately after flowering, the stigma is receptive to pollen grains. Fertilization occurs in approximately 12 hours when pollen grains attach to the stigma, and generate a germ tube reaching the ovary. After fertilization, the ovary develops rapidly into the cotton boll following a sigmoid pattern, with the fastest growth occurring between 7 and 18 days. There are two main steps on fiber development: lengthening and thickening (DeLanghe, 1986). Lengthening refers to the lengthening of the fibers mainly due to cell turgor. Thickening of the fibers follows elongation, with some overlap, and occurs by the deposition of cellulose on the inner wall of the fiber cells. The final boll size is reached about 20 to 25 days after fertilization. During boll development, seed and lint formation take place leading to boll opening for
subsequent defoliation and harvesting.
Cotton bolls contain locules, which are small compartments or chambers within an ovary of the flower and fruits. Higher numbers of locules in cotton bolls can be translated into more seed and fiber production (Mandloi et al., 1991). Mandloi et al. (1991) reported that 4 to 5 locular bolls were in a 3:1 ratio in the middle and upper canopy while lower canopy bolls were predominantly 4 locular.
Besides its complex structure, cotton is extremely sensitive to environmental changes to which plants respond by modifying vegetative growth or fruit abscission (Oosterhuis and Stewart, 2004). Three major factors affect yield: genetics, cultural practices, and environmental
5
conditions. The first two factors can be highly influenced by producers; however environmental factors are difficult to control.
From an agronomic standpoint, the yield of cotton is expressed as the number of bolls per unit area and the weight of the bolls; however, lint is the main economic product and can be defined by two components: the number of seeds per unit area and the weight of the fibers produced by those seeds. Seeds per unit area depend on plants per unit area, bolls per plant and seeds per boll, while weight of fiber per seed depends on number of fibers per seed and average weight per fiber (Lewis and Bourland, 2000). Early leaf area development for maximizing light interception has been indicated as a relevant factor in determining higher yields (Oosterhuis and Stewart, 2004). Heat stress impacts yield by affecting one or more of these yield components described by Lewis and Bourland (2000). Furthermore, canopy microclimate, which results from the interaction of external climatic conditions and canopy density and structure, may also have a significant influence on cotton yields and fiber quality (Marois et al., 2004).
Cotton plants originate in semiarid environments and require warm days (Gipson, 1986), but that does not mean that yields peak under excessive high temperatures (Oosterhuis, 2002). According to Hodges et al. (1993), temperature is one of the most important factors affecting plant growth and development. For example, temperature controls the rate of plant growth, development, reproduction, and fruit maturation, and ultimately influences canopy temperature and the evaporative demand (Oosterhuis and Snider, 2011). According to Reddy et al. (1991b) cotton grown under supra-optimal and sub-optimal temperatures exhibited reduced growth, lower CO2 fixation, and limited sink strength. Similar studies determined that supra-optimal and
sub-optimal temperatures affected plant phenology, leaf expansion, and assimilate partitioning (Reddy et al., 1991a). Cotton has an optimal plant temperature of 28+ 3oC (Burke and Wanjura,
6
2010), while Bibi et al. (2008) suggested 33oC as the optimal temperature for photosynthesis. Burke et al. (1988) introduced the concept of thermal kinetic window (TKW), which is the optimal temperature for enzymatic activity. For cotton, the TKW was determined as ranging from 23.5oC to 32oC. Additionally, biomass production was positively correlated with the time the foliage was maintained in the range of the TKW temperatures. However, ideal temperatures may vary with the stage of plant development and the physiological process concerned (Reddy et al., 1991a).
Almost all plant processes are affected directly or indirectly by water supply (Kramer and Boyer, 1995). Water-deficit stress also impacts cotton growth and development, as reviewed by Loka and Oosterhuis (2011). Several consequences of drought stress have been reviewed by researchers, for example, reduced cell expansion due to less cell turgor, decreased transpiration due to stomatal closure and consequently increased leaf temperature (Hsiao, 1973; Kramer and Boyer, 1995), decreased photosynthetic rate (Chavez et al., 2002; Kramer and Boyer, 1995), and reduced crop yields (Loka and Oosterhuis, 2011; Jordan, 1986). In addition, water-deficit
conditions may exacerbate high temperature effects since during droughts evaporative cooling ceases and cotton leaves increase their temperature above the optimum for metabolic activity (Oosterhuis, 1997).
An adequate supply of nutrients is needed to support dry matter production. Nitrogen is the element accumulated in the largest quantities in cotton plants and its uptake depends on yield potential and growing conditions (Mullins and Burmester, 2010). Furthermore, soil physical and chemical properties such as sand content, exchangeable Ca2+ and Mg2+, soil pH, NO3- content,
Olsen-P, relative elevation, and slope influence cotton growth and response to stress (Ping et al., 2008). Total sunlight is also considered an important environmental factor. Aside from being
7
directly involved in photosynthesis, solar radiation affects growth and all crop processes in general (Reddy et al., 1996a).
Canopy Temperature and Microclimate
The interaction between crop canopies and the external environment alters the conditions within the canopy, resulting in light, temperature, humidity, and wind gradients (Sassenrath- Cole, 1995). Water loss from stomata causes evaporative cooling, which lowers canopy
temperature as long as the crop has an adequate water supply for stomatal opening and continued transpiration. According to Wise et al. (2004), substantial cooling in cotton plants is possible due to the large leaf size and the high stomatal conductance. Large leaves imply a reduced boundary layer, while high stomatal conductance allows elevated evaporation rates. In addition,
temperature within the canopy can be influenced by canopy microclimate.
In terms of microclimate in cotton canopy there is little information for the past fifty year (Jarman, 1959; Stanhill & Fuchs, 1968; Marois et al., 2004). Considering the effect of vegetation on air temperature, it is known that the temperature of a plant may differ from that of the
adjacent air either because it is being heated or cooled by radiation, evaporation, plant metabolic processes, or heat can be removed for photosynthesis (Jarman, 1959). Studies performed in soybean crops showed that air temperature profiles through the canopy are affected by water status, leaf orientation, and leaf pubescence (Baldocchi et al., 1983).In fact, in a well-watered planophile soybean canopy, air temperature increased with depth until a maximum in mid-canopy. On the other hand, within a water stressed erectophile soybean crop, air temperature profile was isothermal. In cotton crops, there is evidence that less dense canopies experience higher temperatures at the mid-canopy early in the growing season, although the comparison was performed between different canopies structures but not related to ambient air temperature
8
(Jarman 1959; Marois et al., 2004). Microclimate studies done in corn (Zea maiz L.) suggested that the upper canopy experience higher temperatures and lower water potential (Liu and Song, 2012). However, comparing temperature at mid-canopy for different plant height the authors concluded that the temperature is higher when the canopy is closer to the soil surface, in other words, shorter plants experienced high temperatures inside the canopy.
Marois et al., (2004) performed an experiment to determine the effect of ultra-narrow row on cotton canopy microclimate. Conventional row width crop, representing wider canopies, presented higher temperatures during the day; however, plant height was the factor with more influence upon temperature inside the canopy. Higher plant height presented lower temperatures and higher relative humidity inside the canopy. In other words, dense canopies can raise relative humidity and decrease temperature and air movement, resulting in a modified evaporative
potential of the canopy. As a result, canopy temperature at the top of the plant may not reflect the temperature that leaves and bolls are experiencing within the canopy.
The infrared thermometer can provide a dependable measure of canopy temperature in cotton plants (Jackson and Idso, 1969). Additionally, canopy temperature may be a useful
measure of plant water-stress and can be utilized for irrigation scheduling (Pahdi et al., 2012). In Pima cotton cultivars (Gossypium barbadense L.), Lu et al. (1994) showed a positive correlation between leaf cooling ability, stomatal conductance, and higher yields. In recent experiments, Pahdi et al. (2012) reported a significant negative correlation between canopy temperature and leaf water potential (increases from 4.7 to 5.2 °C in canopy temperature for every 1 MPa decrease in water potential). Accordingly, in plants experiencing water shortages, both transpiration and stomatal conductance decreased, causing growth reduction due to lower photosynthetic rates.
9
High leaf temperatures combined with low evaporative cooling cause heat stress. High temperature effects are more damaging for actively growing and hydrated tissues (Bita and Gerats, 2013). Heat stress negatively affects membranes, modifying their composition and structure, and causing leakage of ions. Also, heat stress affects metabolism by disturbing the stability of various proteins and the cytoskeleton. Additionally, when temperatures are above the temperature compensation point (temperature in which the amount of CO2 fixed is equal to the
amount of CO2 released by respiration), assimilates used in respiration cannot be replaced due to
decreased photosynthesis; thus carbohydrate content is lowered (Taiz and Zeiger, 2010). Although there has been extensive research on heat stress, mainly in growth chambers, the disadvantage is that stresses in nature do not commonly occur alone, rather multiple stresses occur simultaneously during a crop production cycle (Waraich et al., 2012). The severity of heat stress in plant growth and development depends on its intensity, duration, and rate at which the temperature increases (Hall, 2012). For cotton, the reproductive stage has been reported as the most sensitive to heat stress (Hedhly et al., 2009; Bita and Gerats, 2013).
Recent research by Gonias et al. (2010) has shown that the thermocouple thermometer is the most appropriate and accurate instrument for measuring temperature in developing cotton bolls. In this experiment, cotton bolls in the canopy were 5°C warmer than the ambient temperature during the day, but the differences decreased to 1°C in the night. The following equation was developed to predict internal boll temperature (BT) based on ambient temperature (AT): BT = 0.5298 x AT + 19.387 with R2=0.81.The authors tested thermocouple probe
measurements at 0.5 cm and 1 cm inside the boll which were not significantly different. According to Chu and Henneberry (1992), internal boll temperature data may be useful for studying growth and development of cotton seed and fiber quality parameters, and for
10
entomological research. Chu and Henneberry (1992) demonstrated that internal boll temperatures increased with increasing ambient air temperatures. Ambient air temperature 30 cm below the top of the canopy and temperatures on the top of the canopy accounted for 97.6 % and 96.3 % of internal boll temperature variation, respectively. The inclusion of vapor pressure (KPa) and solar radiation (Kw/m2) slightly increased the precision of the following equation:
Y = -2.305 + 0.638 X1 + 0.470 X2 – 0.598 X3 + 2.294 X4 (R2 = 0.98) where Y = Boll
Temperature, X1= ambient air temperatures at the top of the canopy, X2= ambient air
temperatures 30 cm below the top of the canopy, X3= vapor pressure (KPa), and X4= solar
radiation (KW/m2). These two experiments did not specify how temperature varies at different depths in the canopy where bolls are developing and how this is related to boll growth.
High Temperature Stress Effects
Growth and Yield
In the U.S. Cotton Belt, the average daily maximum temperatures during flowering and boll development normally exceed 35oC (Oosterhuis and Snider, 2011) combined with night temperatures above 23oC (Oosterhuis, 2002). In addition, the IPPC (2007) reported that an increase in the air temperature of 0.2oC per decade may take place under the anticipated greenhouse gas emissions (GHG) scenario. This issue needs to be addressed since increased temperatures can affect crop productivity and decrease yields (Oosterhuis and Snider, 2011; Bita and Gerats, 2013). Oosterhuis (1997) supported this in a study that showed a strong negative correlation between cotton yield and high temperatures during reproductive development, in which lower maximum temperatures were associated with higher yields. According to
11
CO2 concentration can stimulate photosynthesis and increase biomass production; however, this
will not necessarily be translated into higher yields due to the negative impacts of higher temperature in cotton reproductive development. Rising temperatures will expand the growing season, allowing double cropping and shifts in planting dates. Also, these conditions may support the future migration of cotton crops into more northern regions.
Leaf Development: Photosynthesis, Respiration, and Biomass Production
Photosynthesis, the conversion of solar energy to chemical energy, is a complex process affected by environmental factors such as light, CO2, temperature, soil moisture, and relative
humidity (Taiz and Zeiger, 2010). Photosynthesis uses Ribulose- 1,5 bisphosphate
carboxylase/oxygenase (rubisco) as the base enzyme for the transformation of inorganic carbon into organic compounds. Photosynthesis uses a small fraction of the radiation spectrum, called photosynthetic active radiation (PAR) which is comprised of the radiation between 400 and 700 nm wavelengths (Wells, 2011). The author stated that photosynthesis of individual cotton leaves (averaged okra and normal leaves) presented very little increase above a PAR of 1000 µmol photons/m2/s, while canopy photosynthetic rate was maximized at PAR of 1200 µmol photons/m2/s. On the other hand, full sunlight at noon in summer can reach 2000 µmol photons/m2/s.
According to Kobza and Edwards (1987), net photosynthetic rate increases as temperature increases, then reaches a maximum rate at optimum temperature, and finally decreases in supra-optimal temperatures. Temperature affects all biochemical reactions of
photosynthesis and the membrane integrity of chloroplasts (Taiz and Zeiger, 2010). Additionally, rubisco activity declines at elevated temperatures due to the effects of temperature on rubisco activase.
12
High temperatures during the day can raise photorespiration and reduce photosynthesis and carbohydrate production, while high night temperatures (above 23 - 24oC) cause an increase in respiration rates (Arevalo et al., 2008) and decrease in energy (ATP) levels (Loka and
Oosterhuis, 2010). Reddy et al. (1991a) reported detrimental effects of high temperature on growth and development. For example, cotton grown under elevated (40/30oC day/night) temperatures showed 50% less biomass production and a reduced internode length than plants grown within the optimal range. This was explained by a higher respiration rate and a greater rate of node formation, respectively. Similarly, comparing cotton grown under 40/30oC and 30/22oC day/night temperature, Reddy et al. (1992) reported that cotton grown under the high temperature regime showed a 50% reduction in leaf area, and the sensitivity of leaf area to temperature has been shown to increase sixteen days after emergence. Additionally, the authors reported smaller mature leaf size, reduced canopy size, and smaller individual leaves as
consequences of high temperatures. According to Wise et al. (2004), photosynthesis under heat stress can be inhibited by three main mechanisms: rubisco activity, ribulose-1,5-biphosphate (RuBP) regeneration rate (which relies on the photosynthetic electron transport chain), and triose phosphate metabolism. According to Taiz and Zeiger (2010), although enzymes activity is significantly reduced under elevated temperatures, it has been proved that the temperatures at which enzymes denature are higher than the temperatures at which photosynthesis start to
decline. Therefore, this shows the existence of an earlier stage of heat injury of photosynthesis. According to Schrader et al. (2004), photosynthesis is inhibited under high temperatures, which occur in natural conditions. Schrader et al. (2004) proposed two reasons to explain a decrease in photosynthesis: a reduced thylakoid membrane ionic conductance and ribulose-1-5-biphosphate carbolxylase/oxygenase (rubisco) deactivation. Research shows that photosynthesis
13
of cotton plants grown in growth chambers decreased significantly with temperatures above 36oC, showing a strong negative relationship between both parameters (Bibi et al., 2008). Schrader et al. (2004) reported that photosynthesis in cotton declined instantaneously when leaf temperature rapidly increased from 30 to 40oC. Additionally, in cotton and tobacco (Nicotiana rusitcum cv. Plumila) leaves, rubisco activation declined when leaves exceeded 35oC (Crafts-Brandner and Salvucci, 2000). The authors suggested that rubisco deactivation is the principal limitation for photosynthesis at moderate high temperatures. Sharkey (2005) supported this concept and stated that rubisco activase is heat sensitive and cannot maintain the demand of its activity at high temperature. Additionally, the author suggested that natural selection has favored plants in which rubisco deactivates at moderate high temperature due to the adverse ratio of photorespiration to photosynthesis at these temperatures, and also because rubisco deactivation could prevent severe damage, for example, to thylakoid structure. Similarly, Salvucci et al. (2001) showed that the rubisco activase was the principal protein that denatures in response to heat stress. The authors concluded that the loss of activase activity during heat stress was caused by a significant sensitivity of the protein to thermal denaturation. Rubisco deactivation can occur simultaneously with the effects of heat in thylakoid reactions (Sharkey, 2005). Pastenes and Horton (1996) described the short-term response of leaf photosynthesis to heat in beans (Phaseoulus vulgarus L.) grown in growth chambers. A reduction in photosynthesis occurred when temperatures reached 35oC.The authors suggested that moderate heat (35 to 45oC) causes the thylakoid membrane leakage and leads to cyclic electron transport.
Berry and Bjӧrkman (1980) indicated that the photosystem II is one of the most heat sensitive components in plants leaves. Similarly, in experiments performed in cotton, Bibi et al. (2008) showed that quantum yield efficiency of photosystem II decreased 49% and membrane
14
leakage increased significantly when air temperature increased from 30 to 40oC. Consequently, fluorescence and membrane leakage have been indicated as useful indicators of plants stress response. According to Hall (2012), deleterious effects of high temperatures on Photosystem II can be a consequence of the effect of high temperature on the membranes in which photosystem II is located. Supporting these results, measurements in leaves subtending the cotton bolls during anthesis have shown that high temperature (38/20oC) caused a decline in CO2 fixation by 16.8%
compared to optimal temperature (30/20oC) (Snider et al., 2009). In addition, the high temperature treatment caused an 11.3 % reduction in chlorophyll content, lowered quantum yield, and increased stomatal conductance by 57.1%. Similarly, in cotton grown under high temperature conditions, Radin and Mauney (1986) reported increases in stomatal conductance due to an apparent degradation of abscisic acid (ABA) and a rise in transpiration. On the contrary, Sharkey (2005) stated that there were significant effects of moderate heat stress on photosystem I and cytochrome complex reactions and there was no effect of these moderate high temperatures on photosystem II.
In Pima cotton, (G. barbadense L.), temperatures above 33oC limited photosynthesis, which declined 22% at 45oC (Wise et al., 2004). Three experiments in which photosynthesis was evaluated under high temperatures and various CO2 internal levels were performed in the field
and laboratory. Results of heat-stressed plants grown under different CO2 concentrations
confirmed that Ribulose-1,5 biphosphate (RuBP) regeneration, which reflects the electron transport chain, was the limiting factor for photosynthesis. This is because increased CO2 does
not remove the heat stress limitation, and therefore the inhibition lies, at least partially, in the electron transport chain. The authors concluded that rubisco activity is not the only factor affecting assimilation in the field, or after a rapid heating episode in the laboratory, and that
15
electron transport plays a predominant role in limitations to leaf photosynthesis following a heat stress event.
Boll Development
The reproductive stage of cotton is especially sensitive to heat stress (Oosterhuis and Snider, 2011). In cotton grown under a 40/30oC day/night temperature regime, Reddy et al. (1991a) observed a significantly lower boll production and less partitioning of assimilates into reproductive parts compared to plants grown in an optimal day/night temperature. This was explained by a slower growth and flower abortion or less flower formation. Similarly, Snider et al. (2011) suggested that higher than optimal temperatures in cotton caused a decrease in the pollen tube growth rate.
Oosterhuis (1997) suggested that high temperatures and reduced carbohydrate production can negatively affect the number of fiber per seed and the boll size. Cotton boll retention was reported by Zhao et al. (2005) and Reddy et al. (1999) as the most heat-stress sensitive
component. A strong decline in the retention of bolls and squares and a decrease in boll size in cotton grown in supra-optimal temperatures were reported by Hodges et al. (1993). Additionally, mature boll weight, which is an output of the rate of boll filling and the boll maturation period, was inversely related to temperature (Reddy et al., 1999). Zhao et al. (2005) suggested that the lower nonstructural carbohydrates concentration and the modification in carbohydrate
composition in developing floral buds and young bolls were fundamental factors in determining higher fruit abscission in heat-stressed cotton plants. According to Pettigrew (2008) the lower number of seeds per boll was the reason leading to a lint yield reduction caused by warmer temperatures. Lewis (2000) compared a cool year (1990, July average 32.2oC) with a hot year (1996, July average 36.6oC) in the Mid-south, and showed that the number of seeds decreased in
16
the hot year from 2.987 to 2.093 million seeds per hectare, which was related with a lower average number of seed per boll (23.6 versus 28 seeds per boll for the hot and cold year, respectively). Additionally, in a three year study, the author concluded that approximately 99% of the variability of number of seeds per boll between years was explained by changes in July mean maximum temperatures. These experiments explained the response of boll development and number of seeds per boll to elevated ambient air temperatures; however, the relationships between internal and external boll temperature and temperatures at different depth in the canopy with boll development have not been described yet.
Carbohydrates Content
The photosynthetic fixation of CO2 by most leaves produces sucrose and starch as end
products by two different pathways. Sucrose is the main carbohydrate exported from source to sink cells, while starch accumulates as granules in chloroplasts in order to assure some reserves to convert into sucrose during the night. The proportion allocated as sucrose or starch is strongly influenced by environmental factors such as day-length. Stem, roots, and young leaves utilize exported sugars as an energy source for grow (Taiz and Zeiger, 2010).
Studying the photosynthate translocation in cotton, Ashley (1972) showed that most of the photosynthates translocated to the bolls were from the immediately adjacent leaf, also called the subtending leaf, while some carbohydrates were supplied by bracts and leaves one node away from the boll. An experiment evaluating high temperature (36/28°C day/night) and different levels of UV radiation in cotton has shown that leaf non-structural carbohydrates (glucose, fructose, sucrose, and starch) composition and concentration are affected by temperature, while differences in leaf photosynthesis with the temperature regimes were not significant (Zhao et al.,
17
2005). Total non-structural carbohydrates decreased significantly in the high temperatures regime. It has been suggested that this decline in total leaf non-structural carbohydrate can be associated with dark respiration and phenolic compound synthesis.
Rufty et al. (1988) stated that nitrogen deficit caused a rapid adjustment in carbohydrate formation and utilization. They reported an increase in translocation of assimilates to the root followed by a decline in shoot-root ratio under nitrogen stress. In terms of carbohydrate composition, plants suffering nitrogen deficiency showed a decreased sucrose and increased starch content in leaves (Reddy et al., 1996b). Marschner (1986) also found that although dry matter of ryegrass (Lolium multiflorum L.) responded positively to increased nitrogen, a shift in carbohydrate content occurred, and lower nitrogen levels were related with increased starch contents. Similarly, non-inoculated and nitrogen-deprived soybean (Glycine max L.) were reported to increase starch concentration in leaves as a consequence of greater accumulation during the light (day) and limited starch degradation in darkness (Rufty et al. 1988). In contrast to Reddy et al. (1996b), Rufty et al. (1988) reported increases in sucrose concentration in soybean source and sink leaves under nitrogen stress.
Night Temperature Effect
Growth and Development
Field experiments with cotton showed that the increase in nighttime foliage temperature during reproductive stage significantly reduced vegetative dry matter production and fruit retention (Brown et al., 1995). Similarly, Zeiher et al. (1995) performed experiments in
controlled environments with elevated (28oC to 32oC) night temperature regimes during squaring and flowering. At 32oC night temperature, there were significant reductions in stem dry weight, plant height, and square dry weight compared to the control at 22oC night temperature. Similarly,
18
Glaubitz et al. (2014) reported a significant decrease in plant height in rice (Oryza sativa L.) cultivars sensitive to high night temperatures.
Peng et al. (2004) evaluated the effects of increasing night temperatures (from 1979 to 2003) on rice yields, and provided evidence of decreased yields from increased night
temperatures associated with global warming. Results showed that rice grain yield decreased by 10 percent for each 1oC increase in the minimum temperature (always related to night
temperature) during the growing season. Additionally, there was a significant negative relationship between minimum temperature and harvest index.
According to Hake et al. (1989) high night temperatures caused fruit shedding in cotton due to decreased pollen viability. More recent studies performed by Echer et al. (2014) in cotton grown in a growth chamber showed similar results. Treatments for this experiment consisted of: control 32/24oC (day/night),32/29oC for 3 weeks from the beginning of the first flower bud, and 32/29oC from the onset of the first flower. Increased night temperatures from 24oC to 29oC during the floral bud and flowering stages increased the rate of flower production per plant (54% and 27 %, respectively, compared to the control) but also caused higher abortion rates (51% and 25%, respectively, compared to the control). High night temperatures during flowering stage reduced the number of seed per locule and the number of seeds per boll. Furthermore, the
number of bolls and pollen viability decreased in plants exposed to high night temperatures from the beginning of the flower bud stage. The reduction in the number of bolls was explained by the higher rate of abortion of older structures. The authors concluded that cotton is most sensitive to high night temperatures at floral bud stage.
19
Carbohydrates
Long term (two weeks) exposure to high night temperatures (28oC) substantially
decreased sucrose and hexose content in cotton leaves due to an increased respiration rate (Loka and Oosterhuis, 2010). Similarly, rice plants were grown in three different night temperatures (17oC, 22oC, 27oC) for 63 days where biomass production and plant morphology in vegetative growth were examined (Kanno et al., 2009). The authors reported a decline in sucrose and starch of leaves blades of plants grown in 27oC night temperature.
In cotton grown in high temperatures, Zaho et al. (2005) reported that the percentage of square abscission was mainly correlated with nonstructural carbohydrate content in the floral buds, while young boll abscission was also correlated with leaf and boll nonstructural
carbohydrates content. Echer at al. (2014) showed that high night temperatures for 3 weeks from the beginning of the floral bud stage caused a 29% reduction in sucrose content of flowers compared to the control. Snider at al. (2011) reported that soluble carbohydrates in pistil of heat-stressed cotton plants declined as much as 67.5%, and that pistil soluble carbohydrate content was highly correlated with pollen tube growth rate.
Glaubitz et al. (2014) evaluated differential responses of rice (Oryza sativa L.) to high night temperatures (28oC) starting at the vegetative stage, 25 days after planting (DAP). Results showed that monosaccharide and starch concentration of leaves increased after 16 days of high night temperatures, while sucrose was not affected.
20
Adenosine Tri-Phosphate (ATP)
Adenosine triphosphate (ATP) is the principal carrier of chemical energy in the cell. ATP is synthetized in the thylakoids membrane reactions during photosynthesis and in the inner mithocondrial membrane during cell respiration, processes called photophosphorylation and oxidative phosphorylation, respectively (Taiz and Zeiger, 2010).
Loka and Oosterhuis (2010) evaluated the short term (24oC, 27oC, and 30oC of night temperatures for 2 hours) and long term (30/20oC and 30/28oC day/night temperatures for 4 weeks) effects of different night temperatures on ATP levels in cotton leaves. For the short term, leaf ATP levels declined by 22.5% and 30% compared to the control at 27oC and 30oC night temperature, respectively. For the long term treatment, ATP levels significantly declined by 27%, 38%, and 37% for the first, second, and fourth week, respectively, for cotton grown at 28oC night temperature, compared to plants grown under 30/20oC regime.
Reactive Oxygen Species (ROS) and Heat Stress Proteins
Under heat stress, plants cells produce partially reduced forms of atmospheric oxygen called Reactive Oxygen Species (ROS), which can cause cell oxidative damage (Mittler, 2002). The author stated that ROS are considered cellular stress indicators and signaling compounds. According to Allakhverdiev et al. (2008), ROS produced at high temperatures can be superoxide radicals, hydroxyl radicals, and hydroxide peroxide. Other compounds, such as polyamines, which are important determining flower and seed induction, have been reported to decrease at elevated temperatures (Oosterhuis and Snider, 2011).
21
The synthesis of heat stress proteins was reported by Burke et al. (1985). The comparison of polypeptide patterns between control and heat shocked leaves showed a reduction in normal protein synthesis and increased heat stress protein (HSPs), and at least 12 newly synthetized proteins were reported in the heat-stressed sample. According to Baniwal et al. (2004), the transcription of heat stress proteins encoding genes is controlled by regulatory proteins called heat stress transcription factors (Hsfs). Eisenhardt (2013) stated that one response to high temperature within the cell is the synthesis of small heat shock proteins (sHSPs) which are able to bind to thermally unstable proteins in an ATP independent manner.
References
Ashley, D. A. 1972. 14C-labelled photosynthate translocation and utilization in cotton plants. Crop Sci. 12: 69-74.
Allakhverdiev, S.I.,V.D Kreslavski, V.V. Klimov, D.A. Los, R. Carpentier, P. Mohanty. 2008 Heat stress: an overview of molecular responses in photosynthesis. Phot. Res. 98: 541–550
Arevalo, L.S., D.M. Oosterhuis, D. Coker, and R.S. Brown. 2008. Physiological response of cotton to high night temperature. Amer.J.Plant.Sci.Biotechnol.2:63-68.
Baniwal, S.K., K. Bharti, C. KwanYu, M. Fauth, A. Ganguli, S. Kotak, S.K. Mishra, L. Nover, M. Port, K.D. Scharf, J. Tripp, C. Weber, D. Zielinski, and P.V. Koskull-Döring. 2004. Heat stress response in plants: A complex game with chaperones and more than twenty heat stress transcription factors. J. Biosci. 29:471-487.
Baldocchi, D., Rosenberg, N., & Verma, S. 1983. Microclimate in the soybean canopy. Agr. Met. 28: 321-337.
Berry, J. and O. Bjorkman. 1980. Photosynthetic response and adaptation to temperature in higher plants. Annu. Rev. Plant Physiol. 31:491-543.
Bibi, A.C., E.D. Gonias, and D.M. Oosterhuis. 2008. Photosynthesis, quantum yield of photosystem II and membrane leakage as affected by high temperatures in cotton genotypes. J. Cotton Sci. 12: 150-159.
22
Bita, C.E., and T. Gerats. 2013. Plant tolerance to high temperature in a changing environment: Scientific fundamentals and production of heat stress-tolerant crops. Front.Plant Sci. 4:1-18.
Brown, P.W., C.A. Zeiher, and J.C. Silvertooth.1995. Response of upland cotton to elevated night temperatures I. p. 1129. In Proc. Beltwide Cotton Conf., San Antonio, TX. 4-7 Jan.1995. National Cotton Council, Memphis, TN.
Brubaker, C.L., F.M Bourland, and J.E. Wendel. 1999. The origin and domestication of cotton. p. 3-31. In CW Smith, TJ Cohen (ed.) Cotton: Origin, history, technology, and production. John Wiley and Sons, Inc., New York.
Burke, J.J., J.R. Mahan, and J.L. Hatfield.1988. Crop-specific thermal kinetic windows in relation to wheat and cotton biomass production. Agronomy J. 80:553-556.
Burke, J.J., and F.D Wanjura. 2010. Plant responses to temperature extremes. p.123-128. In J. M. D. Stewart et al. (ed.) Physiology of cotton. Dordrecht Springer, New York.
Chavez, M. M., J.S. Pereira, J. J Maroco, M. L Rodriguez, C. P. Ricardo, M. L. Osorio, and C. C Pinheiro. 2002. How plants cope with water stress in the field? Photosynthesis and growth. Ann. Bot. 89:907-916.
Chu, C.C., and T.J. Henneberry. 1992. Internal cotton boll temperatures and weather data relationships. p.1031-1033. In Proc. Beltwide Cotton Conf., Nashville, TN. 9-12 Jan.1992. National Cotton Council, Memphis, TN.
Crafts-Brandner, S. and M.E. Salvucci. 2000. Rubisco activase constrains the photosynthetic potential of leaves at high temperature and CO2. Proc. Natl. Acad. Sci. USA 97:13430-13435.
Echer, F.R., D.M. Oosterhuis, D.A. Loka, and C.A. Rosolem. 2014. High night temperatures during the floral bud stage increase the abscission of reproductive structures in cotton. J. Agron. Crop Sci. 200:191-198.
Eisenhardt, B.D. 2013. Small heat shock proteins: Recent developments. Biom. Con. 4:583-595. Gipson, R.J. 1986. Temperature effects on growth, development and fiber properties. p. 47-56.
In R.J Mauney and J.M.D Stewart (ed.) Cotton physiology. Cotton foundation, Memphis, TN.
23
Glaubitz, U., X. Li, K.I. Köhl, D.T. Van, D.K. Hincha, and E. Zuther. 2014. Differential physiological responses of different rice (Oryza sativa) cultivars to elevated night temperature during vegetative growth. Funct. Plant Biol. 41: 437-448.
Gonias, E.D., D.M. Oosterhuis, and A.C. Bibi. 2010. Measurement of internal temperature of cotton bolls. Am. J. Plant Sci. Biotech. 4:97-100.
Guinn, G. 1982. Causes of square and boll shedding in cotton. USDA-ARS.Tech. Bull. 1672.
Hall, A.E. 2012. Heat stress. p 218-131. In S. Shabala (ed.) Plant stress physiology. Cambridge, MA.
Hake, K., G. Guinn, and D. Oosterhuis. 1989. Environmental causes of shed. Newsletter of the Cotton Physiology Education Program – National Cotton Council.
http://www.cotton.org/tech/physiology/cpt/plantphysiology/upload/CPT-Dec89-REPOP.pdf (verified 29 Oct.2014).
Hedhly, A., J.I. Hormaza, and M. Herrero. 2009. Global warming and sexual plant reproduction. Trends Plant Sci. 14:30-36.
Hodges, H.F., V.R. Reddy, J.M. McKinion, and K.R. Reddy. 1993. Temperature effects on cotton. MAFES. Bulletin 990. Mississipi State, MS.
Hsiao, T.C. 1973. Plant responses to water stress. Annu. Rev. Plant Physiol. 24: 519-570.
Intergovernmental Panel on Climate Change (IPPC). 2007. Climate Change 2007: Working Group I: The physical science basis (online)
http://www.ipcc.ch/publications_and_data/ar4/wg1/en /spmsspm-projections-of.html(verified 26 Oct. 2014).
Jackson, R.D., and S.B. Idso. 1969. Ambient temperature effects in infrared thermometry. Agron. J. 61:324-325.
Jarman, R.T. 1959. The microclimate in stands of irrigated cotton (Gossypium barbadense). J. Ecol. 47:499-510.
Jordan, R.W.1986. Water deficit and reproduction. p.66-78. In R.J. Mauney and J.M.D. Stewart (ed.) Cotton physiology. Cotton Foundation, Memphis,TN.
24
Kanno, K., T. Mae, and A. Makino. 2009. High night temperature stimulates photosynthesis, biomass production and growth during the vegetative stage of rice plants. Soil Sci. Plant Nutr. 55:124-131.
Kramer, P.J., and J.S. Boyer. 1995. Water relations of plants and soils. Academic Press, San Diego.
Kobza, J., and G.E. Edwards. 1987. Influences of leaf temperature on photosynthetic carbon metabolism in wheat. Plant Physiol. 83:69-74.
Lewis, H.F.2000. Environmental regulation of yield and quality components in American upland cotton. p.8-36. In Proc. Conference Genetic Control of Fiber and Seed Quality. San
Antonio, TX. 5-6 Jan. 2000. Cotton Incorporated, Cary, NC.
Lewis, H.F., and L. Bourland. 2000. Cotton yield components and yield stability. p.532-536. In
Proc. Beltwide Cotton Conf., San Antonio, TX. 4-8 Jan. 2000. National Cotton Council, Memphis, TN.
Liu, T. and F. Song. 2012. Maize photosynthesis and microclimate within the canopies at grain-filling stage in response to narrow-wide row planting patterns. Photosynthetica 50:215-222.
Loka, D.A., and D.M. Oosterhuis. 2011. Water stress and reproductive development in cotton. p. 51- 55. In D.M Oosterhuis (ed.) Flowering and fruiting in cotton. Cotton Foundation, Memphis, TN.
Loka, D.A. and D.M. Oosterhuis. 2010. Effect of high night temperatures on cotton respiration, ATP levels, and carbohydrate content. Environ. Exp. Bot. 68:258-263.
Lu, Z., J.W. Radin, E.L. Turcotte, R. Percy, and E. Zeiger. 1994. High yields in advanced lines of pima cotton are associated with higher stomatal conductance, reduced leaf area and lower leaf temperature. Physiol. Plant. 92:266-272.
Marois, J.J., D.L. Wright, P.J. Wiatrak, and M.A. Vargas. 2004. Effect of row width and nitrogen on cotton morphology and canopy microclimate. Crop Sci. 44:870-877.
Mandloi, K.C., D. Khare and G.K. Koutu. 1991. Instability of boll locule number in cotton. Res. Dev. Rep. 8:120-124.
25
Marschner, H. 1986. Mineral nutrition of higher plants. 2nd ed. Academic Press, London.
Mauney, R.J.1986. Vegetative growth and development of fruiting sites.p.11-28. In R.J. Mauney and J.M.D. Stewart (ed.) Cotton physiology. Cotton Foundation. Memphis,TN.
Mittler, R. 2002. Oxidative stress, antioxidants and stress tolerance. Trends Plant Sci. 7:405-410.
Mullins, G.L. and C.H. Burmester. 2010. Mineral nutrition. p. 97-105. In J. M.D. Stewart et al. (ed.) Physiology of cotton. Springer Science+Business Media, New York.
Oosterhuis, D.M. 1990. Growth and development of the cotton plant.p.1-24. In W.N. Miley and D.M. Oosterhuis (ed.) Nitrogen nutrition in cotton: Practical Issues. Proc. Southern Branch Workshop for Practicing Agronomists. Little Rock, AR. 7 Feb. 1990. Amer. Soc. Agron. Madison, WI.
Oosterhuis, D.M. 1991. Growth and development of a cotton plant. University of Arkansas, Cooperative Extension Service. MP 332.
Oosterhuis, D.M. 1997. Effects of temperature extremes on cotton yields in Arkansas. p.94-98.
In D.M Oosterhuis (ed.) Proc. Cotton Res. Meeting and Summary Cotton Res., Monticello, AR.3 Feb.1997. University of Arkansas Agricultural Experiment Station, Fayetteville, AR.
Oosterhuis, D.M. 2002. Day or night high temperature: A major cause of yield variability. Cotton Grower 46:8–9.
Oosterhuis, D.M.2013. Global warming and cotton productivity. International Cotton Advisory Committee 72nd Plenary Meeting, Cartagena, Colombia.29 Sept. -4 Oct. 2013. (online) ICAC:https://www.icac.org/getattachment/mtgs/Plenary/72nd-Plenary/Presentations/Pap-DOosterhuis_GWarming.pdf (verified 23 May 2015)
Oosterhuis DM, and F.M. Bourland. 2001. Development of the cotton plant. p. 3–7. In T.L. Kirkpatrick and C.S. Rothrock (ed.).Compendium of Cotton Diseases. St. Paul, Minnesota. 2001. The American Phytopathological Society.
Oosterhuis, D.M., and J.M.D. Stewart. 2004. Yield and environmental adaptation in cotton. p. 363-401. In A. Blum, and H.T. Nguyen (ed.)Physiology and biotechnology integration for plant breeding. Marcel Dekker, New York.
26
Oosterhuis, D.M., and J.L. Snider. 2011. High temperature stress on floral development and yield of cotton.p. 3-24. In D.M Oosterhuis (ed.) Stress physiology in cotton. Cotton Foundation, Memphis, TN.
Oosterhuis, D.M., and M.J. Urwiler. 1988. Cotton main-stem leaves in relation to vegetative development and yield. Agron. J. 80:65-67.
Oosterhuis, D.M., and Wullschleger. S.D. 1988. Cotton leaf area distribution in relation to yield development. p.82-84. In Proc.Beltwide Cotton Physiol. Res. Conf., New Orleans, LA.3-8 Jan. 1988.National Cotton Council of America, Memphis, TN.
Pastenes, C. and P. Horton. 1996. Effect of high temperature on photosynthesis in beans. I. oxygen evolution and chlorophyll fluorescence. Plant Physiol. 112:1245-1251.
Peng, S., J. Huang, J.E. Sheehy, R.C. Laza, R.M. Visperas, X. Zhong, G.S. Centeno, G.S. Khush, and K.G. Cassman. 2004. Rice yields decline with higher night temperature from global warming. Proc. Natl. Acad. Sci. USA. 101:9971-9975.
Pettigrew, W. T. 2008. The effect of higher temperatures on cotton lint yield production and fiber Quality. Crop Sci. 48:278–285.
Ping, J.L., C.J. Green, R.E. Zartman, K.F. Bronson, and T.F. Morris. 2008. Spatial variability of soil properties, cotton yield, and quality in a production field. Commun. Soil Sci. Plant Anal. 39: 1-16.
Radin, J.W., and J.R Mauney.1986. The nitrogen stress syndrome. p. 91-105. In: J.R Mauney, and J.M.D Stewart (ed.) Cotton physiology. Cotton Foundation, Memphis, TN.
Reddy, K.R., H.F. Hodges, and V.R. Reddy. 1992. Temperature effects on early season cotton growth and development. Agron. J. 84:229-237.
Reddy, K.R., H. F.Hodges, W.H., McCarty, & J.M. McKinion. 1996a. Weather and cotton growth: present and future. Bulletin 1062.Missisipi State, MS
Reddy, R.K., J.M. McKinion, and H.F. Hodges. 1996b. Can cotton crops be sustained in future climates? . p.1189-1196. In Proc. Beltwide Cotton Conf., Nashville, TN.9-12 Jan. 1996. National Cotton Council, Memphis, TN.
27
Reddy, V.R., D.N. Baker, and K.R. Reddy. 1991a. Temperature effect on growth and development of cotton during the fruiting period. Agron. J. 83: 211-217.
Reddy, V.R., H.F. Hodges, and D.N. Baker. 1991b. Temperature effects on cotton canopy growth, photosynthesis, and respiration. Agron. J. 83: 699-704.
Reddy, K.R., B.T. Vinyard, A.S. Johnson, and G.H. Davidonis. 1999. Temperature regime and carbon dioxide enrichment alter cotton boll development and fiber properties. Agron. J. 91:851-858.
Robertson, W.C. 2001. Yield variability problem. p. 5-7. In D.M Oosterhuis (ed.) Proc. Cotton Res. Meeting and Summary Cotton Res. 2001.University of Arkansas Agricultural Experiment Station, Fayetteville, AR.
Rufty, T.W.J., R.J. Volk, and S.C. Huber. 1988. Alterations in leaf carbohydrate metabolism in response to nitrogen stress. Plant Physiol. 88:725-730.
Salvucci, M.E., K.W. Osteryoung, S. Crafts-Brandner and E. Vierling. 2001. Exceptional sensitivity of rubisco activase to thermal denaturation in vitro and in vivo. Plant Physiol. 127:1053-1064.
Sassenrath-Cole, G.F. 1995. Dependence of canopy light distribution on leaf and canopy structure for two cotton (Gossypium) species. Agric. For. Meteor. 77: 55-72.
Schrader, S.M., R.R. Wise, W.F. Wacholtz, D.R. Ort, and T.D. Sharkey. 2004. Thylakoid membrane responses to moderately high leaf temperature in pima cotton. Plant Cell Environ. 27:725-735.
Sharkey, T.D. 2005. Effects of moderate heat stress on photosynthesis: Importance of thylakoid reactions, rubisco deactivation, reactive oxygen species, and thermotolerance provided by isoprene. Plant Cell Environ. 28:269-277.
Snider, J. L., D. M. Oosterhuis, B. W. Skulman, and E. M. Kawakami. 2009. Heat stress-induced limitations to reproductive success in Gossypium hirsutum. Physiol. Plant. 137: 125-138.
Snider, J. L., D. M. Oosterhuis, D.A. Loka, and E. M. Kawakami.2011. High temperature limits in vivo pollen tube growth rates by aktering diurnal carbohydrate balance in field-grown
28
Stanhill, G., and M. Fuchs. 1968. The climate of the cotton crop: physical characteristics and microclimate relationships. Agric. Met. 5:183-202.
Taiz, L. and E. Zeiger. 2010. Plant physiology. Sinauer Associates, Massachusetts.
USDA.2013. Crop production report.(online) http://www.usda.gov/nass/PUBS/TODAYRPT/ crop1113.pdf (verified 13 Sep.2014).
Waraich, E.A., R. Ahmad, A. Halim, and T. Aziz. 2012. Alleviation of temperature stress by nutrient management in crop plants: A review. J. Soil Sc. and Plant Nutr. 12:221-244.
Wendel, J.F., C.L. Brubaker, and T. Seelanan. 2010. The origin and evolution of Gossypium. In
J.M.D. Stewart et al. (ed.) Physiology of cotton. Springer Science+Business Media, New York.
Wells, R. 2011. Light and the cotton plant. p. 73-83. In D.M Oosterhuis (ed.) Stress physiology in cotton. Cotton Foundation, Memphis, TN.
Wise, R.R., A.J. Olson, S.M. Schrader, and T.D. Sharkey. 2004. Electron transport is the functional limitation of photosynthesis in field-grown pima cotton plants at high temperature. Plant Cell Environ. 27:717-724.
Zeiher, C., N. Matumba, P. Brown, and J. Silverthooth.1995. Response of upland cotton to elevated night temperatures II. Results of controlled environments Vol.2.p.1129. In Proc. Beltwide Cotton Conf., San Antonio, TX.4-7 Jan.1995. National Cotton Council, Memphis, TN.
Zhao, D., K. Reddy, V. Kakani, S. Koti, and W.Gao. 2005. Physiological causes of cotton fruit abscission under conditions of high temperature and enhanced ultraviolet-B radiation. Physiol. Plant. 124: 189-199.
29
CHAPTER 1
Temperature Gradients in the Cotton Canopy and the Influence on Boll Growth Abstract
Temperature is one of the most important factors affecting cotton boll growth. Cotton’s optimal temperature has been established at 28oC measured at the top of the canopy. In environmental stress physiology, ambient air temperature is employed to characterize a stress and its effects on yields; however, temperatures in the canopy where bolls develop are different. A field
experiment was carried out in Fayetteville, AR during the summer of 2014 with the objective to determine the existence of a vertical temperature gradient and its potential effects upon boll growth. The cotton (Gossypium hirsutum L.) cultivar DP0912B2RF was planted in two planting dates: May 20th and June 4th, 2014. Weekly measurements were performed at noon, beginning one week after first flower. Temperature measurements were recorded using thermocouple thermometers at both lower canopy (main-stem node 7±1) and upper canopy (main-stem node 11±1) positions, and included internal boll, air next to the boll, ambient air above the canopy, subtending leaf, and soil temperatures. Subtending leaf photosynthesis, relative humidity (%) and wind (m/s) were also recorded. Ambient conditions from the closest weather station were
recorded for the entire growing season. For the first planting date, air inside the canopy for both canopy positions, was significantly (P< 0.05) warmer than ambient air in the first, second, and third weeks after first flower. Both canopy positions, upper and lower did not present differences between the ambient air and the air inside the canopy for the 4th and 5th weeks after first flower, respectively. This suggests the existence of a vertical gradient early in the reproductive
development, and may indicate that denser canopies reduce the temperature gradient, producing a more stable air profile.
30
Introduction
Temperature strongly determines cotton leaf and boll growth. Supra-optimal and sub-optimal temperatures may cause reduced growth, decreased photosynthetic rate, and affect leaf expansion (Reddy et al., 1991). Optimal temperature for cotton growth has been reported to be 28+ 3oC measured at the top of the canopy (Burke and Wanjura, 2010). In Arkansas, cotton usually experiences high temperature stress, which is more harmful during reproductive
development (Oosterhuis, 1997; Zeiher et al, 1995). Higher than optimal temperatures have been reported to cause significant reduction in yield due to decreased boll production, boll size, and boll retention (Oosterhuis, 1997; Zhao et al., 2005). Additionally, a decrease in pollen tube growth and fertilization were reported (Snider et al., 2011).
Ambient air temperatures or temperatures at the top of the canopy are used to
characterize a stress; however, there is evidence that actual temperatures where bolls develop are different from ambient temperature (Jarman, 1959; Marois et al., 2004; Gonias et al., 2010). In terms of microclimate in cotton there has been little new information in the past 50 years. Recent research by Gonias et al. (2010) indicated higher internal boll temperatures compared to the ambient air at midday. Other studies compared temperature inside the canopy for different
canopy structures and concluded that less dense canopies experience higher temperatures early in the growing season (Marois et al., 2004). Temperature gradients studies performed in corn (Zea maiz L.) suggested that upper canopy experiences higher temperatures and that vertical
temperature gradient decreases with plant height (Liu and Song, 2010).
Temperature gradient within the cotton canopy and its possible impact on boll
31
there is a vertical temperature gradient through the cotton canopy. Additionally, it is
hypothesized that ambient temperature may not be a true representative of what bolls and leaves are experiencing within the canopy since the interaction between the crop and the external environment alters the conditions within the canopy, resulting in light, temperature, humidity, and wind gradients (Sassenrath- Cole, 1995). With the aim of addressing these problems, a field experiment was performed for characterizing vertical temperature gradients and their potential effect on cotton boll growth and determining if ambient air temperature is a valuable indicator of the temperature inside the canopy. Continuous measurements of internal boll temperature during 24 hours were also performed. According to Gonias et al. (2010), although it is important to record internal boll temperature to understand the potential effect of high temperatures during summer upon reproductive units, the research done in this area is limited.
Objectives
The main objective was to determine and characterize the potential vertical gradients of temperature within the cotton canopy and its possible impact on boll development and yield. The second objective was to analyze if ambient air temperature is an appropriate indicator of what the plant is experiencing inside the canopy.
Hypotheses
It is hypothesized that that there is a vertical temperature gradient through the cotton canopy and that ambient temperature may not be representative of what bolls are experiencing within the canopy.