Performance of IEEE 802.15.4 in WSN for Monitoring
Performance of IEEE 802.15.4 in WSN for Monitoring
Performance of IEEE 802.15.4 in WSN for Monitoring
Performance of IEEE 802.15.4 in WSN for Monitoring
Real Time Air Pollution Parameters
Real Time Air Pollution Parameters
Real Time Air Pollution Parameters
Real Time Air Pollution Parameters
1
Darshana N. Tambe, 2 Nekita A. Chavhan
1
Wireless Communication & Computing, Department of Computer Science & Engineering, G.H. Raisoni College of Engineering,
Nagpur, India.
2
Department of Computer Science & Engineering, G. H. Raisoni College of Engineering, Nagpur, India
Abstract
In environmental parameters the air pollution is measure by taking one or few samples in a day that means there is no information present about the real time air pollution data. This is the main disadvantages of such system. Most of the countries in the world work on the real time bases to monitor the air quality. In this paper we describe use of ZigBee, sensor nodes, GPS to construct distributed system for urban air pollution monitoring and control. ZigBee module and pollution server is interfaced with GPS system to display real-time pollutants levels and there location on a 24h/7 days basis. The system was successfully tested in the G.H. Raisoni College of Engineering, Nagpur, India
Keywords: ZigBee Sensor Node, Air Pollution, GPS, Environmental Pollution, Real Time.
1. Introduction
With fast development of the industrialization and urbanization process in the world, environmental pollution problems become more common. At present environment contains air pollution, water pollution and soil pollution worldwide. Air pollution is the presence of contaminants or pollutant substances in the air that interfere with human health or welfare, or produce other harmful environmental effects. The World Health Organization states that 2.4 million people die each year because of polluted air. Based on the fact above mentioned, the human should focus on designing air pollution monitoring system. Pure air and human health goes Hand in Hand. Air pollution is harmful for human Health. It causes difficulty in breathing, wheezing,
coughing and many respiratory problems. Currently there are two methods to monitor air pollution
at present. First one is non automatic and other is automatic.
The advantages of non automatic sampling method are monitoring devices is simple and inexpensive but it
monitors the parameters for certain period. It does not provide the real time monitoring. While the non automatic sampling method provides the real time monitoring of harmful substances in the air. The non automatic sampling method uses the sensors to monitor the parameters, and send the data to central control center.. That’s why wireless sensor network have been rapidly developed. The wireless sensor network has many advantages application in military and industries. Many air pollution systems which monitor air pollute on due to hazardous health problems of this the government of Tiwan use various air quality monitoring systems [1]. In this they use MAC medium access control protocol for monitoring air quality in wireless sensor network. Khunarak et al. proposed E-nose electronic nose architecture for real time monitoring of indoor chemical polluted materials such as CO, NO2. These chemical materials are highly toxic and cause respiratory failure [2]. The ARIMA prediction model is used to monitor air quality in wireless sensor network. The ARIMA model predicts the carbon dioxide level in the air in [3]. A conceptual framework for the deployment of wireless sensor network for environment monitoring of Bangalore urban city is proposed in [4]. An outdoor air pollution monitoring system which uses ZigBee networks for monitoring air pollution in ubiquitous cities was reported in [5]. This system integrates wireless sensor board and CO2 sensors which also integrates with the dust, temperature and humidity and ZigBee module. In China, Zhang Qian et al. compared the advantages of ZigBee with Wi-Fi and Bluetooth and give a wireless solution based on ZigBee technology for greenhouse monitoring [6]. Although some authors use ZigBee to monitor air pollution, its application in air pollution monitoring stay little. The exploitation of the technology of the wireless sensor network and ZigBee module, focusing on the air pollution monitoring system.
The air pollution means presence of one or more contaminants for temporal duration that can become injurious to human life, vegetable, and animal. The air contaminants include smokes, gases, dusts, paper hashes, poisonous chemical products and many polluted materials.
Certain polluted materials react with each other and produces other pollutants. These pollutants called as secondary pollutants. Carbon monoxide and nitrogen dioxide produced by automobiles motors, lead to the development of ozone.
Air pollution has consequences for human health. It causes respiratory problems and even death. It also contributes the acid rain and reduction of ozone layer. The proposed system is able to measuring the following gases in the environment.
• Carbon Dioxide (CO2) – Carbon Dioxide is a gas essential to life in the planet, because it is one of the most important elements evolving photosynthesis process, which converts solar into chemical energy. The concentration of CO2 has increased due mainly to massive fossil fuels burning. This increase makes plants grow rapidly. The rapid growth of undesirable plants leads to the increase use of chemicals to eliminate them.
• Sulphur Dioxide (SO2) – Sulphur Dioxide is a colorless gas, detectable by the distinct odor and taste. Like CO2, it is mainly due to fossil fuels burning and to industrial processes. In high concentrations may cause respiratory problems, especially in sensitive groups, like asthmatics. It contributes to acid rains.
• Nitrogen Dioxide (NO2) – Nitrogen Dioxide is a brownish gas, easily detectable for its odor, very corrosive and highly oxidant. It is produced as the result of fossil fuels burning. Usually NO thrown to the atmosphere is converted in NO2 by chemical processes. In high concentrations, NO2 may lead to respiratory problems. Like SO2, it contributes to acid rains.
3. Zigbee Standard
The ZigBee is the small range, low power, and low data rate wireless networking technology for many wireless applications. It is present at the bottom three layers i.e. physical, data link, and network layer. This is the recently published IEEE 802.15.4 standards for personal area
technology developed as an open global standard to address the unique needs of low-cost, low-power, wireless sensor networks.
Fig 1: ZigBee Architecture
ZigBee network layer supports star, mesh and tree topologies. The ZigBee coordinator is responsible for initiating and maintaining the devices present in the network and other end devices directly communicate with the ZigBee coordinator.
Fig 2: Topologies for ZigBee
The IEEE 802.15.4 (ZigBee) standard provides three frequency bands for operation: these are 868MHz, 916MHz, and 2.4GHz for ZigBee. 868MHz band used in only Europe and has the 20Kbps data rate of transmission and contain only one channel with BPSK modulation technique. 916MHz band is used in Americas having the 40Kbps data rate of transmission and contain 10 channels with BPSK modulation technique. 2.4GHz frequency bands used throughout the world because of ISM (Industrial, Scientific, Medical) band. It has 250Kbps data rate of transmission and 16 channels with O-QPSK modulation technique.
Fig 3: Frequency bands for ZigBee
Transmission distance is within the range from 30 meters in an indoor non-line of sight of environment and 100 meters in line of sight environment. The range problem can be solved by using various routing algorithms at the network layer.
4. Hardware Architecture
The proposed system is designed by integrating the following hardware modules as shown in figure.
Fig 4: Data Acquisition Unit
Fig 5: Pollution Server 4.1 H/W Block Diagram
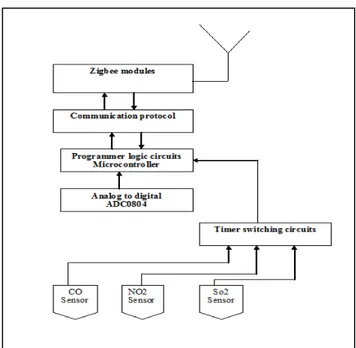
The following diagram shows the hardware block diagram of proposed system.
Fig 6: System Side Block Diagram
Fig.7:Node Block Diagram
To satisfy the system’s functional and nonfunctional requirements, two major building blocks are needed, namely: a Data Acquisition unit and a Pollution Monitoring Server. The data acquisition unit is designed by integrating microcontroller with a sensor array using analog ports. Data Acquisition Unit is also connected to a GPS module and ZigBee modem using RS-232 interface. The sensor array consists of three air pollutions sensors including Carbon Monoxide (CO), Nitrogen Dioxide (NO2), and Sulfur Dioxide (SO2). The GPS module provides the physical coordinate location of the DAQ, time and date in National Marine Electronics Association (NMEA) format [11]. NEMA format includes the complete position, velocity, and time computed by a GPS receiver where the position is given in latitude and
through a local area network (LAN).
The each of the components which is needed described below:
A. PIC16F877A microcontroller
The PIC16F877A microcontroller is the main component of a pollution detection unit [10]. The operating system that runs inside the chip coordinates the substances measurement process, the acquisition of the GPS coordinates and the data transmission to the central server [11]. The microcontroller is mounted on a development board that provides an RS232 serial communication to the Zigbee modem and GPS receiver and a parallel connection to the gas sensors. The connection between the gas sensors and the PIC16F877A microcontroller can’t be made directly because of the very small output voltages provided by the sensors (mA).This problem is solved by using auxiliary electronic circuits for signal conversion like OA (Operational Amplifiers) and transistors.
B. Sensors Array
The sensor array consists of three air pollutions sensors including Carbon Dioxide (CO2), Nitrogen Dioxide (NO2), and Sulfur Dioxide (SO2) [10. Each of the above sensors has a linear current output in the range of 4 mA– 20 mA. The 4 mA output corresponds to zero-level gas and the 20 mA corresponds to the maximum gas level. A simple signal conditioning circuit is designed to convert the 4 mA–20 mA range into 0–5 V to be compatible with the voltage range of the built-in analog-to-digital converter in the PIC microcontroller.
C. GPS Receiver
The GPS module provides the physical coordinate location of the DAQ, time and date in National Marine Electronics Association (NMEA) format [11]. NEMA format includes the complete position, velocity, and time computed by a GPS receiver where the position is given in latitude and longitude [12]. The data packet from the GPS-Module includes an RMS Header followed by UTC time, data validity checksum, latitude, longitude, velocity, heading, date, magnetic variation and direction, mode, and checksum. The only information required for the proposed system is date, time, latitude and longitude. The GPS modem is interfaced with the microcontroller using the RS-232 communication standard.
organize a network for air pollution monitoring system. The network is controlled by devices called the ZigBee coordinator modem (ZCM). The ZCMs are responsible for collecting data and maintaining the other devices on the network, and all other devices, known as Zigbee end devices (ZED), directly communicate with the ZCM. The ZigBee module is hardware platform of wireless device. The modules realize the basic function of Physical and MAC layer, such as transmit and receive, modulation and demodulation, channel and power control. They operate at 2.4GHz frequency ISM band wireless communication. The modules include a digital direct sequence spread spectrum base band modem and an effective data rate of 250 kbps. They employ the EM2420 2.4GHz radio frequency transceiver and the ATMEL 8-bit AVR microcontroller. They also exhibit a nominal transmit of -1.5dBm and a receive sensitivity of -92dBm When powered at 3.0V, the modules draw 31.0mA in transmit mode and 28mA in receive mode. When the entire module is in sleep mode, the current draw is reduced to approximately 10uA.
E. Central Server
The Central-Server is an off-the-shelf standard personal computer with accessibility to the Internet. The Pollution-Server is connected to the Zigbee-Modem via RS-232 communication standard. The air pollution information sent from each ZED are collected to ZCM. And then the data are saved to database of central server.
5. System Implementation and Result
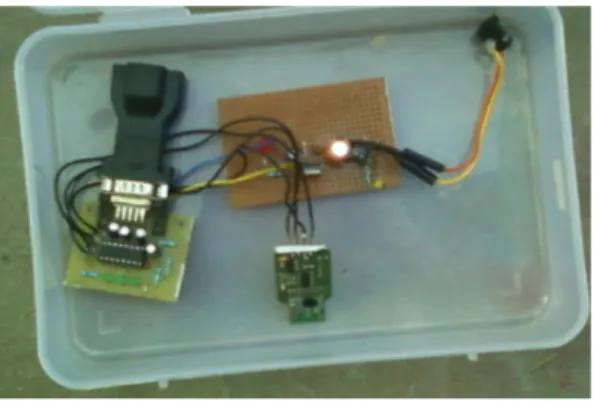
The proposed system is implemented with two transmitter module (Node 1 and Node 2) and one receiver module. The hardware module shown below:
5.1 Hardware Module
Fig 9: Data Transmitter (Node 1) Module
Fig 10: Data Transmitter (Node 2) Module 5.2 Software Module
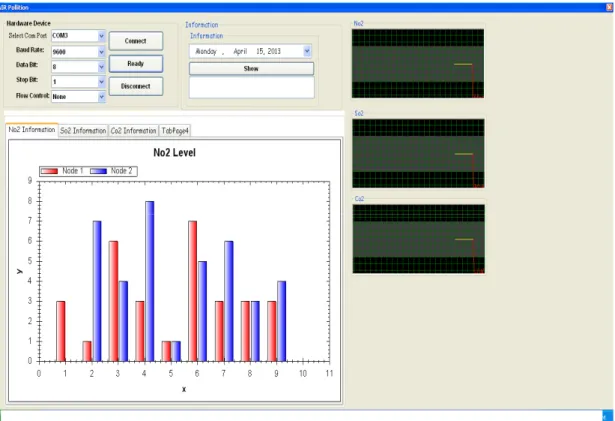
The following snapshot shows the result for pollution level of NO2. The system also shows the similar result for CO2 and SO2 pollution levels.
Fig 11: Pollution Level of NO2
6. Conclusion
The main purpose of this paper is to provide an overview of urban air pollution monitoring application. Our work is enabled by ZigBee, pollution sensors and database sensors i.e. attached to pollution server for storing the pollutants
levels for future usage by various clients for measuring pollutants in air accurately at short intervals. The system measures air pollutant gases such as CO, NO2, and SO2.
This paper will give clear idea to move towards real time measuring in an urban area to ultimately improve quality of life on earth.
My sincere thanks to my honorable guide Prof. Niketa A. Chavhan and others who have contributed towards the preparation of the paper.
References
[1] Hsu-Cheng Lu , Jen-Hao Liu , Joe-Air Jiang ;
Tzai-Hung Wen , Chih-Hong Sun , Jehn-Yih Juang , “Apllication Of A Reliable MAC Protocol For The Urban Air Quality Monitoring System Based On The Wireless Sensor Network”, IEEE Conference, pp. 1-6, (March 2012).
[2] Khunarak, C., Lutz, M., Kerdcharoen, T., “Wi-Fi Electronic Nose For Indoor Air Monitoring” IEEE Conference, pp. 1-4, (May 2012)
[3] Chung-Chih Lin , Ren-Guey Lee , Shi-Ping Liu , “ Wireless Sensing System For Prediction Indoor Air Quality”, HSIC, IEEE Conference, pp. 1-3, (May 2012) [4] Jong-Won Kwon, Yong-Man Park, Sang-Jun Koo,
Hiesik Kim, “Design of Air Pollution Monitoring System Using ZigBee Networks for Ubiquitous- City”, In Proceedings Of the 2007 International Conference on Convergence Information Technology, pp.1024-1031, (2007)
[5] Zhang Qian, Yang Xiang-Long, Zhou Yi-Ming, Wang Li-Ren, Guo Xi-Shan, “ A Wireless Solution For Greenhouse Monitoring And Control System Based On Zigbee Technology”, J. Zhejiang Univ Sci A, vol. 8, pp. 1584-1587, (2007)
[6] Kavi K. Khedo, Rajiv Perseedoss and Avinash Mungur, “ A Wireless Sensor Network Air Pollution Monitoring System”, International Journal of Wireless and Mobile Network (IJWMN), Vol. 2,No.2, (May 2010)
[7] A. R. Al-Ali,, Imran Zualkernan, and Fadi Aloul, “A Mobile GPRS-Sensors Array for Air Pollution Monitoring”, IEEE Sensor Journal, Vol. 10, No. 10, (October 2011)
[8] Jong-Won Kwon*,Yong-Man Park, Sang-Jun Koo, Hiesik Kim, “Design of Air Pollution Monitoring System using ZigBee Networks for Ubiquitous-City”, International Conference on Convergence Information Technology, (2007)
[9] Halit Eren, Ahmed Al-Ghamdi, Jinhua Luo, “Application of ZigBee for Pollution MonitoringCaused by Automobile Exhaust Gases”, IEEE Sensors Applications Symposium New Orleans, LA, USA - February 17-19(2009)
Environmental Science and Information Application Technology, (2009)
[11] W. Chung and C. H. Yang, “Remote monitoring system with wireless sensors module for room environment,” Sens. Actuators B, vol. 113 no. 1, pp.35– 42, 2009. [12] M. Predko, Programming and Customizing PICmicro
Microcontrollers, Mc Graw Hill, 2002
[13] P.N. Borza, C. Gerigan, P. Ogruţan, Ghe. Toacşe, Microcontrollers – Applications (in Romanian), Ed.Tehnică, Bucuresti, Romania, 2000.
[14] O. Hyncica, The ZigBee Experience.
[15] Y W Zhu,The Design of Wireless Sensor Network System Based on ZigBee Technology for Greenhouse, 2006 IOP Publishing Ltd, pp1195~1199
[16] ZigBee Alliance, ZigBee-Specification National Marine
Electronics Association Data.
[Online].Available:http://www.gpsinformation.org/da le/nmea.htm
Authors
Darshana Tambe received the B.E. degree from K.D.K College of Engineering, Nagpur, State-Maharashtra, India. She is pursuing Master of Engineering (M.E.) in Wireless Communication and Computing from G. H. Raisoni College of Engineering, Nagpur. Maharashtra, India. Her research area includes Wireless network security, Wireless sensor network.
Nekita Chavhan received the Master of Engineering (M.E.) in Wireless Communication and Computing from G. H. Raisoni College of Engineering, Nagpur, Maharashtra, India. She is working as Assistant Professor in G. H. Raisoni College of Engineering, Nagpur. Her research area includes Ad-hoc Wireless networks, Wireless sensor networks and Mobile Technology.