1
J. Dairy Sci. 100:1–17
https://doi.org/10.3168/jds.2016-11683 © American Dairy Science Association®, 2017.
ABSTRACT
Milk color is one of the sensory properties that can influence consumer choice of one product over another and it influences the quality of processed dairy prod-ucts. This study aims to quantify the cow-level genetic and nongenetic factors associated with bovine milk color traits. A total of 136,807 spectra from Irish com-mercial and research herds (with multiple breeds and crosses) were used. Milk lightness (ˆ ),L* red-green index (ˆ ),a* and yellow-blue index (ˆ )b* were predicted for indi-vidual milk samples using only the mid-infrared spec-trum of the milk sample. Factors associated with milk color were breed, stage of lactation, parity, milking-time, udder health status, pasture grazing, and sea-sonal calving. (Co)variance components for ˆ ,L* ˆ ,a* and ˆb* were estimated using random regressions on the ad-ditive genetic and within-lactation permanent environ-mental effects. Greater ˆb* value (i.e., more yellow color) was evident in milk from Jersey cows. Milk ˆL* increased consistently with stage of lactation, whereas ˆa* in-creased until mid lactation to subsequently plateau. Milk ˆb* deteriorated until 31 to 60 DIM, but then im-proved thereafter until the end of lactation. Relative to multiparous cows, milk yielded by primiparae was, on average, lighter (i.e., greater ˆ ,L*) more red (i.e., greater ˆ ,
a*) and less yellow (i.e., lower ˆb*). Milk from the morn-ing milk session had lower ˆ ,L* ˆ ,a* and ˆb*. Heritability estimates (±SE) for milk color varied between 0.15 ± 0.02 (30 DIM) and 0.46 ± 0.02 (210 DIM) for ˆ ,L* be-tween 0.09 ± 0.01 (30 DIM) and 0.15 ± 0.02 (305 DIM) for ˆ ,a* and between 0.18 ± 0.02 (21 DIM) and 0.56 ± 0.03 (305 DIM) for ˆb*. For all the 3 milk color features, the within-trait genetic correlations approached unity as the time intervals compared shortened and were generally <0.40 between the peripheries of the lacta-tion. Strong positive genetic correlations existed be-tween ˆb* value and milk fat concentration, ranging from 0.82 ± 0.19 at 5 DIM to 0.96 ± 0.01 at 305 DIM and
confirming the observed phenotypic correlation (0.64, SE = 0.01). Results of the present study suggest that breeding strategies for the enhancement of milk color traits could be implemented for dairy cattle popula-tions. Such strategies, coupled with the knowledge of milk color traits variation due to nongenetic factors, may represent a tool for the dairy processors to reduce, if not eliminate, the use of artificial pigments during milk manufacturing.
Key words: milk color, mid-infrared spectroscopy,
genetic parameter, dairy industry, Commission Internationale d’Eclairage L*a*b*
INTRODUCTION
Food color is known to affect food choice (Clydesdale, 1993). The sensory properties of milk (i.e., appearance, color, flavor, aroma, and texture) are also important because of their close relationship with product quality (Wadhwani and McMahon, 2012) and consumer accep-tance (Phillips et al., 1995). The yellow color of butter and many cheeses is influenced by milk fat carotenoid content (Descalzo et al., 2012), and market preferences for milk fat color varies across the world (Berry et al., 2009). For example, the yellow color of dairy products is sometimes said to be associated with a more green image by consumers, because of its association with grazing animals (Descalzo et al., 2012). In direct con-trast, however, in New Zealand the yellow color of milk and its associated products is considered an unfavorable attribute in the opinion of many consumers (Morris et al., 2002).
Milk color is known to be affected by many factors in-cluding animal genetic merit and breed (Winkelman et al., 1999; Noziere et al., 2006; Berry et al., 2009), stage of lactation and parity (Calderón et al., 2007; Jadhav et al., 2008), time of milking (Quist et al., 2008), udder health status (Espada and Vijverberg, 2002), as well as herd-level factors such as pasture grazing and seasonal calving (Agabriel et al., 2007; Solah et al., 2007; Walker et al., 2013).
To our knowledge no study has attempted to quantify the contribution of genetics to variability in milk color
Genetic and nongenetic factors associated with milk color in dairy cows
S. Scarso,* S. McParland,†1 G. Visentin,*† D. P. Berry,† A. McDermott,† and M. De Marchi**Department of Agronomy, Food, Natural Resources, Animals and Environment, University of Padova, Viale dell’Università 16, 35020 Legnaro (PD), Italy
†Animal and Grassland Research and Innovation Center, Teagasc, Moorepark, Fermoy, Co. Cork, Ireland
Received June 30, 2016. Accepted May 6, 2017.
in terms of lightness (L*), red-green (a*), and yellow-blue (b*) values. Winkelman et al. (1999) estimated genetic and phenotypic correlations of milk color traits (in terms of milk color, fat color, and β-carotene yield) with each other and with milk production traits (milk, fat, and protein yields). Milk color, in this case, was determined by extraction from milk of the nonsaponifi-able compounds. Because several studies that investi-gated food color used the Commission Internationale d’Eclairage L*a*b* method as color measurement, es-pecially on meat color (Fletcher, 1999, on broiler meat; Liu et al., 2003, on beef; Zhang et al., 2007, on pork meat), in the present study this method was used to investigate milk color.
Recently mid-infrared spectroscopy (MIRS) has been demonstrated to be a useful low-cost and rapid screening tool (De Marchi et al., 2014) to acquire and predict innovative milk technological phenotypes (Visentin et al., 2015, 2016) and determine the L*, a*, and b* color value of milk (McDermott et al., 2016). Prediction equations developed using MIRS can be used to quantify the milk color of individual animal samples during routine milk recording as well as more frequently available bulk tank milk samples. Therefore, MIRS is useful to collate large numbers of unbiased records of milk color throughout lactation which can be used to estimate animal breeding values.
Thus, the objective of the present study was to quan-tify the contribution of cow-level genetic and nonge-netic factors to variability in milk color as described by L*, a*, and b* indices predicted using MIRS equations.
MATERIALS AND METHODS Milk Sample Collection
A total of 174,062 milk samples were collected be-tween January 2013 and December 2015 from 10,394 dairy cows of 5 different breeds (Holstein, Friesian, Jersey, Montbeliarde, and Norwegian Red) and crosses. Of these, 129,086 samples were from 1,661 research cows from 7 research farms operated by the Teagasc Animal and Grassland Research and Innovation Centre (Moorepark, Fermoy, Co. Cork, Ireland). Cows in the research herds participated in a series of experimental treatments based on different feeding strategies, stock-ing rates, calvstock-ing periods, and length of grazstock-ing period. A small proportion of dairy cows in the research herds (90 individuals per year) belonged to the top 1% ge-netic merit, as ranked based on the national selection index. The remaining 44,976 samples were collected from 8,733 cows from 69 different commercial Irish farms located in southwest Ireland. Cows in research
and commercial herds were fed a basal grazed-pasture diet, but at times cows in the research farms were supplemented with a small quantity of concentrates (depending on the experimental treatment). All cows were milked twice daily and sampled based on test-day recording system. The average monthly test-day records per cow and lactation were 17 and 10, respectively. Coefficients of general heterosis and recombination loss were calculated for each cow as
, heterosis= − sire dam
=
∑
1 1 i ni× i and recombination loss =
1 2 1 2 2 − + =
∑
, i n i isire dam where sirei and dami are the pro-portion of genes of the breed i in the sire and the dam, respectively (VanRaden and Sanders, 2003). The pedi-gree of all animals was traced back at least 4 genera-tions, and comprised a total of 41,232 animals.
For the research data, milk samples were separately collected on consecutive PM and AM milkings once weekly. For commercial herds, a single milk sample was taken during the milk recording day and these samples were collected occasionally (approximately 1,249 spectra/mo) and sent for analysis as part of a related research study. Once collected, all samples were analyzed within 24 h (for research samples) or 5 d (for commercial samples) in the laboratory of Teagasc Animal and Grassland Research and Innovation Center (Moorepark, Fermoy, Co. Cork, Ireland). Milk chemi-cal composition (concentrations of protein, fat, lactose, urea, casein, and TS) was predicted using a MilkoScan FT6000 (Foss Electronic A/S, Hillerød, Denmark) and mid-infrared spectra (wavelengths from 900 to 5,000 cm−1) were stored. Somatic cell count was determined by Fossomatic (Foss Electronic A/S) and normalized by taking the log10 of SCC/1,000 (log10SCC).
Gold Standard Analysis and Prediction Model Development
Milk color was measured on a selection of samples for the development of MIR prediction equations using a Chroma Meter CR400 (Konica Minolts Sensing Europe, Nieuweigein, the Netherlands, with viewing geometry d/0) with a closed cone, set on the L*, a* and b* sys-tem. The selection of samples was discussed in detail by McDermott et al. (2016). The Chroma Meter CR was calibrated on a white tile. Sub-samples of 10-mL were measured in a cuvette and results were expressed in Commission Internationale d’Eclairage L*a*b* uniform color space. This method is a 3-dimensional opponent color system that represents L*, a*, and b* values on 3 axes. The central vertical axis represents the L*
in-dex, whose values run from 0 (black) to 100 (white). On each axis the values run from positive to negative. Positive values on the a* axis indicate redness, whereas negative values indicate greenness. On the b* axis, the yellow color is represented by positive values, whereas blue is represented by negative values. For both axes, zero is neutral gray.
The development of MIRS prediction models was described in detail by McDermott et al. (2016). Briefly, prediction models were developed separately for each color index using partial least squares regression analy-sis (PROC PLS; ver. 9.3, SAS Institute Inc., Cary, NC) with untreated spectra. Accuracy of prediction was estimated in external validation on 25% of total data, whereas the remaining 75% was used to calibrate the prediction equations. This procedure was repeated 4 times using a different validation data set. The external validation correlation coefficient (rv) was used to de-fine the accuracy of each MIRS predictive model. The highest accuracy of prediction was obtained for the b* index (rv = 0.72), whereas a* and L* indices related poorly with the MIR spectrum (rv = 0.30 and rv = 0.55, respectively; McDermott et al., 2016).
Data Editing
Principal component analysis was undertaken on all 174,062 spectra (PROC PRINCOMP, SAS Insti-tute Inc.). The first 4 principal components explained 97.33% of the entire spectral variation. Mahalanobis distance was computed; it was defined as the sum of squares of the centered and scaled scores of the first 4 principal components (Brereton, 2015). Mahalanobis distance distribution has a χ2 distribution shape (with 4 df) and a threshold of 97.5% was set up on the curve tails. All spectra out of this area were considered outli-ers and were deleted. A total of 16,870 records were discarded from all data obtained. Milk color traits were then predicted by applying the MIRS models developed in McDermott et al. (2016) to the retained spectra. Only DIM between 5 and 305 from parities 1 to 10 were retained. Obvious data set errors (milk yield and milk fat and urea content lower than 2 kg, 2%, and 2 mg/dL, respectively) were deleted. Values for each trait that were >3 standard deviations from the mean were considered outliers and removed. All 3 milk color traits were normally distributed. Contemporary group was defined as experimental treatment by test-day on the research farms and herd test-day on the commercial farms. Only contemporary groups with >10 observa-tions were retained. Following all edits, the final data set consisted of 136,807 milk spectra from 16,543 lacta-tions from 9,824 cows.
Data Analysis
Spearman rank correlations among the gold standard and predicted milk color indices (L*, a*, b*), milk yield (kg), milk fat (%), milk protein (%), milk lactose (%), urea (mg/dL), casein (%), and SCC (cells/mL) were computed.
For the purpose of quantifying the effect of stage of lactation or parity on the correlation between traits, stage of lactation was stratified into classes (≤60 DIM, from 61 to 159 DIM, and ≥160 DIM) and parity was defined as 1, 2, or ≥3 parities. Spearman rank correla-tions among traits were computed within each class and the significance of the differences in the correla-tions between pairwise classes was determined using the Fisher r-to-z transformation.
Factors associated with each of the 3 predicted milk color trait were determined using the following linear mixed animal model in ASREML (Gilmour et al., 2011):
Yjklmnopqr i j j k l m n o = + + + + + + =
∑
1Breed Het Rec Par DIM
Session Monthpp m n q q q jklmnopq e + + + + + ( ) _ Par DIM PEwithin PEacross Cont group
×
rr,
where Yjklmnopqr is the milk color trait (L*, a*, and b*) predicted by MIRS; Breedj represents the jth propor-tion of genes of Friesian, Jersey, Montbeliarde, Norwe-gian Red, and other breeds (proportion of Holstein was not included in the model to avoid linear dependencies) treated as a continuous fixed effect; Hetk is the fixed effect of the kth class of individual heterosis coefficient (12 classes: 0, 1–10, 11–20, 21–30, 31–40, 41–50, 51–60, 61–70, 71–80, 81–90, 91–99, and 100%); Recl is the fixed effect of lth class of the individual recombination loss coefficient (12 classes: 0, 1–10, 11–20, 21–30, 31–40, 41–50, 51–60, 61–70, 71–80, 81–90, 91–99, and 100%); Parm is the fixed effect of mth class of parity (5 classes: 1, 2, 3, 4, and ≥5); DIMn is the fixed effect of the nth class of stage of lactation (10 classes: 5–30, 31–60, 61– 90, 91–120, 121–150, 151–180, 181–210, 201–240, 241– 270, and 271–305 DIM); Sessiono is the fixed effect of the oth class of milking time (3 classes: AM, PM, or combined); Monthp is the fixed effect of the pth class of month of test (12 classes: January, February, March, April, May, June, July, August, September, October, November, and December); Parm × DIMn is the fixed effect of the 2-way interaction between the mth class of parity and the nth class of stage of lactation; PEwithinq is the random effect of the within-lactation permanent
environmental effect of the qth cow where PEwithin ~N 0,I 2 ,
PEwithin
σ
(
)
where σPEwithin is the within-lactation permanent environmental variance; PEacrossq is the random effect of the across-lactation permanent envi-ronmental effect of the qth cow, where PEacross ~N 0,I 2 ,PEacross
σ
(
)
where σPEacross is the across-lactation permanent environmental variance; Cont_groupq is the random effect of the contemporary group of the qth cow, where Cont_group ~N 0,I 2 _ ,Cont group
σ
(
)
whereσCont_group is the contemporary group variance; and
ejklmnopqr is the random effect of the residual where
e N~
(
0,Iσe2)
, where σe is the residual variance. A series of supplementary analysis were undertaken, in which test-day milk yield or milk fat concentration was in-cluded in the model as a covariate. Least squares means were derived for a reference animal, which was repre-sented by a third parity cow, 100% Holstein, milked in the morning, averaged across all stages of lactation and months of test.Variance components were estimated for the MIRS-predicted milk color traits (L*ˆ , ˆ ,a* and ˆb*), as well as for milk yield, log10SCC, and concentrations of protein, fat, lactose, urea, and casein using random regression ani-mal models fitted across lactation in ASREML (Gilm-our et al., 2011); variance components were restricted to only the 8,519 cows that were ≥75% Holstein-Frie-sian. The number of test-day records remaining was 98,253 from 14,204 lactations. The data were divided into 10 residual groups based on DIM as 5 to 30 DIM, 31 to 60 DIM, …, 241 to 270 DIM, and 271 to 305 DIM. The number of observations for each residual group is presented in Supplemental Figure S1 (https:// doi.org/10.3168/jds.2016-11683). The estimated resid-ual variance, within group, was assumed to be homoge-neous, but between groups the estimated residual vari-ance could be heterogeneous. No residual (co)varivari-ance was assumed among residual groups. The model fitted was the same as previously described, with the excep-tion that the effect of month of test was excluded from the analysis, as the effect of contemporary group was fitted as a fixed term. The effect of DIM class was also excluded from the statistical analysis as Legendre poly-nomials on each individual DIM were fitted as a fixed term. Moreover, the animal additive genetic effect was added as a random term where the additive effect fol-lowed the assumptions of ~N(0,Aσa2). Legendre polyno-mials were fitted as a random term on both the additive genetic effect as well as on the within lactation perma-nent environmental effect. The most parsimonious or-der of fixed Legendre polynomials was based on visual inspection of the resulting lactation profile for each milk color trait for the different polynomial orders. In
all instances, a cubic Legendre polynomial was the most appropriate, as minimal differences were detected between lactation profiles generated with higher order polynomials. Based on the Akaike information criterion, the most parsimonious random covariance function was a cubic polynomial fitted to both the additive genetic and the within-lactation permanent environmental ef-fects for ˆL* and ˆb*, whereas for ˆa* the polynomial order for both random terms was quadratic.
Univariate analyses using ASREML (Gilmour et al., 2011) was carried out also using a repeatability ani-mal model on both gold standard and MIRS-predicted milk color traits, milk yield, milk composition, and log10SCC. The model was the same as described for the phenotypic analyses.
Genetic covariance function coefficients were esti-mated as δ2 =ΦΚΦ′, where δ2 is the 301 × 301 (co) variance matrix for the MIRS-predicted milk color trait, milk yield, milk composition, and log10SCC; Φ is the 301 × n matrix of Legendre polynomial regressed on DIM; and K is the n × n (co)variance matrix of the additive genetic (or within lactation permanent envi-ronment) effect. Standard errors of the heritability es-timates were calculated using a Taylor series expansion following Fisher et al. (2004). Pairwise genetic correla-tions between traits were calculated using a series of bivariate random regression models, fitting the same model as used for the univariate analyses. Residual groups were as defined in the univariate analyses, but within-group residual covariances were estimated. Co-variance functions for the random terms were reduced to a quadratic polynomial to meet log-likelihood con-vergence. Standard errors of the genetic correlation were calculated as in Falconer and MacKay (1996).
RESULTS
Summary statistics for all color and performance traits are in Table 1. The mean of the predicted and the respective gold standard milk color variable was similar. The phenotypic correlations between the milk color parameters (both gold standard and predicted) and performance traits are in Table 2. A higher L* (i.e., lighter milk) was associated with a more positive a* (i.e., more red) and more positive b* (i.e., more yel-low) values. Both a* and b* were not correlated with each other when derived from the MIRS prediction equations despite a weak negative correlation (−0.11) between the gold standard a* and b* values. Milk yield was negatively correlated with all color traits predicted from MIRS but was only negatively correlated with L* and b* values when the gold standard values were used (−0.42 and −0.54, respectively). Milk fat concentration
was moderately correlated with both gold standard (0.43) and predicted (0.58) L* as well as being positive-ly correlated with gold standard and predicted b* (0.64 to 0.77). Milk protein concentration was moderately positively correlated with both L* (0.34 to 0.50) and b* (0.50 to 0.62). Similarly, casein concentration in the milk was moderately positively correlated with both L* (0.35 to 0.52) and b* (0.46 to 0.57).
Several of the phenotypic correlations between at least one of the color traits and the performance traits, however, differed by parity (Table 3) or stage of lacta-tion (Table 4); the exceplacta-tions were the correlalacta-tions be-tween all color traits with milk fat concentration, milk protein concentration, and milk casein concentration, which did not differ by stage of lactation (Table 4).
Jersey breed had the highest fat concentration (5.10%, SE = 0.04) compared with Holstein (3.90%, SE = 0.03), Friesian (3.99%, SE = 0.06), Norwegian Red (3.94%, SE = 0.07), and Montbeliarde (3.62%, SE = 0.09; data not shown).
Lightness Color (L*)
Milking-time (P < 0.001), stage of lactation (P < 0.001), Jersey proportion (P < 0.001), month of the year (P < 0.001), parity (P < 0.001), the interaction between parity and stage of lactation (P < 0.001), Montbeliarde proportion (P < 0.001), recombination loss (P < 0.001), Friesian proportion (P < 0.05), and heterosis (P < 0.05) were all associated with ˆ ;L* ˆL* was not associated with the proportion of Norwegian Red in the animals. The ˆL* generally increased as the calendar year progressed, although a dip in ˆL* was evident in August (Figure 1). Mean ˆL* was 81.25 (SE = 0.02) in the morning milking and 81.89 (SE = 0.02) in the eve-ning milking (data not shown). The milk of Jerseys had higher ˆL* values than Holsteins, Friesians (P < 0.001), Norwegian Reds (P < 0.001), and Montbeliarde cows (P < 0.001; Table 5). The regression coefficient of ˆL* on
Jersey breed proportion changed from 0.41 to −0.12 following the adjustment for difference in milk fat con-Table 1. Number of records (n), mean, genetic standard deviation (σg), heritability (SE), and repeatability
(SE) for the 3 gold standard (L* = lightness, a* = redness/greenness, b* = yellowness/blueness) and predicted
(L*,ˆ ˆa*, and ˆb*) color indices as well as milk yield, concentrations of protein, fat, lactose, urea, and casein, and log10(SCC/1,000)1
Trait n Mean σg Heritability Repeatability
L* 590 81.60 0.54 0.16 (0.15) 0.29 (0.16) a* 569 −3.88 0.17 0.07 (0.18) 0.60 (0.13) b* 594 8.04 0.69 0.12 (0.13) 0.13 (0.12) ˆL* 133,611 81.63 0.30 0.29 (0.02) 0.39 (0.01) ˆa* 133,653 −4.05 0.07 0.09 (0.01) 0.18 (0.00) ˆb* 133,528 8.23 0.55 0.35 (0.02) 0.38 (0.01) Milk yield (kg) 134,155 13.44 1.43 0.19 (0.02) 0.66 (0.00) Protein (%) 128,561 3.71 0.17 0.45 (0.02) 0.59 (0.01) Fat (%) 128,256 4.61 0.35 0.29 (0.01) 0.31 (0.01) Lactose (%) 128,510 4.76 0.08 0.35 (0.02) 0.50 (0.01) Urea (mg/dL) 127,982 30.59 1.92 0.14 (0.01) 0.25 (0.01) log10(SCC/1,000) 75,950 1.79 0.09 0.05 (0.01) 0.45 (0.01) Casein (%) 128,615 2.81 0.14 0.46 (0.02) 0.59 (0.01)
1Genetic SD, heritability, and repeatability estimates are relative to individuals at least 75% Holstein-Friesian.
Table 2. Spearman rank correlations1 between the color traits and milk yield, concentrations of protein, fat, lactose, urea, and casein, and SCC2
Item L* a* b* Milk yield Protein Fat Lactose Urea SCC Casein
L* — 0.32 0.55 −0.42 0.34 0.43 −0.17 0.06 0.00 0.35 a* 0.24 — −0.11 0.05 −0.22 −0.05 −0.01 −0.18 0.15 −0.23 b* 0.74 0.00 — −0.54 0.50 0.64 −0.33 0.32 0.05 0.46 Milk yield −0.64 −0.18 −0.69 — −0.42 −0.54 0.29 −0.31 −0.04 −0.45 Protein 0.50 −0.20 0.62 −0.44 — 0.48 −0.38 0.43 0.21 0.93 Fat 0.58 0.04 0.77 −0.57 0.51 — −0.18 0.19 0.02 0.51 Lactose −0.18 0.01 −0.45 0.33 −0.31 −0.22 — −0.42 −0.06 −0.24 Urea 0.05 −0.21 0.42 −0.32 0.37 0.18 −0.42 — 0.26 0.39 SCC 0.02 0.05 −0.01 −0.03 0.03 −0.11 0.08 0.07 — 0.20 Casein 0.52 −0.14 0.57 −0.46 0.92 0.51 −0.16 0.31 0.02 —
1Correlations <|0.07| were not different from zero (P > 0.05).
2Correlations with gold standard values of lightness (L*; n = 590), redness/greenness (a*; n = 562), and yellowness/blueness (b*; n = 597) are
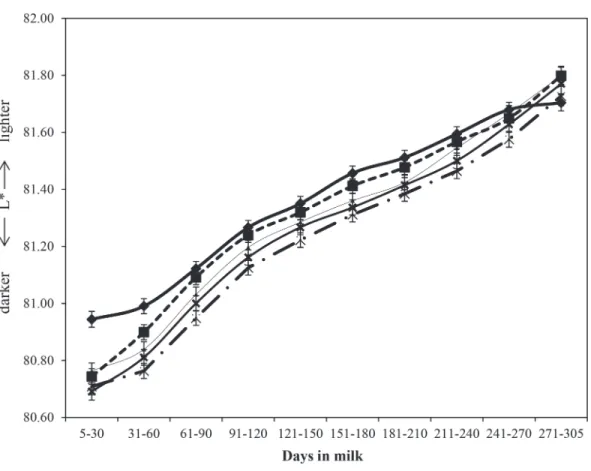
centration in the model (Table 5). Adjustment for dif-ferences in milk yield in the model had a minimal effect on the regression coefficient of ˆL* on Jersey proportion. Although the trend of ˆL* across lactation differed sta-tistically (P < 0.001) by parity, the biological effect of the interaction was minimal (Figure 2). Irrespective of parity, ˆL* consistently increased with advancing stages of lactation. Mean ˆL* for parity 1 was 81.36 (SE = 0.02), for parity 2 was 81.32 (SE = 0.03), for parity 3 was 81.29 (SE = 0.03), for parity 4 was 81.26 (SE = 0.03), and for parity 5+ was 81.22 (SE = 0.03; Figure 2).
The heritability of gold standard L* estimated with the repeatability model was 0.16 (SE = 0.15), whereas the repeatability was 0.29 (SE = 0.16; Table 1). Herita-bility estimates for ˆL* calculated using random regres-sion models ranged between 0.15 ± 0.02 (30 DIM) and 0.46 ± 0.02 (210 DIM; Figure 3). Within-trait genetic correlations approached unity between adjacent DIM; all within-trait genetic correlations were positive, and had a minimum of 0.02 ± 0.02 between 5 and 305 DIM (Figure 4). The ˆL* was negatively genetically correlated with milk yield (−0.65 ± 0.02 to −0.37 ± 0.06 at 249 and 37 DIM, respectively), milk lactose concentration (−0.34 ± 0.05 to 0.07 ± 0.06 at 305 and 41 DIM, re-spectively), and milk urea content (−0.18 ± 0.03 to
−0.10 ± 0.11 at 252 and 5 DIM, respectively; Figure 5). Positive genetic correlations existed between ˆL* and both milk fat concentration (0.32 ± 0.09 to 0.78 ± 0.01 at 5 and 249 DIM, respectively) and milk protein con-centration (0.43 ± 0.07 to 0.91 ± 0.01 at 5 and 305 DIM, respectively; Figure 5).
Red-Green Color (a*)
Factors associated with ˆa* included milking-time (P
< 0.001), month of the year (P < 0.001), stage of lacta-tion (P < 0.001), parity (P < 0.001), Jersey proportion (P < 0.001), the 2-way interaction parity-by-stage of lactation (P < 0.001), Norwegian Red proportion (P < 0.001), heterosis (P < 0.001), recombination loss (P < 0.001), and Friesian proportion (P < 0.02); the propor-tion of Montbeliarde in the cow was not associated with ˆa* values. The ˆa* color of milk was relatively consistent across months of the year with a peak (i.e., more red) in August (−3.55) and a minimum (i.e., more green) of between −4.46 to −4.43 between March and June (Fig-ure 1). Mean ˆa* was −3.95 (SE = 0.01) in the morning milking and −3.82 (SE = 0.01) in the evening milking (data not shown). The milk of Friesians, Jerseys, Nor-wegian Reds, and Montbeliardes was more green (i.e., lower ˆa*) than that of Holsteins (Table 5). The shape of Table 4. Spearman rank correlation between the 3 milk color indices (L* = lightness, a* = redness/greenness, b* = yellowness/blueness) and milk yield; concentrations of protein, fat, lactose, urea, and casein, and SCC in different stages of lactation
Item
L* a* b*
0–60
DIM 61–159 DIM 160–305 DIM 0–60 DIM 61–159 DIM 160–305 DIM 0–60 DIM 61–159 DIM 160–305 DIM Milk yield 0.04b −0.50a −0.35a −0.07a 0.11b −0.12a −0.29a −0.59b −0.41a Protein 0.37 0.37 0.27 −0.21 −0.20 −0.17 0.35 0.40 0.43 Fat 0.45 0.54 0.37 0.13 −0.002 −0.01 0.67 0.69 0.54 Lactose −0.14 −0.04 −0.16 −0.24a −0.07a 0.06b −0.02a −0.20a −0.28b Urea −0.20a 0.13b −0.03a −0.07 −0.12 −0.12 −0.14a 0.31b 0.06a SCC 0.10 0.05 −0.18 0.13 0.15 0.27 −0.05a 0.17a −0.33b Casein 0.36 0.36 0.27 −0.28 −0.21 −0.12 0.35 0.33 0.41
a,bCorrelations within the same row with different superscripts are different (P < 0.05) from each other.
Table 3. Spearman rank correlations between the 3 gold standard milk color indices (L* = lightness, a* = redness/greenness, b* = yellowness/ blueness) and milk yield, concentrations of protein, fat, lactose, urea, and casein, and SCC in different parities
Parity L* a* b* 1 2 ≥3 1 2 ≥3 1 2 ≥3 Milk yield (kg) −0.39 −0.43 −0.40 0.09a −0.13b 0.06a −0.43a −0.48a −0.70b Protein (%) 0.36 0.28 0.34 −0.18 −0.17 −0.21 0.44a 0.42a 0.58b Fat (%) 0.42 0.35 0.51 0.07 −0.01 −0.10 0.54a 0.55a 0.74b Lactose (%) −0.16a −0.02a −0.33b 0.06 0.06 −0.08 −0.32 −0.29 −0.38 Urea (mg/dL) 0.09a −0.10b 0.17a −0.21 −0.13 −0.09 0.30a 0.21b 0.40a SCC (cells/mL) 0.08 0.07 −0.19 0.11 0.27 0.08 0.09 0.19 −0.07 Casein (%) 0.36 0.31 0.36 −0.20 −0.16 −0.20 0.38a 0.38a 0.55b
Figure 1. Monthly LSM along the calendar year of predicted lightness (L*;ˆ ––◆––; on the secondary vertical axis), predicted redness/green-ness (a*;ˆ ––■––; on the primary vertical axis), predicted yellowness/blueness (b*;ˆ ––▲––; on the primary vertical axis); ˆb* considered fat concen-tration (4.61%) as a covariate in the model (- -▲- -; on the primary vertical axis; average SE = 0.05).
Table 5. Linear regression coefficients of predicted lightness (L*),ˆ redness/greenness (ˆ )a* , yellowness/blueness
(ˆ )b* on breed fractions and with fat concentration (4.61%) or milk yield (13.44 kg) also included as a covariate in the statistical model
Item ˆL* ˆa* ˆb*
Friesian −0.13 (0.05) −0.04 (0.02) 0.00 (0.09)
Jersey 0.41 (0.04) −0.14 (0.01) 1.85 (0.07)
Norwegian Red −0.09 (0.07) −0.07 (0.02) 0.09 (0.11)
Montbeliarde −0.30 (0.08) −0.04 (0.03) −0.33 (0.13)
Adjustment for fat concentration
Friesian −0.17 (0.04) −0.04 (0.02) −0.09 (0.05)
Jersey −0.12 (0.04) −0.19 (0.02) 0.49 (0.04)
Norwegian Red −0.15 (0.06) −0.08 (0.02) 0.02 (0.06) Montbeliarde −0.19 (0.06) −0.02 (0.03) −0.04 (0.07) Adjustment for milk yield
Friesian −0.17 (0.05) −0.04 (0.02) −0.06 (0.09)
Jersey 0.34 (0.04) −0.14 (0.01) 1.74 (0.07)
Norwegian Red −0.14 (0.07) −0.08 (0.02) 0.01 (0.11) Montbeliarde −0.31 (0.08) −0.04 (0.03) −0.31 (0.13)
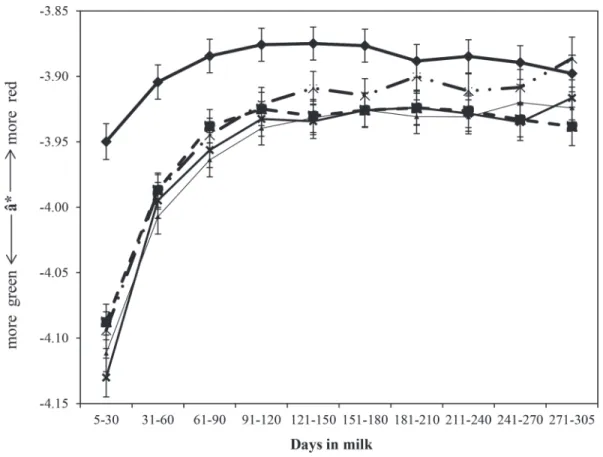
the lactation profile differed by cow parity number al-though, within parity, the lowest ˆa* value was in early lactation reaching a plateau from mid lactation on (Figure 6). The profile of first lactation cows differed biologically from that of later parity cows, which in turn were similar to each other. Across lactation the mean ˆa* of first parity cows was −3.89 compared with a parity mean of between −3.94 and −3.96 for later parity cows (Figure 6).
The heritability and repeatability estimates of gold standard a* (calculated by the repeatability animal model) were 0.07 (SE = 0.18) and 0.60 (SE = 0.13), respectively (Table 1). Heritability values for ˆa* esti-mated using the random regression models ranged from 0.09 ± 0.01 (30 DIM) to 0.15 ± 0.02 (305 DIM) increas-ing almost consistently as lactation progressed (Figure 3). Within-trait genetic correlations had a minimum of 0.44 ± 0.02, which occurred between 5 and 219 DIM (Figure 4). Milk ˆa* values were positively genetically correlated with both ˆL* (0.24 ± 0.05 to 0.46 ± 0.08 at 97 and 5 DIM, respectively) and log10SCC (0.14 ± 0.09 to 0.46 ± 0.16 at 94 and 5 DIM, respectively), but were negatively genetically correlated with all other milk quality traits (Figure 7).
Yellow-Blue Color (b*)
Milking time (P < 0.001), Jersey proportion (P < 0.001), parity (P < 0.001), stage of lactation (P < 0.001), month of the year (P < 0.001), the 2-way inter-action parity-by-stage of lactation (P < 0.001), recom-bination loss (P < 0.001), and Montbeliarde proportion (P < 0.01), were all associated with ˆb*; ˆb* was not
as-sociated with either the proportion of Friesian and Norwegian Red nor the heterosis coefficient of the cow. A general trend was observed for the ˆb* value of milk to increase with calendar month (Figure 1) varying from 6.69 (in January, SE = 0.18) to 8.47 (in December, SE = 0.15). Including fat concentration as a covariate in the statistical model did not greatly alter the trend across months (Figure 1). The mean unadjusted ˆb* value was 7.72 (SE = 0.04) and 8.89 (SE = 0.04) in the morning and evening milking, respectively (data not shown). Jersey cows had more yellow milk than Hol-steins with a ˆb* value of +1.85 (+0.49 after adjustment for milk fat content) relative to a ˆb* value of 0 for Holstein cows. Otherwise, the milk of Montbeliarde cows was, on average, bluer than the milk of Holsteins (Table 5). Milk ˆb* value was influenced by recombina-Figure 2. Least squares means of predicted lightness
( )
ˆL* values throughout lactation in parity 1 (––◆––), parity 2 (- -■- -), parity 3 (—▲—), parity 4 (––X––), and parity ≥5 (-·-X-·-; average SE = 0.03).tion loss only in animals with a gene recombination percentage between 30 and 80% (data not shown).
Although a significant interaction between parity and stage of lactation existed for the association with ˆb*, the trend in ˆb* across lactation was nonetheless similar across parities decreasing from between 5 and 30 DIM to between 31 and 60 DIM and increasing thereafter (Figure 8). Mean ˆb* in parity 1 animal was lowest (7.36), whereas mean ˆb* in second parity animals was 7.56; the mean ˆb* of older parity animals were similar (7.80 to 7.87). Including milk yield in the
statis-tical model did not affect the lactation profile for ˆb* but the difference between parities increased (Figure 9); for example, the mean difference in ˆb* between parity 1 and parity 3 animals increased from 0.43 without milk yield in the model to 0.60 with milk yield in the model. Including milk fat concentration in the statistical model altered the shape of the lactation profiles for ˆb* with no observed reduction in ˆb* in early lactation but also a widening of the difference in ˆb* between parity 1 and older parity animals especially in early lactation (Figure 10).
Figure 3. (A) Genetic SD (SE in parentheses) for predicted lightness (L*;ˆ ––□––; 0.002 to 0.012, left vertical axis), predicted redness/green-ness (a*;ˆ ––◆––; 0.02 to 0.07, right vertical axis), and predicted yellowness/blueness (b*;ˆ ––△––; 0.01 to 0.03, left vertical axis), and (B) heritabil-ity estimates (SE in parentheses) for ˆL* (––□––; 0.02 to 0.03), ˆa* (––◆––; 0.01 to 0.02), and ˆb* (––△––; 0.01 to 0.03).
The heritability and repeatability estimates calcu-lated using the repeatability animal model for gold standard b* was 0.12 (SE = 0.13) and 0.13 (SE = 0.12), respectively (Table 1). The heritability and repeatabil-ity estimates for the ˆb* parameter estimated using a
repeatability model that phenotypically adjusted for milk fat concentration was 0.25 (SE = 0.01) and 0.32 (SE = 0.01), respectively; the genetic standard devia-tion of ˆb* following the genetic adjustment for milk fat concentration was 0.25 (coefficient of genetic variation of 3.22%). Heritability estimates from the random re-gression analysis of ˆb* varied between 0.18 ± 0.02 (21 DIM) to 0.56 ± 0.03 (305 DIM; Figure 3). Within-trait genetic correlations weakened as the time between DIM increased, and had a minimum of 0.32 ± 0.02 between 5 and 305 DIM (Figure 4). Milk ˆb* was genetically positively correlated with ˆL* (0.31 ± 0.08 to 0.74 ± 0.02 at 5 and 293 DIM, respectively), milk fat concentration (0.82 ± 0.03 to 0.96 ± 0.01 at 5 and 305 DIM, respec-tively), and milk protein concentration (0.58 ± 0.06 to 0.83 ± 0.01 at 8 and 305 DIM, respectively; Figure 11). Negative genetic correlations existed between ˆb* and ˆa* (−0.47 ± 0.07 to 0.01 ± 0.07 at 10 and 297 DIM, re-spectively), milk yield (−0.62 ± 0.02 to −0.45 ± 0.05 at 220 and 14 DIM, respectively), and milk lactose concentration (−0.43 ± 0.04 to −0.08 ± 0.04 at 305 and 62 DIM, respectively; Figure 11).
DISCUSSION
The objective of the present study was to quantify the contribution of cow-level genetic and nongenetic factors to the observed variability in predicted milk color as described by lightness (L*), greenness-redness (a*), and blueness-yellowness (b*) indices. The prac-tical implication from this research is to understand, and therefore predict, the possible future changes in milk color (e.g., with stage of lactation) and therefore facilitate action (e.g., at the processor level) to ame-liorate the change in developed products to suit the expected milk color. For example, different markets demand dairy products (e.g., milk, cheese, and butter) differing in color (Morris et al., 2002; Descalzo et al., 2012). Results from the present study clearly identified genetic and nongenetic factors strongly associated with all 3 aspects of milk color. Of particular interest was the existence of considerable genetic variability in each of the 3 color parameters; coupled with the ability to predict the parameters from milk MIRS (McDermott et al., 2016), this suggests that breeding programs to alter milk color are possible.
Cows included in the present study originated from Irish herds only where the basal diet of the cows was grazed grass, reflective of the production system in Ire-land. Mean L*, a*, and b* indices in the present study were slightly different from results reported by Solah et al. (2007) based on Holstein-Friesian cows in Western Australia. These differences were expected as Solah et Figure 4. Within-trait genetic correlations between 5 DIM (––□––),
150 DIM (––◆––), and 305 DIM (––△––) and the rest of lactation for predicted (A) lightness
( )
L*ˆ , (B) redness/greenness ( )ˆa* , and (C) yel-lowness/blueness( )
ˆ .b* Standard errors ranged between 0.00 and 0.02.Figure 5. Genetic correlations (SE in parentheses) between predicted lightness
( )
ˆL* and predicted redness/greenness (a*;ˆ ––□––; 0.04 to 0.08), predicted yellowness/blueness (b*;ˆ ––◆––; 0.01 to 0.08), milk yield (––△––; 0.02 to 0.06), protein concentration (––●––; 0.01 to 0.07), fat con-centration (––×––; 0.01 to 0.09), lactose concon-centration (––∗––; 0.02 to 0.10), urea concentration (––+––; 0.03 to 0.11), and log10(SCC/1,000)(––■––; 0.05 to 0.17).
Figure 6. Least squares means of predicted redness/greenness ( ) values throughout lactation in parity 1 (––ˆa* ◆––), parity 2 (- -■- -), parity 3 (––▲––), parity 4 (––X––), and parity ≥5 (-·-X-·-; average SE = 0.01).
Figure 7. Genetic correlations (SE in parentheses) between predicted redness/greenness ( ) and predicted yellowness/blueness ˆa* (b*;ˆ ––◆––; 0.04 to 0.07), milk yield (––△––; 0.06 to 0.11), protein concentration (––●––; 0.03 to 0.08), fat concentration (––×––; 0.04 to 0.08), lactose concentration (––∗––; 0.04 to 0.10), urea concentration (––+––; 0.05 to 0.11), and log10(SCC/1,000) (––■––; 0.07 to 0.16).
Figure 8. Least squares means of predicted yellowness/blueness
( )
ˆb* values throughout lactation in parity 1 (––◆––), parity 2 (- -■- -), par-ity 3 (––▲––), parpar-ity 4 (––X––), and parpar-ity ≥5 (-·-X-·-; average SE = 0.05).Figure 9. Least squares means of predicted yellowness/blueness
( )
ˆb* values throughout lactation in parity 1 (––◆––), parity 2 (- -■- -), par-ity 3 (––▲––), parpar-ity 4 (––X––), and parpar-ity ≥5 (-·-X-·-), with milk yield included as a covariate in the model (fixed milk yield = 13.44 kg, aver-age SE = 0.04).Figure 10. Least squares means of predicted yellowness/blueness
( )
ˆb* values throughout lactation in parity 1 (––◆––), parity 2 (- -■- -), parity 3 (––▲––), parity 4 (––X––), and parity ≥5 (-·-X-·-), with fat concentration included as a covariate in the model (fixed fat concentration = 4.61%, average SE = 0.03).al. (2007) reported milk fat color or butter color instead of milk color, like in the present study.
Nongenetic Factors Associated with Milk Color
Many studies have heretofore reported associations between parity, stage of lactation, and sometimes their interaction on a range of milk-production-related traits such as milk yield (Sklan et al., 1994), fat and protein concentration (Morris et al., 2002; Jadhav et al., 2008), and SCC (Quist et al., 2008) in dairy cows. Based on the results from the present study, obvious differences among parities and lactation stages also exist for milk color corroborated by a change in the associated cor-relations among traits by stage of lactation and parity. The time of milking as well as milking frequency have both been documented to affect milk yield (Everett and Wadell, 1970; Gilbert et al., 1973; Erdman and Varner, 1995) and milk composition not only in terms of milk fat and protein concentration (Quist et al., 2008) but also fatty acid profile (Klei et al., 1997; Ferlay et al., 2010) in dairy cows as well as in dairy ewes (Ploumi et al., 1998).
The present study corroborated the difference in milk color traits between morning and evening milk. The combination of both greater milk yield (Ouweltjes, 1998) and reduced milk fat concentration (Quist et al., 2008) in morning milk is a reasonable explanation of a less yellow milk color of morning milk. The adjustment
for fat concentration and milk yield had an effect on ˆb* value even in this case, where morning milk had higher values than evening milk supporting the strong correla-tion between ˆb* and milk fat concentracorrela-tion.
Feeding and herd management, in terms of pasture grazing period, were reported to have a large influence on milk composition, especially on milk β-carotene amount (Noziere et al., 2006; Agabriel et al., 2007) and milk fatty acid composition (Descalzo et al., 2012). Milk ˆL* and ˆb* increased in colder months (October, November, and December) in the present study, which is in agreement with the higher milk color intensity in cooler seasons reported by Walker et al. (2013). Sea-sonal variation causes a variation in grazing pasture composition (Hutton et al., 1969; Hall, 1970), and this is probably the cause of milk composition variation and eventually in milk color traits. Another factor associ-ated with milk color traits is udder health, as suggested by Viguier et al. (2009) who reported more reddish color of bovine milk in the presence of clinical mastitis. Such a result is consistent with the correlation between SCC (and log10SCC) and a* at both the phenotypic and genetic level.
Genetics of Milk Color
To our knowledge, no studies have documented het-erosis and recombination loss effects on milk color. In the present research, neither heterosis nor recombina-Figure 11. Genetic correlations (SE in parentheses) between predicted yellowness/blueness
( )
ˆb* and milk yield (––△––; 0.02 to 0.06), protein concentration (––●––; 0.01 to 0.06), fat concentration (––×––; 0.01 to 0.03), lactose concentration (––∗––; 0.02 to 0.09), urea concentration (––+––; 0.03 to 0.10), and log10(SCC/1,000) (––■––; 0.04 to 0.18).tion loss among breeds had any significant effect on milk color in spite of observed breed effects. Heterosis effect was also analyzed for color traits considering both the adjustment for fat concentration and milk yield, but heterosis values were still not significant. The observed significant breed effect on milk color corrobo-rates previous studies (Winkelman et al., 1999; Berry et al., 2009); the milk of Jersey cows had the highest ˆb* values, even after adjusting for fat concentration. This could be physiologically explained by both the ability of the cow to convert carotene into vitamin A (Jadhav et al., 2008) as well as the higher fat concentration present in Jersey milk relative to Friesian (Auldist et al., 2004), Holstein (Morales et al., 2000), Montbeliarde (Soyeurt et al., 2006), and Norwegian Red (as previ-ously reported) cows.
With the exception of the ˆa* parameter, the herita-bility estimates for milk color did change throughout lactation with a tendency to reflect the trend in genetic variance over DIM. Nonetheless, the heritability of the 3 milk color parameters estimated in the present study agreed with previous studies that considered milk color and fat color in dairy cows (Winkelman et al., 1999) as well as milk carotenoid concentration in both milk and milk fat of dairy cows (Morris et al., 2002). The less precise heritability and repeatability estimates (i.e., large SE) calculated using the repeatability model for the reference values is likely due to the lower sample size of the set with reference values of milk color traits, in comparison with the predicted values (Table 1). The increasing daily heritability estimates as the lactation progressed, estimated using the random regression model, is probably due to (1) the mathematical proper-ties of Legendre polynomials (Meyer, 1998), which can overestimate (or underestimate) the genetic variance at the peripheries of the parameter space, and (2) the fewer test-day records toward the end of the lactation (Supplemental Figure S1; https://doi.org/10.3168/ jds.2016-11683). In the present study, the larger herita-bility estimates at the end of lactation was due to in-flated estimates of the respective genetic variance. The coefficient of variation for all 3 color traits estimated using the repeatability model was, however, small (0.37 to 6.88% for the predicted traits) and less than for the other performance traits, such as milk yield (9.81%). Nonetheless, the high heritability indicates that rela-tively few records are required to achieve high accuracy of selection for these traits, but the lack of considerable genetic variation suggests that actually achieving ge-netic gain may prove difficult. This could be exacer-bated by the presence of a moderate negative genetic correlation averaged across all DIM (Table 6) between milk yield and both ˆL* (−0.54) and ˆb* (−0.56), mani-festing itself as a requirement to place emphasis on
both milk color parameters to avoid any change in milk color as a repercussion of selection for greater milk yield as exists in most breeding goals (Miglior et al., 2005). The moderate to strong within-trait genetic cor-relations between each pairwise DIM, as well as the relatively consistent estimated genetic correlations with all performance traits at the same DIM suggest that there would be minimal loss of information by assum-ing a repeatability model for the analysis of milk color. The negative genetic correlation between the ˆb* (yellow-blue) index and milk yield, which remained relatively consistent across all DIM, agrees with previ-ous studies (Winkelman et al., 1999; Morris et al., 2002) and could be an artifact of dilution of color with great-er milk yield. The hgreat-eritability and genetic standard deviation for ˆb* estimated using a repeatability animal model that was phenotypically adjusted for milk yield was 0.33 (SE = 0.02) and 0.36 (SE = 0.01), respec-tively, indicating a reduction in genetic variability in ˆb* phenotypically independent of milk yield. The coeffi-cient of genetic variation for ˆb* following genetic adjust-ment for differences in milk yield was 6.53% (i.e., 94% of the origin genetic variation). Using the heritability and repeatability estimates from the repeatability ani-mal model, each genetic standard deviation unit in-crease in milk yield through breeding for milk yield alone is expected to reduce ˆb* by 0.19. Therefore to hold the ˆb* color of milk constant following single trait selection on milk yield would require a relative empha-sis of 33% on milk ˆb* color; the gain in milk yield with such an index would be 0.81 times that of the gain in milk yield where only milk yield constituted the breed-ing goal. Hence, attempts to halt any change in milk color due to breeding programs for increased milk pro-duction may require milk color to be included in the breeding goal with some emphasis that will have reper-cussions in genetic gain for milk yield and other traits in the breeding goal.
Table 6. Average genetic correlations calculated by random regression models between the 3 predicted color traits [lightness (ˆ )L* , redness/ greenness (ˆ )a* , and yellowness/blueness (ˆ )]b* and milk yield; concentrations of protein, fat, lactose, urea, and casein; and log10(SCC/1,000) Item ˆL* ˆa* ˆb* ˆa* 0.32 ˆb* 0.66 −0.19 Milk yield −0.54 −0.08 −0.56 Fat 0.70 −0.17 0.91 Protein 0.77 −0.12 0.71 Lactose −0.10 −0.32 −0.21 Urea −0.14 −0.14 0.10 log10(SCC/1,000) 0.11 0.25 −0.01 Casein 0.76 −0.14 0.70
The very strong positive genetic correlation averaged across all DIM between yellow color (b*ˆ index) and milk fat concentration (0.91) mirrored the respective strong phenotypic correlation obtained both between gold standard (0.64) and predicted (0.77) values. The strong correlation also corroborates previous genetic studies in dairy cows (Winkelman et al., 1999; Morris et al., 2002). The biological justification for such a strong cor-relation could be due to the presence of β-carotene pig-ment in milk fat components (MacGibbon and Taylor, 2006; Noziere et al., 2006), which also affect milk color. Carotenoid pigments are particularly high in fresh grass, which was the basal diet of the cows in the pres-ent study. The low coefficipres-ent of genetic variation of b* parameters after the genetic adjustment for milk fat concentration implies minimal scope to alter milk b* color genetically independent of genetic merit for milk fat concentration.
CONCLUSIONS
Milking time, stage of lactation, Jersey proportion, parity, and month of test were associated with all 3 characteristics of milk color. Heterosis and recombi-nation loss coefficients, as well as the proportions of Montbeliarde, Norwegian Red, and Friesian, had little biological effect on the color of bovine milk. Of particu-lar interest was the potential to breed for different milk color depending on the respective market demands, al-though the heritability for most of the milk color traits was not high. The genetic variation was relatively small, especially that independent of fat concentration. This therefore suggests that although the accuracy selection is achievable, the ability to rapidly alter milk color independent of fat concentration is somewhat limited.
ACKNOWLEDGMENTS
Funding from European Union (Brussels, Belgium) project LowInputBreed and Breed Quality, and labo-ratory technical support by Bernard Corrigan, Jim Flynn, Paula O’Connor, and Owen Kenny (Teagasc, Moorepark, Fermoy, Co. Cork, Ireland) are gratefully acknowledged.
REFERENCES
Agabriel, C., A. Cornu, C. Journal, C. Sibra, P. Grolier, and B. Mar-tin. 2007. Tanker milk variability according to farm feeding prac-tices: Vitamins A and E, carotenoids, color, and terpenoids. J. Dairy Sci. 90:4884–4896.
Auldist, M. J., K. A. Johnston, N. J. White, W. P. Fitzsimons, and M. J. Boland. 2004. A comparison of the composition, coagulation characteristics and cheesemaking capacity of milk from Friesian and Jersey dairy cows. J. Dairy Res. 71:51–57.
Berry, S. D., S. R. Davis, E. M. Beattie, N. L. Thomas, A. K. Burrett, H. E. Ward, A. M. Stanfield, M. Biswas, A. E. Ankersmit-Udy, P. E. Oxley, J. L. Barnett, J. F. Pearson, Y. van der Does, A. H. K. MacGibbon, R. J. Spelman, K. Lehnert, and R. G. Snell. 2009. Mutation in bovine β-carotene oxygenase 2 affects milk color. Ge-netics 182:923–926.
Brereton, R. G. 2015. The Mahalanobis distance and its relationship to principal components scores. J. Chemometr. 29:143–145. Calderón, F., B. Chauveau-Duriot, B. Martin, B. Graulet, M. Doreau,
and P. Nozière. 2007. Variations in carotenoids, vitamins A and E, and color in cow’s plasma and milk during late pregnancy and the first three months of lactation. J. Dairy Sci. 90:2335–2346. Clydesdale, F. M. 1993. Color as a factor in food choice. Crit. Rev.
Food Sci. Nutr. 33:83–101.
De Marchi, M., V. Toffanin, M. Cassandro, and M. Penasa. 2014. Invited review: Mid-infrared spectroscopy as phenotyping tool for milk traits. J. Dairy Sci. 97:1171–1186.
Descalzo, A. M., L. Rossetti, R. Páez, G. Grigioni, P. T. García, L. Costabel, L. Negri, L. Antonacci, E. Salado, G. Bretschneider, G. Gagliostro, E. Comerón, and M. A. Taverna. 2012. Differential Characteristics of milk produced in grazing systems and their im-pact on dairy product. Pages 339–368 in Milk Production – Ad-vanced Genetic Traits, Cellular Mechanism, Animal Management and Health, INTEC open access. Accessed Apr. 30, 2016. http:// citeseerx.ist.psu.edu/viewdoc/download?doi=10.1.1.452.9827&rep
=rep1&type=pdf.
Erdman, R. A., and M. Varner. 1995. Fixed yield responses to in-creased milking frequency. J. Dairy Sci. 78:1199–1203.
Espada, E., and H. Vijverberg. 2002. Milk colour analysis as a tool for the detection of abnormal milk. Pages 28–38 in North American Conference on Robotic Milking. Wageningen Press, Wageningen, the Netherlands.
Everett, R. W., and L. H. Wadell. 1970. Sources of variation affecting the difference between morning and evening daily milk production. J. Dairy Sci. 53:1424–1429.
Falconer, D. S., and T. F. C. MacKay. 1996. Introduction to Quantita-tive Genetics. 4th ed. Longman Group Ltd., London, UK. Ferlay, A., B. Martin, S. Lerch, M. Gobert, P. Pradel, and Y. Chilliard.
2010. Effects of supplementation of maize silage diets with extrud-ed linseextrud-ed, vitamin E and plant extracts rich in polyphenols, and morning v. evening milking on milk fatty acid profiles in Holstein and Montbeliarde cows. Animal 4:627–640.
Fisher, T. M., A. R. Gilmour, and J. H. J. van der Werf. 2004. Com-puting approximate standard errors for genetic parameters de-rived from random regression models fitted by average information REML. Genet. Sel. Evol. 36:363–369.
Fletcher, D. L. 1999. Broiler breast meat color variation, pH, and tex-ture. Poult. Sci. 78:1323–1327.
Gilbert, G. R., G. L. Hargrove, and M. Kroger. 1973. Diurnal varia-tions in milk yield, fat yield, milk fat percentage, and milk protein percentage of Holstein-Friesian cows. J. Dairy Sci. 56:409–410. Gilmour, A. R., B. R. Cullis, S. J. Welham, and R. Thompson. 2011.
ASREML Reference Manual. VSN International Ltd., Hemel Hempstead, UK.
Hall, R. L. 1970. Pasture development in spear grass region at West-wood in the Fitzroy basin. Trop. Grassl. 4:77–84.
Hutton, K., R. C. Seeley, and D. G. Armstrong. 1969. The variation throughout a year in the fatty acid composition of milk fat from 2 dairy herds. J. Dairy Res. 36:103–113.
Jadhav, B. S., M. B. Kulkarni, and K. D. Chavan. 2008. Effect of lac-tation order and stage of laclac-tation on physical properties of milk. J. Dairy. Foods Home Sci. 27:168–174.
Klei, L. R., J. M. Lynch, D. M. Barbano, P. A. Oltenacu, A. J. Lednor, and D. K. Bandler. 1997. Influence of milking three times a day on milk quality. J. Dairy Sci. 80:427–436.
Liu, Y., B. G. Lyon, W. R. Windham, C. E. Realini, T. D. D. Pringle, and S. Duckett. 2003. Prediction of color, texture, and sensory characteristics of beef steaks by visible and near infrared reflec-tance spectroscopy. A feasibility study. Meat Sci. 65:1107–1115.
MacGibbon, A. K. H., and M. W. Taylor. 2006. Composition and structure of bovine milk lipids. Pages 1–42 in Advanced Dairy Chemistry. Vol. 2. 3rd ed. Springer US, New York, NY.
McDermott, A., G. Visentin, S. McParland, D. P. Berry, M. A. Fe-nelon, and M. De Marchi. 2016. Effectiveness of mid-infrared spec-troscopy to predict the color of bovine milk and the relationship between milk color and traditional milk quality traits. J. Dairy Sci. 99:3267–3273.
Meyer, K. 1998. Estimating covariance functions for longitudinal data using a random regression model. Genet. Sel. Evol. 30:221–240. Miglior, F., B. L. Muir, and B. J. Van Doormaal. 2005. Selection
in-dices in Holstein cattle of various countries. J. Dairy Sci. 88:1255– 1263.
Morales, M. S., D. L. Palmquist, and W. P. Weiss. 2000. Milk fat composition of Holstein and Jersey cows with control or deplet-ed copper status and fdeplet-ed whole soybeans or tallow. J. Dairy Sci. 83:2112–2119.
Morris, C. A., T. W. Knight, S.-A. N. Newman, S. M. Hickey, A. F. Death, K. T. O’Neill, and M. Ridland. 2002. Genetic studies of carotenoid concentration in the plasma and milk of New Zealand dairy cattle. N. Z. J. Agric. Res. 45:27–33.
Noziere, P., B. Graulet, A. Lucas, B. Martin, P. Grolier, and M. Doreau. 2006. Carotenoids for ruminants: From forages to dairy products. Anim. Feed Sci. Technol. 131:418–450.
Ouweltjes, W. 1998. The relationship between milk yield and milking interval in dairy cows. Livest. Prod. Sci. 56:193–201.
Phillips, L. G., M. L. McGiff, D. M. Barbano, and H. T. Lawless. 1995. The influence of fat on the sensory properties, viscosity, and color of lowfat milk. J. Dairy Sci. 78:1258–1266.
Ploumi, K., S. Belibasaki, and G. Triantaphyllidis. 1998. Some factors affecting daily milk yield and composition in a flock of Chios ewes. Small Rumin. Res. 28:89–92.
Quist, M. A., S. J. LeBlanc, K. J. Hand, D. Lazenby, F. Miglior, and D. F. Kelton. 2008. Milking-to-milking variability for milk yield, fat and protein percentage, and somatic cell count. J. Dairy Sci. 91:3412–3423.
Sklan, D., M. Kaim, U. Moallem, and Y. Folman. 1994. Effect of dietary calcium soaps on milk yield, body weight, reproductive
hormones, and fertility in first parity and older cows. J. Dairy Sci. 77:1652–1660.
Solah, V. A., V. Staines, S. Honda, and H. A. Limley. 2007. Measure-ment of milk color and composition: Effect of dietary intervention on western Australian Holstein-Friesian cow’s milk quality. J. Food Sci. 72:S560–S566.
Soyeurt, H., P. Dardenne, A. Gillon, C. Croquet, S. Vanderick, P. Mayeres, C. Bertozzi, and N. Gengler. 2006. Variation in fatty acid contents of milk and milk fat within and across breeds. J. Dairy Sci. 89:4858–4865.
VanRaden, P. M., and A. H. Sanders. 2003. Economic merit of cross-bred and purecross-bred US dairy cattle. J. Dairy Sci. 86:1036–1044. Viguier, C., S. Arora, N. Gilmartin, K. Welbeck, and R. O’Kennedy.
2009. Mastitis detection: Current trends and future perspectives. Trends Biotechnol. 27:486–493.
Visentin, G., A. McDermott, S. McParland, D. P. Berry, O. A. Kenny, A. Brodkorb, M. A. Fenelon, and M. De Marchi. 2015. Prediction of bovine milk technological traits from mid-infrared spectroscopy analysis in dairy cows. J. Dairy Sci. 98:6620–6629.
Visentin, G., M. Penasa, P. Gottardo, M. Cassandro, and M. De Mar-chi. 2016. Predictive ability of mid-infrared spectroscopy for major mineral composition and coagulation traits of bovine milk by us-ing the uninformative variable selection algorithm. J. Dairy Sci. 99:8137–8145.
Wadhwani, R., and D. J. McMahon. 2012. Color of low-fat cheese influences flavor perception and consumer liking. J. Dairy Sci. 95:2336–2346.
Walker, G. P., C. Wijesundera, F. R. Dunshea, and P. T. Doyle. 2013. Seasonal and stage of lactation effects on milk fat composition in northern Victoria. Anim. Prod. Sci. 53:560–572.
Winkelman, A. M., D. L. Jonhson, and A. K. H. MacGibbon. 1999. Estimation of heritabilities and correlations associated with milk color traits. J. Dairy Sci. 82:215–224.
Zhang, X., B. Kong, and Y. L. Xiong. 2007. Production of cured meat color in nitrite-free Harbin red sausage by Lactobacillus fermen-tum fermentation. Meat Sci. 77:593–598.