FACULTY OF AGRICULTURAL SCIENCES
Institute for Agricultural Engineering
University of Hohenheim
Livestock Systems Engineering
apl. Prof. Dr. habil. Matthias Schick
Measuring grazing behaviour of dairy cows:
Validation of sensor technologies and assessing
application potential in intensive pasture-based milk
production systems
Dissertation
Submitted in fulfilment of the regulations to acquire the degree
"Doktor der Agrarwissenschaften" (Dr.sc.agr. in Agricultural Sciences)
to the
Faculty of Agricultural Sciences
Presented by
Jessica Anna Werner
Schorndorf
This thesis was accepted as a doctoral thesis (Dissertation) in fulfillment of the regulations to acquire the doctoral degree "Doktor der Agrarwissenschaften” by the Faculty of Agricultural Sciences at University of Hohenheim on 11.07.2018.
Date of the oral examination: 07.12.2018
Examination Committee:
Chairperson of the oral examination: Supervisor and Reviewer:
Co-Reviewer:
Additional examiner: Dean:
Prof. Dr. M. Rodehutscord apl. Prof. Dr. M. Schick Prof. Dr. M. Rutter apl. Prof. Dr. E. Gallmann Prof. Dr. R. Vögele
All rights reserved. No part of this publication may be reproduced, stored in a retrieval system, or transmitted, in any form or by any means, electronic, mechanical, photocopying, recording or otherwise, without the prior permission of the publishers.
© 2018
Published by the author: Source of supply:
Jessica Anna Werner Universität Hohenheim
Institute for Agricultural Engineering Garbenstraße 9
D-70599 Stuttgart opus.uni-hohenheim.de
A DREAM written down with a date, becomes a GOAL
A GOAL broken down into steps becomes a PLAN
A PLAN backed by ACTION
becomes REALITY
Dedicated to My family
TABLE OF CONTENTS
SUMMARY 1
ZUSAMMENFASSUNG 3
CHAPTER 1: GENERAL INTRODUCTION 6
AIMS OF RESEARCH 14
CHAPTER 2: Evaluation of the RumiWatchSystem for measuring grazing behaviour of cows
19
CHAPTER 3: Evaluation and application potential of an accelerometer-based collar device for measuring grazing behavior of dairy cows
57
CHAPTER 4: Identification of possible cow grazing behaviour indicators for restricted grass availability in a pasture-based spring calving dairy system
89
CHAPTER 5: GENERAL DISCUSSION 118
GENERAL CONCLUSION 130
ACKNOWLEDGEMENTS 134
CURRICULUM VITAE 135
1 SUMMARY
Grazing is the natural feed intake behaviour of a cow. However, in the last century, intensive confinement systems with silage feeding and concentrate supplementation have replaced many extensive pasture-based milk production systems. Grazed grass is now acknowledged as the cheapest feed available as a consequence of rising machinery, labour and feeding costs. Thus there is a renewed interest in intensive pasture-based milking systems. In addition, policy objectives, societal expectations and environmental concerns have all supported reconsiderations for pasture-based milk production.
Novel technology to aid measuring and managing grassland and cow grazing behaviour have the potential to facilitate improved performance. Until recently, sensor technologies for dairy farms were mainly developed for measuring feeding behaviour of housed cows. Adapting and calibrating these technologies to grazing context would therefore further support improved pasture-based dairying.
In this thesis, two sensor technologies were validated against visual observation. The RumiWatch noseband sensor (Itin+Hoch, Switzerland) is a high precision technology designed for research applications. It can measure detailed grazing behaviour such as grazing bites, rumination chews, time spent grazing and time spent ruminating. The MooMonitor+ (Dairymaster, Ireland) is the second technology assessed in this thesis. It is a collar based accelerometer and is primarily designed for use on commercial farms. The initial development was for oestrus detection. It can now monitor grazing and rumination times. The results of the studies reported in this thesis revealed that both sensors were highly accurate compared to visual observation.
The implementation of sensor technology on commercial dairy farms is still slow. This is especially true on pasture-based dairy systems. The management of grazing cows is thus largely not supported by technology.
2
With increasing herd sizes and skilled labour shortages, sensor technology to support grazing management will likely improve some major dairy farm management challenges. A key factor in pasture-based milk production is the correct grass allocation to maximize the grass utilization per cow. Cow behaviour is indicative of the quantity and quality of feed available as well as animal performance, health and welfare. Thus, the measurement of cow grazing behaviour is an important management indicator.
A further study of detailed individual grazing behaviour aimed to identify behavioural indicators of restricted versus sufficient availability of grass. Such objective measurement has potential since currently grass allocation is based on subjective eye measurements and calculations per herd. To identify behavioural indicators, a group of 30 cows in total were allocated a restricted pasture allowance of 60 % of their intake capacity. Their behavioural characteristics were compared to those of 10 cows with pasture allowance of 100 % of their intake capacity. The grazing behaviour and activity of cows was measured using the RumiWatchSystem, consisting of the noseband sensor and pedometer. The results showed that bite frequency was continuously higher for cows with a restricted grass allocation, but also rumination behaviour was affected by the restriction. This study contributes vital information towards developing a decision support tool for automated allocation of grass based on feedback from individual cows rather than herd based measurements.
Further research activities should focus on identification of significant changes in grazing behaviour of cows at individual animal and herd level. This would allow implementation of specific thresholds to be used in decision support tools. After developing and validating the decision support tools, the application of automated solutions for grazing management can improve efficiency and productivity of pasture-based milk production systems.
3 ZUSAMMENFASSUNG
Im letzten Jahrhundert entwickelten sich Milchproduktionssysteme von einer extensiven Weidehaltung zu einer intensiven Stallhaltung mit silagebasierter Grundfutterration und Zufütterung von Kraftfutter. Das Interesse an der Weidehaltung wächst heutzutage aber wieder, da Weidegras auf Grund von gestiegenen Kosten für Maschinen, Futter sowie Lohnkosten die billigste Futtergrundlage darstellt. Außerdem ist das natürliche Futteraufnahmeverhalten von Kühen das Grasen auf der Weide. Nicht nur ökonomische Gründe begünstigen die Entwicklung der Weidehaltung, sondern auch im Bereich der Verbraucherakzeptanz, Einflüsse auf die Umwelt und politischen Anpassungen birgt die weidebasierte Milchproduktion im Vergleich zur intensiven Stallhaltung Vorteile. Außerdem begünstigt die digitale Revolution mit der Integration von sensorbasierten Technologien für das Betriebsmanagement die mögliche Intensivierung im Bereich weideland-basierter Milchproduktion. Ein effizientes und profitables Betriebsmanagement lässt sich nicht nur durch eine technisierte Unterstützung in der Erfassung des Grasaufwuchses und des Weidemanagements umsetzen, sondern auch durch die Überwachung des tierindividuellen Weideverhaltens.
Ursprünglich wurden die sensorbasierten Technologien zur Erfassung des Fressverhaltens im Stall entwickelt. Jedoch unterscheidet sich das Futteraufnahmeverhalten der Kühe auf der Weide deutlich vom Stall. Deshalb müssen die Technologien an das spezifische Fressverhalten auf der Weide angepasst und kalibriert werden.
In dieser Arbeit werden zwei unterschiedliche Sensoren mit verschiedenen
Anwendungspotentialen im Vergleich zu visueller Beobachtung validiert. Der
Nasenbandsensor von RumiWatch ist ein höchstpräzises Messinstrument für wissenschaftliche Fragestellungen. Der Sensor kann detaillierte Parameter des Weideverhaltens erfassen, z.B. Fressbisse oder Wiederkauschläge sowie Fress- und Wiederkauzeit.
4
Der zweite Sensor, der MooMonitor+ (Dairymaster, Irland) beinhaltet eine praxisorientierte Aktivitätsmessung, die ursprünglich zur Brunsterkennung entwickelt wurde. Durch eine Weiterentwicklung der Rohdatenauswertung mittels Algorithmen ist es nun möglich auch Fress- und Wiederkaudauern aufzuzeichnen. Beide Validierungsstudien resultierten in einer hohen Übereinstimmung der automatischen Messung mit der Direktbeobachtung.
Die erfolgreiche Integration von softwareunterstützten Technologien auf der Betriebsebene sollte verbessert werden. Speziell im Bereich der Weidehaltung und des Weidemanagements sind wenig Technologien vorhanden. Steigende Tierzahlen und fehlende Arbeitskräfte könnten den Bedarf nach sensorbasierten Technologien zur Unterstützung des Weidemanagements begünstigen. Ein Hauptfaktor in der weidebasierten Milchproduktion ist die passende Zuteilung von bedarfsgerechter Weidefläche, um die Nutzung der Weide zu maximieren, sowie die Tierleistung zu optimieren. Das Fressverhalten der Kühe stellt hierbei eine wichtige Größe für Tierleistung, Gesundheit sowie Tierwohl dar. Ebenso kann das Weideverhalten die Futterqualität und Futterverfügbarkeit repräsentieren.
Die dritte Studie dieser Arbeit untersuchte deshalb, ob es mögliche Indikatoren im Fressverhalten von Kühen gibt, die eine unzureichende Futterverfügbarkeit aufzeigen. Die Zuteilung der Weidefläche basiert momentan auf subjektiven Erfahrungswerten der Betriebsleiter und wird auf Herdenebene kalkuliert. In einer dritten Studie der Arbeit wurden deshalb zur Bestimmung von spezifischen Verhaltensindikatoren insgesamt 30 Kühe mit 60 % ihres Futterbedarfs gefüttert, während 10 Tiere eine 100-%ige Futterzuteilung zur Verfügung hatten. Dabei wurde das RumiWatchSystem, bestehend aus dem Nasenbandsensor und dem Pedometer zur Verhaltensbeobachtung eingesetzt.
Die Ergebnisse der Studie zeigten, dass sich vor allem die Bissfrequenz durch eine begrenzte Futterverfügbarkeit erhöht sowie das Wiederkauverhalten beeinflusst wurde. Diese Studie stellt einen ersten Entwicklungsschritt in Richtung sensorunterstützte Entscheidungsgrundlage für
5
die automatische Zuteilung von Weideflächen dar. Es wäre von Vorteil, wenn diese Zuteilung in Zukunft auf tierindividuellen Messungen im Vergleich zur Herdenebene basieren würde. Weitere Forschungsansätze sollten sich auf der Identifizierung aussagekräftiger Schwellenwerte für das tierindividuelle Weideverhalten fokussieren, die dann in sensorgestützte Entscheidungshilfen implementiert werden können. Nach der Entwicklung und Validierung solcher Systeme könnte die Anwendung im Bereich Weidemanagement die Effizienz und Resilienz von weidebasierten Milchproduktionssystemen verbessern.
6 CHAPTER 1: GENERAL INTRODUCTION
Pasture grazing was evolutionary cows’ natural behaviour for feed intake. Changes in animal husbandry influenced the feeding of dairy cows in the last century from extensive grazing systems to intensive confinement systems with silage feeding and high concentrate input. However, recently there is a renewed interest in pasture-based milk production systems due to changes in the economy, increase in food demand and security and a stronger consumer awareness.
In order to ensure and maintain a high productivity of dairy cows on pasture as well as high standards of animal welfare, a sensor-based management support is needed. The advancement in sensor technology enables continuous measurement of behaviour for long-term periods, which is contrary to visual observation by the farmer as this can only be carried out over relatively short periods during the day. Consequently, the development of sensor technology has mainly focused on measuring feeding behaviour of cows indoors, thus the calibration and application of sensor technology for measuring grazing behaviour has not progressed to the same extent. This thesis is therefore validating two sensor systems for measuring grazing behaviour and assessing the application potential for commercial usage or research approaches. Furthermore, first investigations on the use of cow behaviour as an indicator of sufficient grass allocation were conducted. This would have potential to add value to existing grass measurement data in a grass allocation decision support tool.
7 Pasture-based milk production systems
During evolution humans realized that food security can be maintained with domesticating animals as a food source. Ruminants were especially focused on as they have an advantage of converting high fibrous feedstuff into milk or meat and would not compete against humans for food sources (van Wieren, 1996). However, in the last century the development of dairy husbandry changed. Extensive, mainly pasture-based milk production of small-scale dairy herds developed into larger scale intensive confinement systems (Pinxterhuis et al., 2015). Since around the mid-20th century, the mechanisation of agricultural production advanced significantly, which resulted in replacing human labour and reducing required time and costs for feed harvest, conservation, storage as well as ensuring daily feed provision indoors (Knaus, 2016). There were also other reasons for the uptake of intensive confinement systems for dairy cows. Breeding led to successful high-yielding cows, this resulted in a requirement to provide a consistent high nutritional diet to the cows, to prevent hunger and maintain their milk yields (Kolver and Muller, 1998). Furthermore, developments with regards to the uptake of robotic milking, limited land availability for pasture-based production and climatic factors including heat stress, adverse and unpredictable weather conditions supported the continuous housing of dairy cows in recent years (Arnott et al., 2017).
Nowadays dynamics of global agriculture are constantly changing due to the endless fluctuation of international food markets, policy changes nationally and internationally, greater societal expectations and environmental constraints (Hanrahan et al., 2018). Based on these factors there is a requirement for resilient sustainable agricultural systems. For milk production systems this might be achieved with increasing the proportion of grazed grass in the feed of dairy cows, as feed costs contribute around 50 % of the total costs of milk production (Hemme et al., 2014).
8
Given the versatility of global dairy husbandry systems, it is difficult to compare these systems. In Central Europe, dairy farming is mainly based on indoor-feeding due to the long dormancy period of vegetation in the winter (Hofstetter et al., 2014). However, there is an increased interest in pasture-based milk production (see as an example the Northern German “Charta Weideland”, written by agricultural and political organizations and stakeholders and is aiming to promote and maintain pasture-based milk production in North Germany).
Due to the digital revolution and the integration of new technologies into farming practices to increase production and reduce costs (Yahya, 2018), there is a possibility of intensification of pasture-based production. One example is the technical support of automated sensor systems in measuring and managing pasture production (Hanrahan et al., 2017). Despite the changes, only 10% of global milk production originates from intensive grazing systems of production similar to the traditional Irish system (Dillon 2017). This system is mostly prevalent in Ireland, New Zealand and parts of Australia. The Irish grazing system is based on a low input system with less concentrate and a seasonal spring calving system to meet feed demands with pasture grass during the main growth period. Grazed pasture is the dominant source of forage from March to October and usually contribute 95%-97% of the diet as fed in the summer period (O’Brien, personal communication).
There are distinct advantages of pasture-based milk production systems compared to high- input confinement systems. A review of Dillon et al. (2005) revealed that pasture-based milk production can decrease unit production costs through lower feed and labour expenses. In total, the confinement production systems have higher milk output per cow, but also higher costs. Grazing systems can also be associated with greater global sustainability. Some aspects of greater global sustainability are mentioned by Dillon et al. (2005) with reduced use of fuel, herbicides and pesticides.
9
From an animal welfare perspective, pasture-based milk production systems are beneficial to allow the cows to express natural behaviour (Charlton and Rutter, 2017) and improve health issues, such as lameness prevalence (EFSA 2009). Also consumer interest in food production is rising and a study of Weinrich et al. (2014) revealed that consumers have a preference for milk production from pasturing cows.
However, there are also some challenges associated with pasture-based systems. A proportional increase in required land to graze the cows, which is easily accessible from the milking parlour, is needed to facilitate the increased herd sizes (van den Pol et al., 2008). Subsequently, increased area of land around the farm also increases the walking distance to the paddocks. This might have negative effects on cow claws health (Laven and Lawrence, 2006) as well as an increased labour demand associated with herding the cows to and from the pasture (Ofner-Schröck et al. 2009). Depending on prevalent climatic conditions and location of individual farms, the intensive pasture-based milk production system can be challenging, as approx. 1000 mm of rainfall (evenly distributed throughout the year) is ideally required (Dillon et al., 2005). The objective of grass-based systems is to match the supply of feed with feed demand at the lowest cost possible. However, the correct calculation and allocation of grass to the cows can be challenging. It depends on grass growth, grass quality and grass utilization of cows. McCarthy et al. (2011) also mentioned that the balance between feed supply and demand is critical as an imbalance will result in either underfeeding of the herd or waste of excess feed and that will result in reduced growth or reduced grass quality.
10
From an economic perspective, the profitability of grazing systems is driven by the degree of grass utilization (Shalloo et al., 2011). Therefore, French et al. (2015) are highlighting that the farmer requires accurate real-time measurement of pasture biomass to optimise grazing management. Contrary to the approach of assessing pasture biomass, there is the possibility of the integration of individual animal behaviour to gain additional information on optimal grazing management. Therefore, the development and application of sensor technology to measure grazing behaviour automatically would be beneficial.
11
Sensor development for measuring feeding behaviour
In previous years, the measurement of feeding behaviour was mostly based on visual observations or on video recordings. This is still considered as gold standard (Burfeind et al., 2011, Elischer et al., 2013). Although, the analysis and data collection with those methods is very time consuming. As a result there are a number of new approaches to develop automated sensors in the last two decades. The sensor technologies can be divided into different measurement methods. Some systems use electrical signal sensors (Beauchemin et al., 1989, Rutter et al., 1997) or pressure sensors to detect jaw movements (Dulphy et al., 1997). Büchel and Sundrum (2014) showed in their study, that it is suitable to use electromyography to measure electrical potential oscillation during jaw movements to determine feeding behaviour. The measurement of acceleration, as another option, is often used to define either locomotion activity (Alsaaod et al., 2015) or feeding behaviour (Delagarde et al., 2015). The position of those systems on a cow could be varying within head or neck collar devices, pedometers or even ear-mounted tags with an accelerometer integrated (Bikker et al., 2014, Borchers et al., 2016). Most commercially available systems use accelerometers to predict oestrus events (e.g. Heattime® by SCR Engineers, Netanya, Israel) and/or feeding behaviour (e.g. FeedPhone by Medria, Châteaubourg, France). Another method is acoustic monitoring to determine feeding behaviour (Tani et al., 2013). There are also systems, which can measure the access of cows to the feeding trough with an ear-attached passive transponder (DeVries et al., 2003).
Feeding behaviour differs between grazing cows and cows fed indoors with silage or total- mixed ration (TMR), which will be addressed in the next paragraph. Therefore, there is a calibration or adaptation of algorithms required, when sensor technology is used for measuring grazing behaviour.
12 Grazing behaviour versus feeding behaviour
Kilgour (2012) highlighted in his review, that cows have an extensive repertoire of behaviour, comprising 40 identifiable categories and 90-95 % of their time is spent with grazing, ruminating and resting, if there is little human interference. He also mentioned that grazing is the most common behaviour with two main grazing events per day. Furthermore, cows perform their grazing activities mostly during daytime with a longer and more intensive grazing event around dusk. This timing of grazing events classifies cows as crepuscular animals, and light plays a role in shaping daily grazing patterns (Gregorini et al., 2006). Grazing behaviour of cows is also influenced by other cues such as social herd structures, sward quality and grass palatability as well as herd management (Albright, 1993).
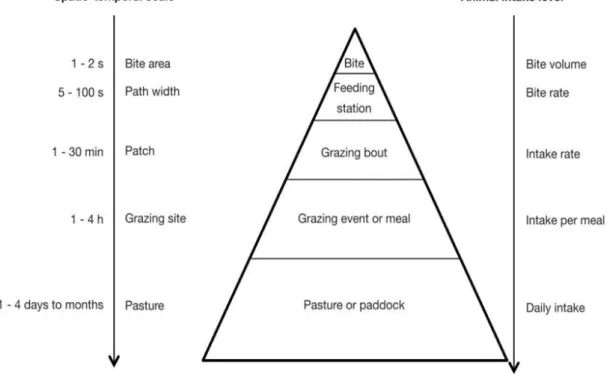
Based on a definition of Hodgson (1979) grazing is the “defoliation by animals of rooted plants in the field” and defoliation is defined as “the process of the complete or partial removal of the above-ground parts of the plants, living or dead”. In a bigger picture, Andriamandroso et al. (2016) defined the grazing activity based on studies of Gibb (1996), Gregorini et al. (2006), de Faccio Carvalho (2013) as a complex combination of various movements and activities in different spatial-temporal scales (see Figure 1).
Compared to grazing behaviour, the feeding behaviour of indoor cows may be considered different. Roca-Fernandez et al. (2013) found in their study, that cows in confinement systems spent less time feeding and the feeding time was spread throughout the day compared to two main events for grazing cows. With regards to the feed intake behaviour, the cows on pasture need to use the tongue to rip the grass, whereas in confinement systems the cows mainly eat by gathering the feed with the tongue and sucking it into the mouth (Albright, 1993). Depending on the feeding management, the feed for cows indoors is already mixed in TMR or the feed particles are relatively small, which may influence the feed intake behaviour of cows with regards to less biting action (Albright, 1993).
13
Furthermore, the cows on pasture naturally show a selective grazing behaviour based on preferences between the sward composition (Hodgson, 1979), whereas TMR type feed may be more consistent and the selection of feed is then more limited. Also with regard to the spatial aspect of grazing behaviour, the selective grazing that occurs over pasture does not occur over feed indoors, where the feeding trough or bunk is the only source of feed availability.
Physiological and behavioural differences in feed intake between cows on pasture and indoors may therefore influence the performance of automated measurement systems with regard to accurately measuring grazing behaviour.
Figure 1: Spatio-temporal components of grazing behavior after Andriamandroso et al. 2016
(adapted from Gibb, 1996; Gregorini et al., 2006; de Faccio Carvalho, 2013).
14 AIMS OF RESEARCH
The PhD thesis aimed to improve the performance and application potential of sensor technologies to measure grazing behaviour of dairy cows in a pasture-based milk production system.
The first step was to validate a previously calibrated sensor system to measure feeding behaviour indoors in a grazing environment. This sensor system had the ability to measure detailed grazing behaviour appropriate for research-focused purposes.
The second study evaluated a commercially applied sensor technology, developed for oestrus detection in pasture-based systems. The different application potentials of research focused and commercially used sensor technologies as well as end-user requirements was also investigated. The third paper aimed to apply the previously validated sensor system to identify potential indicators in cows grazing behaviour for insufficient grass allocation, which may be possible to be implemented in a decision support tools for grazing management.
15 REFERENCES
Albright, J. L. 1993. Feeding behaviour of dairy cattle. Journal of Dairy Science 76(2):485-498. Alsaaod, M., J. J. Niederhauser, G. Beer, N. Zehner, G. Schuepbach-Regula, and A. Steiner. 2015. Development and validation of a novel pedometer algorithm to quantify extended characteristics of the locomotor behavior of dairy cows. Journal of Dairy Science 98(9):6236-6242.
Andriamandroso, A., J. Bindelle, B. Mercatoris, and F. Lebeau. 2016. A review on the use of sensors to monitor cattle jaw movements and behavior when grazing. Biotechnologie, Agronomie, Société et Environnement = Biotechnology, Agronomy, Society and Environment 20.
Arnott, G., C. P. Ferris, and N. E. O'Connell. 2017. Review: welfare of dairy cows in continuously housed and pasture-based production systems. Animal 11(2):261-273.
Beauchemin, K. A., S. Zelin, D. Genner, and J. G. Buchanan-Smith. 1989. An Automatic System for Quantification of Eating and Ruminating Activities of Dairy Cattle Housed in Stalls. Journal of Dairy Science 72(10):2746-2759.
Bikker, J. P., H. van Laar, P. Rump, J. Doorenbos, K. van Meurs, G. M. Griffioen, and J. Dijkstra. 2014. Technical note: Evaluation of an ear-attached movement sensor to record cow feeding behavior and activity. Journal of Dairy Science 97(5):2974-2979.
Borchers, M., Y. Chang, I. Tsai, B. Wadsworth, and J. Bewley. 2016. A validation of technologies monitoring dairy cow feeding, ruminating, and lying behaviors. Journal of Dairy Science 99(9):7458-7466.
Büchel, S. and A. Sundrum. 2014. Technical note: Evaluation of a new system for measuring feeding behavior of dairy cows. Computers and Electronics in Agriculture 108:12-16.
Burfeind, O., K. Schirmann, M. A. von Keyserlingk, D. M. Veira, D. M. Weary, and W. Heuwieser. 2011. Evaluation of a system for monitoring rumination in heifers and calves. Journal of Dairy Science 94(1):426-430.
Charlton, G. L. and S. M. Rutter. 2017. The behaviour of housed dairy cattle with and without pasture access: A review. Applied Animal Behaviour Science 192:2-9.
de Faccio Carvalho, P. C. 2013. Harry Stobbs Memorial Lecture: Can grazing behavior support innovations in grassland management? Tropical Grasslands-Forrajes Tropicales 1(2):137-155.
Delagarde, R., J.-P. Lemonnier, A. Pol-van Dasselaar, H. Aarts, A. d. Vliegher, A. Elgersma, D. Reheul, J. Reijneveld, J. Verloop, and A. Hopkins. 2015. Accuracy of the FeedPhone device for recording eating and rumination times in dairy cows. Pages 203-205 in Proc. Grassland and forages in high output dairy farming systems. Proceedings of the 18th Symposium of the European Grassland Federation, Wageningen, The Netherlands, 15-17 June 2015. Wageningen Academic Publishers.
16
DeVries, T. J., M. A. G. von Keyserlingk, D. M. Weary, and K. A. Beauchemin. 2003. Technical Note: Validation of a System for Monitoring Feeding Behavior of Dairy Cows. Journal of Dairy Science 86(11):3571-3574.
Dillon, P. 2017. Irish dairying - Challenges and opportunities, Pages 7-9 in Open Day Proceedings. “Irish Dairying - Resilient Technologies” 4 July 2017, Teagasc, Moorepark, Ireland
Dillon, P., J. Roche, L. Shalloo, and B. Horan. 2005. Optimising financial return from grazing in temperate pastures. Pages 131-147 in Proc. Proceedings of a satellite workshop of the XXth international grassland congress. (Ed. JJ Murphy)
Dulphy, J., W. Martin-Rosset, H. Dubroeucq, J. Ballet, A. Detour, and M. Jailler. 1997. Compared feeding patterns in ad libitum intake of dry forages by horses and sheep. Livestock Production Science 52(1):49-56.
EFSA, Scientific report of EFSA prepared by the Animal Health and Animal Welfare Unit on the effects of farming systems on dairy cow welfare and disease. 2009. Annex EFSA J 1143:1–284
Elischer, M. F., M. E. Arceo, E. L. Karcher, and J. M. Siegford. 2013. Validating the accuracy of activity and rumination monitor data from dairy cows housed in a pasture-based automatic milking system. Journal of Dairy Science 96(10):6412-6422.
French, P., B. O'Brien, and L. Shalloo. 2015. Development and adoption of new technologies to increase the efficiency and sustainability of pasture-based systems. Animal Production Science 55(7):931-935. Gibb, M. 1996. Animal grazing/intake terminology and definitions. Pasture ecology and animal intake 3:21-37.
Gregorini, P., S. Tamminga, and S. A. Gunter. 2006. Behavior and Daily Grazing Patterns of Cattle. The Professional Animal Scientist 22(3):201-209.
Hanrahan, L., A. Geoghegan, M. O'Donovan, V. Griffith, E. Ruelle, M. Wallace, and L. Shalloo. 2017. PastureBase Ireland: A grassland decision support system and national database. Computers and Electronics in Agriculture 136:193-201.
Hanrahan, L., N. McHugh, T. Hennessy, B. Moran, R. Kearney, M. Wallace, and L. Shalloo. 2018 Factors associated with profitability in pasture-based systems of milk production. Journal of Dairy Science. 101(6):5474-5485
Hemme, T., M. M. Uddin, and O. A. Ndambi. 2014. Benchmarking cost of milk production in 46 countries. Journal of Reviews on Global Economics 3:254-270.
Hodgson, J. 1979. Nomenclature and definitions in grazing studies. Grass and Forage Science 34(1):11-17.
17
Hofstetter, P., H. J. Frey, C. Gazzarin, U. Wyss, and P. Kunz. 2014. Dairy farming: indoor v. pasture-based feeding. The Journal of Agricultural Science 152(06):994-1011.
Kilgour, R. J. 2012. In pursuit of "normal": A review of the behaviour of cattle at pasture. Applied Animal Behaviour Science 138(1-2):1-11.
Knaus, W. 2016. Perspectives on pasture versus indoor feeding of dairy cows. Journal of the Science of Food and Agriculture 96(1):9-17.
Kolver, E. and L. Muller. 1998. Performance and nutrient intake of high producing holstein cows consuming pasture or a total mixed ration1. Journal of Dairy Science 81(5):1403-1411.
Laven, R. and K. Lawrence. 2006. An evaluation of the seasonality of veterinary treatments for lameness in UK dairy cattle. Journal of Dairy Science 89(10):3858-3865.
McCarthy, B., L. Delaby, K. Pierce, F. Journot, and B. Horan. 2011. Meta-analysis of the impact of stocking rate on the productivity of pasture-based milk production systems. Animal 5(5):784-794. Ofner-Schröck, E., A. Preinerstorfer, A. Leithold, T. Guggenberger, G. Huber, B. Krimberger, S. Suchanek, D. Vockenhuber, B. Rudorfer and I. Zainer. 2009. Bericht über die Fragebogenerhebung zur Evaluierung der Wirkung und Akzeptanz der Tierschutzmaßnahme im österreichischen Programm für die Ländliche Entwicklung 07–13. Bundesministerium für Land- und Forstwirtschaft, Umwelt und Wasserwirtschaft, Vienna.
Pinxterhuis, J., M. Beare, G. Edwards, R. Collins, P. Dillon, and J. Oenema. 2015. Eco-efficient pasture based dairy farm systems: a comparison of New Zealand, The Netherlands and Ireland. Grassland Science in Europe 20:349-366.
Roca-Fernandez, A., C. Ferris, and A. Gonzalez-Rodriguez. 2013. Behavioural activities of two dairy cow genotypes (Holstein-Friesian vs. Jersey x Holstein-Friesian) in two milk production systems (grazing vs. confinement). Spanish Journal of Agricultural Research 11(1):120-126.
Rutter, S., R. Champion, and P. Penning. 1997. An automatic system to record foraging behaviour in free-ranging ruminants. Applied Animal Behaviour Science 54(2):185-195.
Shalloo, L., P. Creighton, and M. O'Donovan. 2011. The economics of reseeding on a dairy farm. Irish Journal of Agricultural and Food Research 50:113-122.
Tani, Y., Y. Yokota, M. Yayota, and S. Ohtani. 2013. Automatic recognition and classification of cattle chewing activity by an acoustic monitoring method with a single-axis acceleration sensor. Computers and Electronics in Agriculture 92:54-65.
van den Pol, A., T. V. Vellinga, A. Johansen, and E. Kennedy. 2008. To graze or not to graze, thats the question. Pages 706-716 in Proc. Proceedings of the 22nd. General Meeting of the European Grassland Federation, Uppsala, Sweden, 9-12 June, 2008.
18
van Wieren, S. E. 1996. Digestive strategies in ruminants and nonruminants. Van Wieren. ISBN 90-5485-611-4
Weinrich, R., S. Kühl, A. Zühlsdorf, and A. Spiller. 2014. Consumer attitudes in Germany towards different dairy housing systems and their implications for the marketing of pasture raised milk. International Food and Agribusiness Management Review 17(4):205-222.
Yahya, N. 2018. Agricultural 4.0: Its Implementation Toward Future Sustainability. Pages 125-145 in
19 CHAPTER 2
Evaluation of the RumiWatchSystem for measuring grazing behaviour of
cows
Werner, J.1,2, Leso, L.1,3, Umstatter, C.4, Niederhauser, J.5, Kennedy, E.1, Geoghegan, A.1,
Shalloo, L.1, Schick, M.4, O’Brien, B.1
1Teagasc, Animal & Grassland Research and Innovation Centre, Moorepark, Fermoy, Co. Cork, Ireland 2 University of Hohenheim, Institute for Agricultural Engineering, 70599 Stuttgart, Germany
3 University of Florence, Department of Agricultural, Food and Forestry Systems, 50145 Firenze, Italy 4 Agroscope, Research Division Competitiveness and System Evaluation, 8356 Ettenhausen, Switzerland 5 InnoClever GmbH, Tiergartenstrasse 7, 4410 Liestal, Switzerland
Published in: Journal of Neuroscience Methods, 300 (2018), 138-146 Status: published
20 Abstract
Feeding behaviour is an important parameter of animal performance, health and welfare, as well as reflecting levels and quality of feed available. Previously, sensors were only used for measuring animal feeding behaviour in indoor housing systems. However, sensors such as the RumiWatchSystem can also monitor such behaviour continuously in pasture-based environments. Therefore, the aim of this study was to validate the RumiWatchSystem to record cow activity and feeding behaviour in a pasture-based system. The RumiWatchSystem was evaluated against visual observation across two different experiments. The time duration per hour at grazing, rumination, walking, standing and lying recorded by the RumiWatchSystem was compared to the visual observation data in Experiment 1. Concordance Correlation Coefficient (CCC) values of CCC = 0.96 for grazing, CCC = 0.99 for rumination, CCC = 1.00 for standing and lying and CCC = 0.92 for walking were obtained. The number of grazing and rumination bouts within one hour were also analysed resulting in Cohen`s Kappa (κ) = 0.62 and κ = 0.86 for grazing and rumination bouts, respectively. Experiment 2 focused on the validation of grazing bites and rumination chews. The accordance between visual observation and automated measurement by the RumiWatchSystem was high with CCC = 0.78 and CCC = 0.94 for grazing bites and rumination chews, respectively. These results indicate that the RumiWatchSystem is a reliable sensor technology for observing cow activity and feeding behaviour in a pasture based milk production system, and may be used for research and management purposes in a grazing environment.
21 Introduction
With increasing scale on farms, and declining available labour, there is a requirement for technologies that assist farmers in their day to day management. Animal management involves ensuring the health and welfare of the animals; reacting to certain events in the animal reproductive cycle and improving efficiency in feed provision for conversion into an animal product, such as milk or meat. Especially in a pasture based system the balance between the feed offered and the herd demand needs to be optimized to maximise grass utilisation while simultaneously ensuring that animals are well fed at pasture. Shortage in labour and time to observe animals makes it difficult for farmers to monitor all animals intensely. Automated monitoring for quantifying physiological and behavioural parameters, e.g. oestrus, somatic cell count and feeding behaviour, can give an insight into overall health status, important animal events as well as helping with feeding management. For a continuous monitoring of these physiological and behavioural parameters sensor-based, easy-to-use tools for farmers need to be developed.
One of the best indicators of health and welfare of dairy cows is feeding behaviour. A study by Bareille et al. (2003) showed that feed intake was influenced by a number of different diseases such as milk fever, ketosis or hoof lesions. There is a benefit to detect emerging diseases earlier by monitoring the feeding behaviour of dairy cows automatically. Previous research has shown that a decline in rumination time can be used as a reliable predictor of both health and fertility events and is also mentioned to be an indicator for cow stress (Herskin et al., 2004). Feeding behaviour can also be used to optimise grassland management decisions with a focus on increasing animal intake and reducing grass residuals. It is of key importance to measure, manage and allocate accurately the feed available and offered to the cows, irrespective of the farming system in order to optimise farm efficiency and profitability.
22
The estimation of feed intake based on behavioural parameters, such as feeding time or bite frequency, provides valuable information that can be used to manage cows. Pahl et al. (2015) conducted a study in an indoor feeding system to compare feeding and chewing time with measured intake data obtained by weighing of the feeding troughs. They concluded that it was appropriate to use feeding behaviour for estimating intake in barn systems.
Some methods have been developed to predict intake in grass-based systems (Undi et al., 2008), such as the N-alkane-method (Dillon and Stakelum, 1988). This method determines the feed intake by the usage of an orally applied bolus with synthetic faeces marker. These measurements are labour-intensive, time-consuming and invasive, as the cows have to be dosed orally twice a day over a 2-week period. An alternative approach used to determine feed intake was the IGER animal recording system (Mezzalira et al., 2014). This consisted of a noseband sensor that measured jaw movement by electrical resistance (Rutter et al., 1997). It could identify and measure grazing and rumination. However, the maximum recording period of this system is 24 hours, and the analysis of the data via the “Graze software” is very laborious (Rutter, 2000). Furthermore, the distribution and commercial support for this technology has ceased in recent years. But a new technology, the RumiWatchSystem may have the potential to improve data capture and replace the IGER animal recording system.
The RumiWatchSystem was initially developed by Nydegger (2010) at the Swiss Federal Research Institute (Agroscope, Tänikon, Switzerland) for behavioural measurements on cows fed indoors and is commercially distributed by the company (Itin+Hoch GmbH, Liestal, Switzerland) since 2010. It is well established as a sensor technology in indoor housing systems (Ruuska et al., 2016) and has undergone a number of modifications in development as a research and advisory tool (Zehner et al., 2012). It is absolutely critical that any animal behaviour sensor operates correctly in monitoring the appropriate parameters and is validated correctly.
23
Thus, the objective of this study was to validate an updated version of the RumiWatchSystem for the measurement of grazing behaviour in a pasture-based milk production system. Two separate experiments were conducted to validate parameters such as grazing, rumination, walking, standing and lying time, as well as grazing bites and rumination chews.
24 Material and Methods
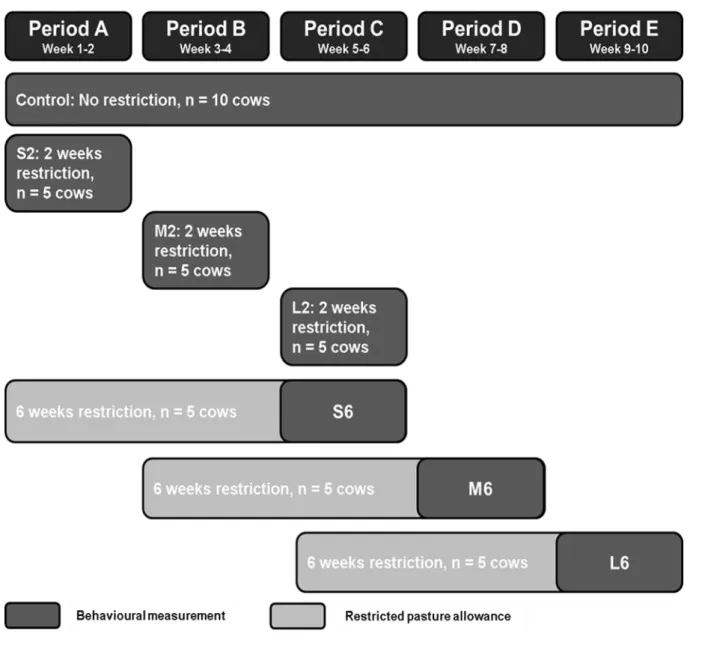
Validation of the RumiWatchSystem was conducted in two separate experiments with individual cow herds at Teagasc, Animal and Grassland Research and Innovation Centre (Fermoy, Co. Cork, Ireland, 50°07′N; 8°16′W). Experiments 1 and 2 took place in the periods of 10th to 19th of May 2016 and 31st of May to 2nd of June 2016, respectively. The experimental grazing areas represented permanent grassland with 70% perennial ryegrass and 30% annual meadow grass. This study was part of a larger study where different levels of feed allowance were allocated to dairy cows across different periods of the lactation and for different durations.
Sensor technology
The RumiWatchSystem consists of two separate devices with associated software packages for managing the sensors (RumiWatch Manager) and analysing data (RumiWatch Converter). The RumiWatch noseband sensor, integrated in a halter, is able to detect jaw movements and classifies them into grazing bites/chews, rumination chews or any other activity. Additionally, the time duration of those different classifications is recorded. The RumiWatch pedometer measures activity and can classify standing, walking, lying as well as amount of strides. Raw data were recorded in a 10 Hz resolution. Further information about technical components can be found in Zehner et al. (2012), Werner et al. (2016) and Alsaaod et al. (2015).
The RumiWatch Manager 2 (V.2.1.0.0) and the RumiWatch Converter (V.0.7.3.36) were used for Experiments 1 and 2 of the current study. There were two different approaches for time resolutions. For 1-min summaries, the output by the RumiWatch Converter was categorical as the behaviour was classified for the focal minutes.
25
All other time resolutions, e.g. 5-min, 10-min or 1-hour summaries were based on numerical data, which meant that the minutes of focal behaviour in each defined time resolution were counted. The algorithms were adapted to increase accuracy in detection under grazing conditions.
The RumiWatch Converter V.0.7.3.36 used three different parameters to monitor and calculate feeding time. Two parameters considered in this study were used to calculate feeding time. EAT1 determined grazing with head position down, EAT2 determined grazing with head position up. Furthermore, there were parameters for grazing and rumination bout behaviour integrated in the RumiWatch Converter V.0.7.3.36 with grazing bouts and rumination bouts. A grazing bout was defined as an event, where grazing was detected for a minimum duration of 7 minutes and the inter-bout interval was defined with a minimum threshold of 7 minutes. That means, if a cow was not showing any grazing behaviour for ≤ 7 minutes or she commenced to ruminate, the detection of the grazing bout was stopped. These definitions were similar to those used in a study by Pérez-Ramírez et al. (2009) after Brun et al. (1984). A second bout parameter, a rumination bout was defined as having a minimum duration of 3 minutes and an inter-bout interval with a minimum threshold of 1 minute. The study of Wolfger et al. (2015) applied similar criteria.
Experiment 1
Animals and Treatments:
A group of twelve spring calving dairy cows from a herd of 15 in a pasture-based milk production system was used. The cows were on average 91 ± 12 days in milk at the start of the experiment. The group consisted of an equal number of Holstein-Friesian (HF) and Jersey crossbred (JEX) cows with four primiparous and eight multiparous cows, ranging in lactation from 2 to 6.
26
The mean bodyweight was 477 ± 65 kg and the average body condition score (BCS) was 2.8 ± 0.2 ranging from 1 to 5, measured under the Edmonson et al. (1989) scoring system. The average milk yield over the experimental period was 22.5 ± 4.5 kg/cow/day.
All cows followed a similar milking routine. Cows were milked twice a day (6:30 h and 14:30 h) and spent approximately 1.5 - 2.0 hours per milking away from the paddock.
Cows were on a grass only diet and received a grass allocation twice daily after milking. Pre- and post-grazing sward height was measured daily with a rising plate meter (diameter 355 mm and 3.2 kg/m2; Jenquip, Fielding, New Zealand). Pre-grazing height of grass averaged 11.9 ± 2.5 cm, while post-grazing height averaged 4.5 ± 0.8 cm during the experimental period. All cows were identifiable by numbers painted on their sides (1-12).
Experimental design:
Cow behavioural data was collected by visual observation and by automated recording of the RumiWatchSystem. Two previously trained observers according to Table 2 were used to monitor the cows. The cow group was divided into 4 subgroups of 3 cows each. Each subgroup was observed by each observer on 3 occasions per day over a 4 day period (Table 1). Observations took place over 2-hour periods between dusk (05:00) and dawn (21:00) excluding milking times, which extended from 7:00 to 9:00 and 14:00 to 17:00 hrs.
27
Table 1: Experimental protocol for data collection of cow behaviour by visual observation.
Observer 1 Observer 2
Day Time Cow numbers Cow numbers
1 09:00-11:00 1,2,3 4,5,6 12:00-14:00 4,5,6 1,2,3 17:00-19:00 1,2,3 4,5,6 2 09:00-11:00 7,8,9 10,11,12 12:00-14:00 10,11,12 7,8,9 17:00-19:00 7,8,9 10,11,12 3 05:00-07:00 4,5,6 1,2,3 11:00-13:00 1,2,3 4,5,6 19:00-21:00 4,5,6 1,2,3 4 05:00-07:00 10,11,12 7,8,9 11:00-13:00 7,8,9 10,11,12 19:00-21:00 10,11,12 7,8,9
Visual observation was performed by 1-min scan sampling as used in the study of Büchel and Sundrum (2014). Behavioural data was categorized as feeding behaviour (FB) and activity behaviour (AB). Feeding behaviour was further classified as grazing, ruminating and other activities, while activity behaviour was classified as standing, walking and lying (Beauchemin et al., 1989). The different behaviour classifications are described in Table 2. The data were recorded on a spreadsheet and were transferred manually to an electronic spreadsheet (Microsoft Excel Version 2010; Microsoft Corporation, Redmond, USA) for analysis.
28
Table 2: Definition of different behaviour categories for observers, adapted from Bikker et al. (2014) and Alsaaod et al. (2015).
Behaviour Definition F ee ding beha viour Grazing
Cows’ muzzle is located near or above the grass and makes biting motion to ingest grass, or cow’s head
position up and making chewing motion
Ruminating Regurgitation, chewing, salivation and swallowing of
ingested grass
Other activities Any other movements of the muzzle, which are not
associated with grass intake
Ac ti vit y be ha viour
Standing Cow is in an upright position but is not walking
Walking Cow takes at least 3 consecutive strides in the same
direction (forward or backward)
Lying Cow is resting on the ground (not standing)
With regard to the automated data collection, the RumiWatchSystem comprised of two devices, a halter placed on the head and a pedometer placed on the left hind leg. The RumiWatch Manager 2 was used to synchronize both RumiWatch devices to UTC (Universal Time Coordinated) at the beginning of the experiment.
29 Data preparation:
There were 144 hours (8640 min) of valid observations. This visually recorded data were assembled in three ways. Firstly the data was assigned to the appropriate classification within the categories of FB and AB at 1-min intervals. Secondly, the time duration of the specific classifications of FB and AB were totalled for 1-hour intervals. Finally, the number of started grazing bouts and finished grazing bouts and the number of started rumination bouts and finished rumination bouts were calculated for each 1-hour period.
The automatically captured data were converted with the RumiWatch Converter (V.0.7.3.36) in 1-min and 1-hour summaries. Those summaries comprised comparable parameters to those outlined above for the visual data (classification at 1-min intervals, duration of specific behaviour classification per hour and numbers of grazing and rumination bouts). For the analysis of grazing time, the total of EAT1TIME and EAT2TIME was calculated.
Experiment 2
Animals and Treatments:
The objective of this trial was to validate the RumiWatch noseband sensor for the number of grazing bites and rumination chews. A group of twelve spring calving dairy cows were fitted with RumiWatch noseband sensors. All cows were identifiable by numbers (1-12) painted on both sides of each cow. The experiment extended over a 2-day-period with an adjustment period to the noseband sensor of 8 days prior to the starting of the experiment. Two cow breeds were included with 7 Holstein-Friesian (HF) and 5 Jersey crossbreds (JEX). The group consisted of 3 primiparous and 9 multiparous cows, ranging from 2-6 parities. Average cow milk yield over the experimental period was 20.8 ± 4.7 kg/cow/day. Cows had an average body weight of 496 ± 69 kg and a BCS of 2.9 ± 0.2. The cows were on a grass only diet and were maintained in the same paddock throughout the experimental period.
30
They had ad libitum access to water, and fresh grass was provided once daily directly after morning milking. Milking times were twice daily (6:30 h and 14:30 h) during which the cows spend 1.5-2.0 hours per milking away from the paddock. Pre- and post-grazing sward height was measured with an automated rising plate meter which is a grass measuring device (Grasshopper, True North Technologies, Shannon, Co. Clare, Ireland; (McSweeney et al., 2015)) on one occasion during the experiment. Average pre-grazing and post-grazing height were 14.7 cm and 6.1 cm, respectively.
Experimental design:
Firstly, the accordance between all four observers was measured over two days in 24 5-min periods, during which time all observers monitored the behaviour of the same cow independently. Four previously trained observers then monitored one cow per observer for 5-min periods to validate the number of grazing bites and ru5-mination chews. The number of grazing bites and rumination chews was recorded using a handheld computer with a specially programmed application. A grazing bite was defined as a combination of jaw, tongue and neck movement to rip grass with an under-laid acoustic sound (Bailey et al., 1996). Rumination chews were counted after regurgitation took place and a bolus travelled through the oesophagus to reach the mouth (Schirmann et al., 2009). As in Experiment 1, the observational periods were extended to 2-hour periods and occurred three times a day (Table 3). All observations took place between 04:30 and 21:00 hrs. Every min observation period was alternated with a 5-min break period. Cows were rotated across observers for every 5-5-min observation period, such that the observer monitored each of the 12 cows during each 2-hour observation period.
31
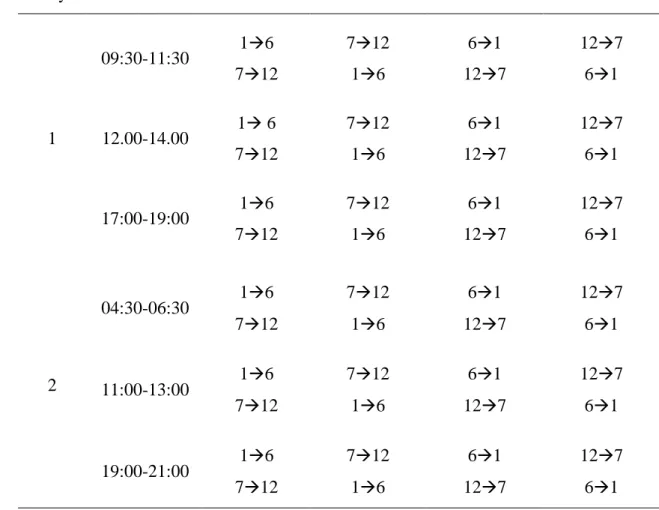
Table 3: Experimental protocol for data collection on cow behaviour (rumination chews and grazing bites), by visual observation. Observed cows were monitored in 5-min periods in the stated order ascending or descending by each observer.
Observer 1 Observer 2 Observer 3 Observer 4
Day Time CowNo. CowNo. CowNo. CowNo.
1 09:30-11:30 16 712 61 127 712 16 127 61 12.00-14.00 1 6 712 61 127 712 16 127 61 17:00-19:00 16 712 61 127 712 16 127 61 2 04:30-06:30 1 6 712 61 127 712 16 127 61 11:00-13:00 16 712 61 127 712 16 127 61 19:00-21:00 1 6 712 61 127 712 16 127 61 Data preparation:
The data recorded on the handheld computer included the number of visually observed rumination chews and grazing bites. This data was subsequently totalled within a spreadsheet application. In total 249 observation periods were analysed, which had been collected over the 2-day period. The observation periods consisted of 181 periods of grazing bite observations and 71 periods of rumination chew observations.
32
Data were excluded, when two different behaviour types (grazing bites and rumination chews) were monitored within one 5-min period. Periods where neither grazing bites nor rumination chews were observed, were also excluded from the data set.
With regard to the data automatically recorded by the RumiWatch noseband sensor, these data were classified into the categories of grazing bites and rumination chews. The data were then converted by the RumiWatch Converter (V.0.7.3.36) into 5-min intervals, summarizing the numbers of rumination chews or grazing bites. For analysing rumination chews, the algorithms with the plausibility check function for minimum duration of 3 min were turned off.
Statistical analysis
Statistical analysis was performed using R version 3.3.1 (R Foundation for Statistical Computing, Vienna, Austria). The following analyses were carried out to assess agreement between the RumiWatchSystem and visual observations, depending on the type of data recorded at different time periods.
In Experiment 1, Cohen's Kappa (κ) was calculated to assess agreement between RumiWatchSystem and visual observations when FB and AB were recorded at 1-min resolution (Cohen, 1960). The κ – values were interpreted in a similar manner as by Landis and Koch (1977), where: poor: κ < 0.00, slight: κ = 0.00–0.20, fair: κ = 0.21–0.40, moderate: κ = 0.41– 0.60, substantial: κ = 0.61–0.80, and almost perfect: κ = 0.81–1.00.
33
The percentage agreement (PA) of the 1-min resolution data for both categories of FB and AB and specific classifications, e.g. grazing, rumination, standing, walking, etc. recorded by visual observation and RumiWatchSystem was computed using the following formula, used by Martin et al. (1993):
𝑡𝑜𝑡𝑎𝑙 𝑛𝑢𝑚𝑏𝑒𝑟𝑠 𝑜𝑓𝑎𝑔𝑟𝑒𝑒𝑚𝑒𝑛𝑡
𝑡𝑜𝑡𝑎𝑙 𝑛𝑢𝑚𝑏𝑒𝑟𝑠 𝑜𝑓𝑎𝑔𝑟𝑒𝑒𝑚𝑒𝑛𝑡 + 𝑡𝑜𝑡𝑎𝑙 𝑛𝑢𝑚𝑏𝑒𝑟𝑠 𝑜𝑓𝑑𝑖𝑠𝑎𝑔𝑟𝑒𝑒𝑚𝑒𝑛𝑡𝑥100
A number of tests were conducted on the variables with numeric values to assess agreement between data of the RumiWatchSystem and visual observations. The behavioural data from the RumiWatch noseband sensor and from the pedometer were subjected to a graphical analysis in
a Bland-Altman-Plot and a Spearman’s Rank correlation (rs) and a concordance correlation
coefficient (CCC) was calculated, using the U-statistics (Carrasco et al., 2007). Interpretation
of rs -values and CCC were based on criteria defined by Hinkle et al. (2003) as follows:
Negligible = 0.0 - 0.3, low = 0.3 - 0.5, moderate = 0.5 - 0.7, high = 0.7 - 0.9 and very high = 0.9 - 1.00.
The Bland-Altman-plots demonstrated the agreement between both measurement methods and the Bland-Altman-analysis indicated the mean differences (bias) between the paired automatically recorded and visually observed values, with 95%-confidence intervals (CI). It also displayed the lower and upper limits of agreement along with their relative 95%-confidence intervals. The limits of agreement were calculated as ± 1.96*standard deviation from mean difference. Although the parameters itself were not normally distributed, the Bland-Altman-plots were used as the differences between the paired values followed a normal distribution. In addition, a method to determine significant differences between two measurements by Giavarina (2015) was also applied on the Bland-Altman-analysis. The bias (or mean difference) was considered to be significant when the line of equality was not within the 95% CI of the
34
mean difference. Therefore, a significant under- or overestimation was declared when the line of equality was not included in the 95% CI of the mean difference.
For the validation of bouts (grazing and rumination), there were values between 0 and 2 for bouts started or finished within each 1-hour period measured. Therefore, these values were treated as ordinal variables. The agreement for grazing and ruminating bouts was assessed using weighed kappa statistics and percentage agreement, as explained above.
In Experiment 2 grazing bites and rumination chews were counted by human observers during 5-min periods. Agreement between every paired observer was evaluated using CCC and among all observers via overall CCC. Number of grazing bites and rumination chews per 5-min period were analysed using the same methods for numeric variables as described in Experiment 1, including Spearman’s Rank correlation, CCC and Bland-Altman-Analysis.
35 Results
Experiment 1
The comparison of categorical data of the noseband sensor and of the pedometer is shown in Table 4. The Cohen’s Kappa value was κ = 0.84 for the visual feeding behaviour measurements compared with the noseband sensor and κ = 0.89 for the visual activity measurements compared to the pedometer. Using an interpretation of Landis and Koch (1977), these results indicate an almost perfect agreement of visual and automatically recorded data on a 1-min resolution. This result is supported by the overall agreement of 91.1% for the noseband sensor and 95% for the pedometer.
Table 4: Cohen’s Kappa (κ) and percentage agreement between visual observations and automated measurements by RumiWatch for feeding and activity behaviour on a 1-min resolution.
Category Cohen's
κ
Agreement between visual and automated
measurement (%) Classification Agreement between visual and automated measurement (%) Feeding behaviour (Grazing, Ruminating, Other Activities) 0.84 91.1 Grazing 91.5 Ruminating 94.3 Other Activities 81.4 Activity behaviour (Standing, Walking, Lying) 0.89 95.0 Standing 96.3 Walking 95.4 Lying 98.7
36
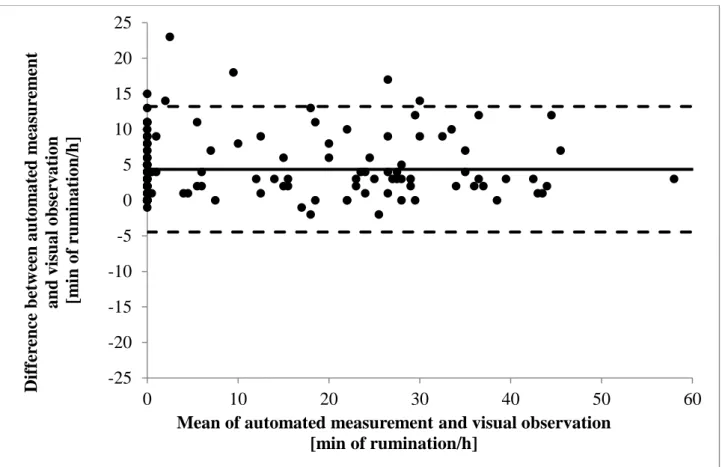
The evaluation of 1-hour summaries of feeding behaviour measured by the visual observation and by the noseband sensor is presented in Figure 1 and Table 5. Grazing was detected by visual observation as having occurred for 40.5 min/ hour (median), while grazing time detected by the automated sensor system was recorded with a median of 47 min/hour. A slight overestimation of the automated system in grazing min per hour is displayed in Figure 1a. According to Bland-Altman-Statistics the mean difference was 4.41 min/hour, and this overestimation is shown as
the solid line in Figure 1(a). The correlation of rs = 0.96 and a CCC = 0.96 is classified as very
high for determine grazing time.
The comparison of rumination time measured by visual observation and by the automated
method is shown in Figure 1 and Table 5. The correlation of rs = 0.98 and a CCC = 0.99 is very
high. The automated system recorded a range of measured min of rumination between 0 and 59, with a median of 0. Alternatively, the observers recorded a range from 0 to 57 min with a median of 2 min rumination per hour. In Table 5 the analysis of the Bland-Altman-Plot is presented. The bias of 0.03 min/hour along with the 95% CI of -3.04 and 3.10 demonstrated a perfect agreement between the automated system and the observers.
The mean of all values was completely accurate and 95% of all recorded values distributed themselves in a difference range of ± 3 min/hour.
The total agreement for measuring started and finished grazing bouts within 1-hour periods was PA = 84.7% and PA = 85.4%, respectively, whereas the agreement for rumination bouts started and finished was PA = 93.1% and PA = 93.8%. The weighed kappa values showed a moderate agreement between visual and automated measurement with values of κ = 0.62 and κ = 0.66 for grazing bouts started and finished, respectively. The rumination bouts showed improved performance, with an almost perfect agreement of κ = 0.86 for bouts started and bouts finished.
37 (a) Grazing time
-25 -20 -15 -10 -5 0 5 10 15 20 25 0 10 20 30 40 50 60 Dif fe re n ce b etw ee n au tom ate d m eas u re m en t and visu al obser vat ion [m in of gr az in g/h ]
Mean of automated measurement and visual observation [min of grazing/h]
38 (b) Rumination time
Figure 1: Agreement of automated RumiWatch noseband sensor measurements and visual observations of feeding behaviour (a) grazing and (b) rumination time in 1-hour periods, displayed in Bland-Altman-plots. -25 -20 -15 -10 -5 0 5 10 15 20 25 0 10 20 30 40 50 60 D if fe re nce bet w ee n au tom at ed m easur em ent an d visu al ob se rvation [m in of r u m in ation /h ]
Mean of automated measurement and visual observation [min of rumination/h]
39
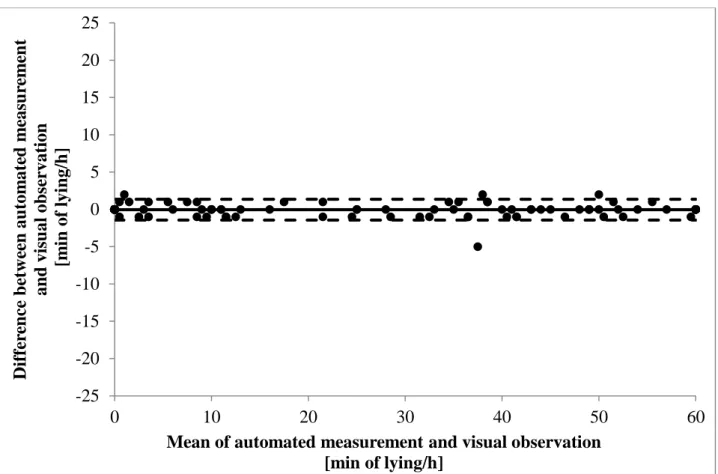
The validation of the pedometer in terms of measuring activity behaviour in a pasture-based system is shown in Figure 2. Standing time and lying time were determined accurately by the
sensor system with a correlation of rs = 0.99, while walking time was less accurately determined
by the sensor with a correlation of rs = 0.77. There were less minutes per hour of walking
detected in comparison to standing and lying. The median of walking time was 1 min for visual observation and ranged from 0 to 18 min per hour whereas the automated system recorded 2 min per hour, ranging from 0 to 17 min per hour. Grazing time was significantly overestimated and time at other activities was significantly underestimated. Significant differences of bias were also observed between the pedometer and visual recordings in standing time and walking time (Table 5).
40 (a) standing -25 -20 -15 -10 -5 0 5 10 15 20 25 0 10 20 30 40 50 60 Dif fe re n ce b etw ee n au tom ate d m easu re m en t an d visu al ob se rvation [m in of stand in g/h ]
Mean of automated measurement and visual observation [min of standing/h]
41 (b) walking -25 -20 -15 -10 -5 0 5 10 15 20 25 0 10 20 30 40 50 60 Dif fe re n ce b etw ee n au tom ate d m easu re m en t an d visu al ob se rvation [m in of w alk in g/h ]
Mean of automated measurement and visual observation [min of walking/h]
42 (c) lying
Figure 2: Agreement of automated RumiWatch pedometer measurements and visual observations for activity behaviour (a) standing; (b) walking; (c) lying in 1-hour periods displayed in Bland-Altman-plots. -25 -20 -15 -10 -5 0 5 10 15 20 25 0 10 20 30 40 50 60 Dif fe re n ce b etw ee n au tom ate d m easu re m en t an d visu al ob se rvation [m in of lyi n g/h ]
Mean of automated measurement and visual observation [min of lying/h]
43
Table 5: Spearman's rho (rs), Concordance Correlation Coefficient (CCC), and
Bland-Altman-analysis (Bias, upper and lower 95% limits of agreement with 95% CI) of automated measurements versus visual observations in a 1-hour resolution for different behaviour classifications. Behaviour time in min/h rs CCC Bias (95% CI) Lower (95% CI) Upper (95% CI) Grazing 0.96 0.96 4.41 (3.64; 5.17) -4.69 (-6.02; -3.37) 13.51 (12.19; 14.84) Rumination 0.98 0.99 0.03* (-0.22; 0.29) -3.04 (-3.48; -2.59) 3.10 (2.66; 3.55) Other activities 0.91 0.90 -4.38 (-5.12; -3.63) -13.20 (-14.49; -11.92) 4.45 (3.17; 5.74) Standing 0.97 1.00 -0.69 (-0.92; -0.47) -3.35 (-3.74; -2.96) 1.96 (1.57; 2.35) Lying 0.99 1.00 0.05* (-0.07; 0.17) -1.35 (-1.55; -1.15) 1.45 (1.24; 1.65) Walking 0.78 0.92 0.85 (0.63; 1.06) -1.71 (-2.08; -1.33) 3.40 (3.02; 3.77) *= no significant over- or underestimation between automated system and visual observation
Experiment 2
In this experiment the accuracy of the RumiWatchSystem in measuring grazing bites and rumination chews was examined. The degree of agreement between observers was analysed initially (Table 6). The CCC-values determined for grazing bites and rumination chews were CCC = 0.98 and CCC = 1.00 respectively, which demonstrated a very high agreement between all four observers.
44
Table 6: Concordance Correlation Coefficient (CCC) for each observer paired with all observers and overall CCC between all four observers in measuring grazing bites and rumination chews.
Behaviour [n/5min]
CCC Overall CCC
Observer 1 Observer 2 Observer 3 Observer 4
Grazing bites 1 0.97 0.97 0.99 0.98 2 0.99 1.00 3 0.99 Rumination chews 1 1.00 1.00 0.99 1.00 2 0.99 0.99 3 0.98
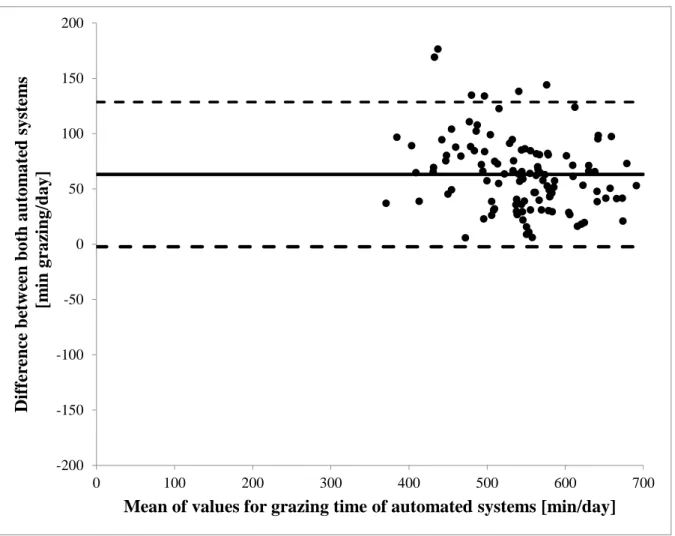
The comparison between the automated system and visual observations in measuring grazing bites are presented in Figure 3a) and Table 7. The visually counted grazing bites ranged from 0 to 387 per 5-min period, with a median of 232 bites. However, the RumiWatchSystem recorded grazing bites between 0 and 419, with a median of 280 bites. The Bland-Altman-Plot showed that the automated measurement slightly overestimated the numbers of grazing bites. A bias of 36 grazing bites, with a lower 95% limit of agreement of -66 grazing bites and an upper 95% limit of agreement of 138 grazing bites confirmed the significant overestimation of grazing bites by the RumiWatchSystem. Overall, the agreement for grazing bites between the two
45
Table 7: Spearman's rho (rs), Concordance Correlation Coefficient (CCC), and Bland-Altman-
analysis (Bias, upper and lower 95% limits of agreement with 95% CI) of automated measurements against visual observations of grazing bites and rumination chews in 5-min periods. Behaviour (n./5min) rs CCC Bias (95% CI) Lower (95% CI) Upper (95% CI) Grazing bites 0.81 0.78 36.01 (28.36; 43.66) -66.16 (-79.41; -52.93) 138.19 (124.95; 151.44) Rumination chews 0.81 0.94 7.24 (-0.15; -14.33) -51.44 (-63.72; -39.17) 65.92 (53.64; 78.19)
The evaluation of the measured rumination chews by visual and automated recordings demonstrated positive results as shown in Figure 3(b). The visually counted rumination chews ranged from 2 to 386 chews/5-min period with a median of 323 chews. Alternatively, the RumiWatchSystem recorded a median of 330 rumination chews. The agreement between observer and automated system is higher compared to that for grazing bites, with a correlation of r = 0.81 and a CCC = 0.94. The Bland-Altman-plot of Figure 3(b) also illustrated graphically, that the mean difference between both measurement methods is very small with a value of 7.24 rumination chews per 5-min period. Limits of agreement (dashed lines in Figure 3(b) indicate that the mean differences between automated measurement and visual observation lie between -51.44 and 65.92 chews per 5-min period.
46 (a) Grazing bites
-350 -250 -150 -50 50 150 250 350 0 50 100 150 200 250 300 350 400 M ean d if fe re n ce of au tom ate d syste m an d visu al ob se rvation for gr az in g b ite s [n]
Mean of grazing bites measured by automated system and visual observation [n]