W P 0 7 / 0 2 | A N A N A L Y S I S O F T A X R E V E N U E F O R E C A S T E R R O R S 3 4
Appendix: Plots for two-year-ahead forecast
errors
Figure 10 – Two-year-ahead forecast errors for total tax revenue and major tax
types
Percentage forecast errors (top row), weighted percentage forecast errors (middle row) and actual forecast errors (bottom row) for total tax revenue (black), PAYE (red), GST (green), corporate tax (blue), net other persons tax (cyan) and other taxes (magenta). Time series plots are given on the left and boxplots on the right.
W P 0 7 / 0 2 | A N A N A L Y S I S O F T A X R E V E N U E F O R E C A S T E R R O R S 3 5
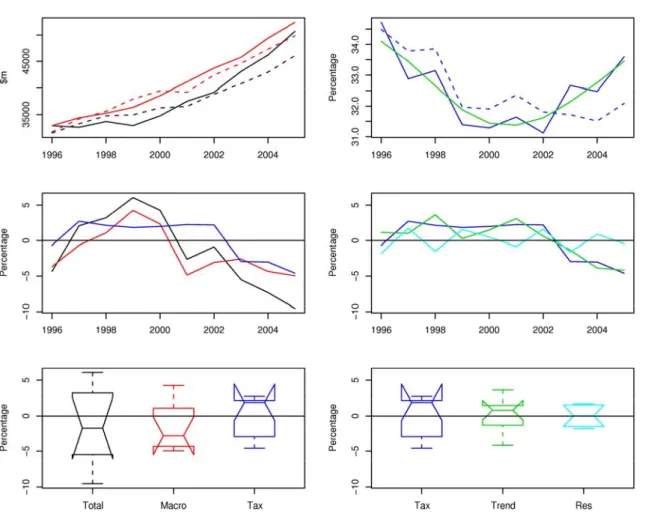
Figure 11 – Total tax revenue and nominal GDP: two-year-ahead forecasts
The top plots show total tax revenue (black), scaled GDP (red), tax ratio (blue) and its trend (green) with solid lines denoting actuals and dashed lines two-year-ahead forecasts. The remaining plots show the percentage forecast errors due to forecasting total tax revenue (black), GDP (red), tax ratio (blue), tax ratio trend (green) and residual error (cyan).
W P 0 7 / 0 2 | A N A N A L Y S I S O F T A X R E V E N U E F O R E C A S T E R R O R S 3 6
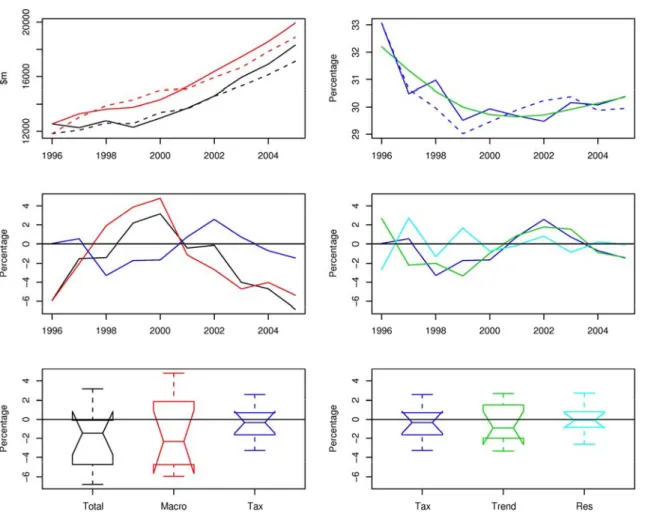
Figure 12 – PAYE and COE: two-year-ahead forecasts
The top plots show PAYE (black), scaled compensation of employees (red), tax ratio (blue) and its trend (green) with solid lines denoting actuals and dashed lines two-year-ahead forecasts. The remaining plots show the percentage forecast errors due to forecasting PAYE (black), compensation of employees (red), tax ratio (blue), tax ratio trend (green) and residual error (cyan).
W P 0 7 / 0 2 | A N A N A L Y S I S O F T A X R E V E N U E F O R E C A S T E R R O R S 3 7
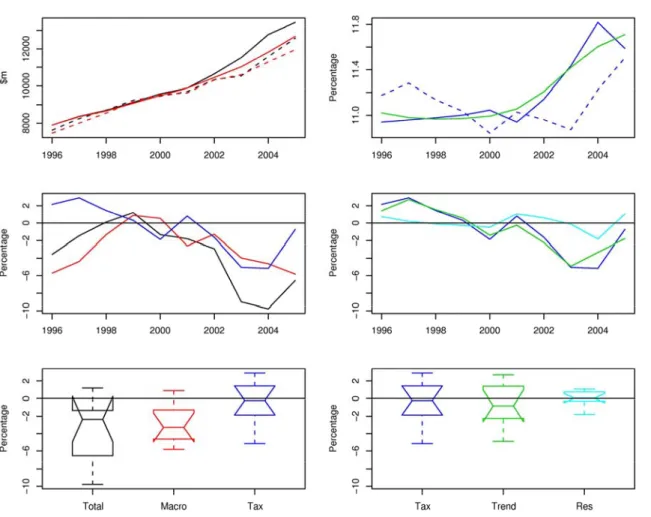
Figure 13 – GST and nominal consumption: two-year-ahead forecasts
The top plots show GST (black), scaled nominal consumption (red), tax ratio (blue) and its trend (green) with solid lines denoting actuals and dashed lines two-year-ahead forecasts. The remaining plots show the percentage forecast errors due to forecasting GST (black), nominal consumption (red), tax ratio (blue), tax ratio trend (green) and residual error (cyan).
W P 0 7 / 0 2 | A N A N A L Y S I S O F T A X R E V E N U E F O R E C A S T E R R O R S 3 8
Figure 14 – Corporate tax and operating surplus: two-year-ahead forecasts
The top plots show corporate tax (black), scaled operating surplus (red), tax ratio (blue) and its trend (solid green) with solid lines denoting actuals and dashed lines two-year-ahead forecasts. The remaining plots show the percentage forecast errors due to forecasting corporate tax (black), operating surplus (red), tax ratio (blue), tax ratio trend (green) and residual error (cyan).
W P 0 7 / 0 2 | A N A N A L Y S I S O F T A X R E V E N U E F O R E C A S T E R R O R S 3 9
Figure 15 – Net other persons tax and entrepreneurial income: two-year-ahead
forecasts
The top plots show net other persons tax (black), scaled entrepreneurial income (red), tax ratio (blue) and its trend (green) with solid lines denoting actuals and dashed lines two-year-ahead forecasts. The remaining plots show the percentage forecast errors due to forecasting net other persons tax (black), entrepreneurial income (red), tax ratio (blue), tax ratio trend (green) and residual error (cyan).
W P 0 7 / 0 2 | A N A N A L Y S I S O F T A X R E V E N U E F O R E C A S T E R R O R S 4 0
Figure 16 – Other tax revenue and nominal GDP: two-year-ahead forecasts
The top plots show other taxes (black), scaled GDP (red), tax ratio (blue) and its trend (solid green) with solid lines denoting actuals and dashed lines two-year-ahead forecasts. The remaining plots show the percentage forecast errors due to forecasting other taxes (black), GDP (red), tax ratio (blue), tax ratio trend (green) and residual error (cyan).
W P 0 7 / 0 2 | A N A N A L Y S I S O F T A X R E V E N U E F O R E C A S T E R R O R S 4 1
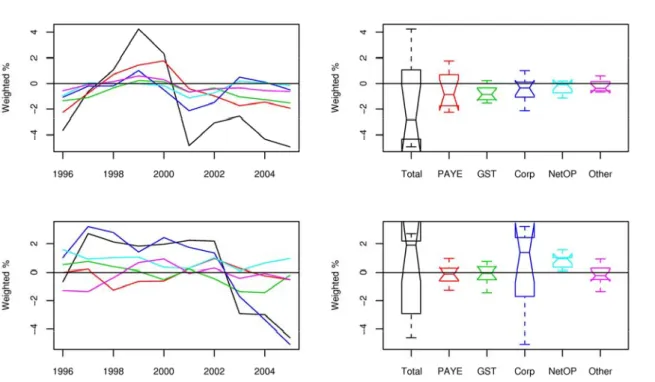
Figure 17 – Tax-share weighted, two-year-ahead, percentage forecast errors
Tax-share weighted two-year-ahead percentage forecast errors due to forecasting the associated macroeconomic driver (top plots) and tax ratio (bottom plots) for total tax revenue (black), PAYE (red), GST (green), corporate tax (blue), net other persons tax (cyan) and other taxes (magenta). Time series plots are given on the left and boxplots on the right.
W P 0 7 / 0 2 | A N A N A L Y S I S O F T A X R E V E N U E F O R E C A S T E R R O R S 4 2