The project is funded under Socio‐economic Sciences & Humanities grant agreement no.
224516 and is led by the Centre for Energy, Petroleum and Mineral Law and Policy
POLINARES is a project designed to help identify the main global challenges
relating to competition for access to resources, and to propose new approaches to
collaborative solutions
POLINARES working paper n. 16 March 2012
Mining industry corporate actors
analysis
4
Mining industry corporate actors analysis
Magnus Ericsson
The corporate structure of the global mining industry is slowly changing. In parallel to the relocation of production to developing countries, mostly south of the equator, new corporate structures based in emerging economies are developing. The locus of control over mineral resources is shifting to the countries where production is taking place. In a few years time Chinese mining companies will also take place among the top ones.
4.1 Introduction
During the present extended boom not only is metal and mineral production increasing fast but a new corporate landscape is also emerging. Established, globally-operating transnational corporations (TNCs) in the field of mining are meeting increasing competition from new mining companies based in China, India, the Commonwealth of Independent States (CIS) and other developing economies and from junior companies. China is since some years the world’s largest mining country and the so called BRICS-countries (Brazil (No 6), Russia (No 5), India (No 4), South Africa (No 6) are all among the top 10 mine producers. The only developed economies among the top 10 countries are Australia (No 2), USA (No 3) and Canada (No 10).
At the same time society’s expectations on the exploration and mining industry are growing quickly and the industry is increasingly receiving new political attention. Barely has the industry started to come to grips with its image and environmental footprint when new issues arise:
In the industrialised countries metal and mineral supply is becoming a concern.
Stakeholders other than investors want a larger share of profits.
Despite cost increases of many inputs, and hence operating cost increases in most mines, the
profitability of mineral producers has exploded. The Fortune Global 500 companies in the
extractive industries (including oil) reached an exceptionally high profitability in both 2005 and 2006, compared with large companies in other sectors as well as historically. The average profit measured in per cent of revenues was between 25-30% in 2006 compared to less than 20% for pharmaceutical industry for example and to 5% as late as 2002.
Figure 1: Value of global metals, coal and industrial minerals production 2010 (source: Raw Materials Data 2011)
The global mining industry faces one main challenge: to deliver sufficient volumes of metals and minerals at prices, which do not fuel inflation or encourage substitution, while ploughing back a reasonable share of profits into local and national host economies.
If it shall be possible to meet this challenge there is a need for a new type of international cooperation to facilitate the use of minerals as a lever for economic and social development in developing countries. This is necessary to ensure that mistakes of the past are not repeated, when an insufficient share of profits flowed back to host countries and local communities. Many countries experience large scale mining investments for the first time and their governments have no history on which to build policies. Cooperation between developing countries, between rich and poor countries, between "old" and "new" mining countries is important, as is cooperation between governments and industry.
Governance and transparency remain key concepts for all participants, both new and old, in this process. Positive experiences from countries that have successfully developed, economically and socially, based on natural resources should be systematically transferred to weak governments. The same strict demands on transparency, conduct and operational practices from reporting standards to health and safety routines should be put on all exploration and mining companies in principle regardless of origin or size. There is an important role in this fight also for the broader international community. “Mining for Development” modelled on the successful Norwegian programme called Oil for Development (NORAD 2007), is but one idea presently discussed between Nordic and developing countries (Ericsson 2008).
4.2 Corporate concentration
The mining industry has been going through a consolidation phase during the last couple of years. The supply response is, due to the long term nature of exploration and mining investment, slow and it will take years to make up for earlier under-investment. Therefore, the mining companies will continue to generate good if not record profits and hence the pressure for mergers and acquisitions (M&A) will continue at a high level. The fragmented structure of mining is slowly disappearing (Figure 2).
Figure 2: Corporate structure global mining industry (Note: The majors are arbitrarily defined as the top 150 companies, all other producing companies are mid tiers and the non-producing companies are called Juniors/explorers. In 2005 the mid tier included some 957 companies in 2009 they were reduced to 305. (Source: Raw Materials Data 2011))
208 266 345 428 436 598 750 761 1006 1041 1064 1113 1465 1770 1800 1883 1954 1983 2103 2359 3053 5884 Silver Gold Cobalt Copper Molybdenum Bauxite Nickel Chromite Vanadium Zinc Titanium Manganese ore Lithium Tin Tungsten Platinum Lead Antimony Rhodium Tantalum Palladium Niobium Medium concentr. Few suppliers Many suppliers
Source of copyright/database-right protected material: Raw Materials Group Stockholm/www.rmg.se
Figure 3: Company concentration for metallic raw materials in 2009. The values represent the calculated Herfindahl-Hirschmann index (HHI) (<1000: low concentration, 1000-1800: medium concentration, > 1800 high concentration). Examples for a high company concentration are. Niob (Moreira Salles Group, Brazil: 76,1%), Palladium (Norilsk Nickel Mining & Metallurgical Comp., Russia: 50,5%; Anglo American plc, UK: 18,0%; Impala Platinum Holdings Ltd, South Africa: 11,0%) .
As the mining industry gradually is getting less fragmented, a limited number of companies control an increasing share of the mining industry globally. This trend has both positive and negative aspects. On the one hand, the mining industry, new players included, needs to consolidate to create larger and stronger corporate entities. Larger companies are necessary to fund and pursue increasing volumes of research and development (R&D) including expanded exploration. Increasing energy, water and environmental costs must also be addressed. On the other hand proper checks and balances must be in place to ensure that monopolistic powers are not created.
The case of BHP Billiton making a hostile bid for Rio Tinto is one example of a situation where the market domination in iron ore, copper and aluminium for the proposed new entity would be unacceptable and the seaborne iron ore market not free and competitive any more. The Herfindahl-Hirschmann Index (HHI) for seaborne traded iron ore has decreased due to the decline in all the Top 10 companies including Vale but except LKAB, and in 2010 it was 1,307 down from 1,360 in 2009 and from 1,736 in 2008 at the level of the 10 largest companies (to add smaller producers would not increase the index to any significant degree). This is the third consecutive year of decline and the figure is now well below the 1,800 limit for what the United States Federal Trade Commission calls “highly concentrated”. Like in 2009, the index does not support the argument that major producers have a potential influence over the market and prices. The proposed merger between BHP Billiton and Rio Tinto would have raised this level further and the HHI figure would have increased to almost 2,500. From this point of view it was logical for the proposed merger not to have been approved by regulatory authorities in the European Union unless the companies made some divestitures. The proposed production cooperation between Rio Tinto and BHP Billiton would have led to more or less the same situation with strong market influence by the combination, which would have become larger that Vale. It was hence not surprising that the proposal was withdrawn even if no formal decision was made by the European anti-trust authorities.
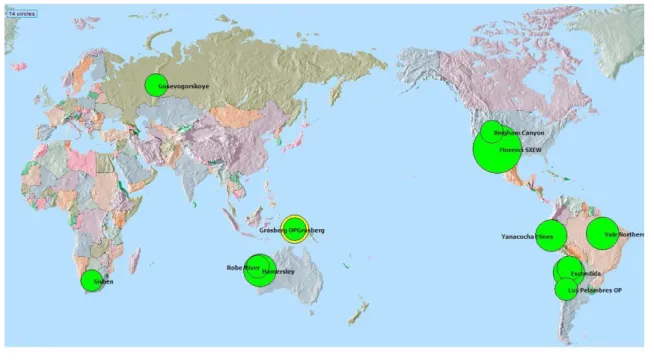
There are over 2,500 mines producing metal ores using mechanised methods around the world if small manual and artisanal operations are excluded. There is a huge spread between the
largest and smallest mines (Figure 4).1 Thirteen open pit mines of the world each produce
more than 50 Mt of ore each annually. Together they account for over 20 % of the total volumes of metal ores hoisted annually in the world. One hundred produce more than 10 Mt per year. The remaining 2,400 mines produce on average only 1.7 Mt and certainly the bulk of them much less than that.
Figure 4: Mines of the world producing > 50 Mt of ore annually (source: Raw Materials Data 2011).
The largest 150 companies are, somewhat arbitrarily, called majors and together they represent a few per cent only of the total number of companies in the sector globally. When looking at the value of the production controlled by these companies the situation is reversed, together they control some 85% of total global mineral production.
In the flurry of M&A the industry is getting more and more polarised: on the one side there are the large, established mining TNCs controlling a major share of global metal production and on the other side are the junior exploration companies without any production, only “blue sky” hopes of future production. There is a lack of medium and small sized producers, which can grow organically and become major producers in the course of time. These companies are important in that they concentrate on smaller deposits which often have good grades but which are discarded by the majors.
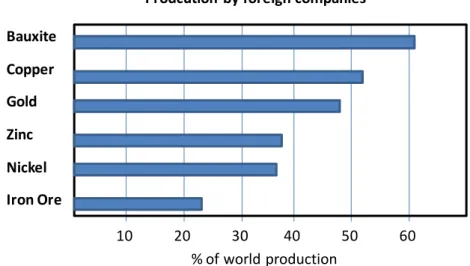
Some of the most active new entrants into the top league of mining companies originate in emerging countries. But in general developing countries are not in control of their mineral production (UNCTAD, 2007). This is the root of considerable problems and sometimes even political calls for nationalisations in these countries. It is quite possible that there will be a backlash and nationalisations will take place again after over twenty years of privatisations. In Russia, nationalisations have already been made in the oil and gas sector and the step into minerals is not far at all. Another example, in early 2008 the South African mine workers union called for an increased state ownership in mining. In other countries the demand for local influence and participation in the huge profits made has resulted in re-negotiated tax deals and new royalty programs. The influence of foreign companies is illustrated in Figure 5.
Bauxite Copper Gold Zinc Nickel Iron Ore 10 20 30 40 50 60 % of world production Prodcution by foreign companies
Figure 5: Production by foreign companies (sources: UNCTAD; based on Raw Materials Data 2007)
TNCs in global mining
0 0 0 10 20 30 40 50 60 70 80 90 100 Po lan d Iran , Isl am ic R ep. Ru ss ian Fed era tion Bra zil Sw ede n Ch ina Ind ia Ve nez uel a Mex ico Ukr ain e Can ad a Cu ba Un ite d Sta tes Co ng o, D em . R ep. Au str alia Ch ile New Cal ed on ia So uth Afr ica Kaz akh sta n Pe ru Co lom bia Ind on esia Nam ibia Bo tsw an a Pa pu a N ew Gu ine a Za mb ia Ta nza nia , U nite d R ep . Mo ng oli a Mal i Gu ine a Gh an a Gab on Arg enti naSources: UNCTAD, based on Raw Materials Data, 2007. % of
domestic production
Figure 6: TNCs in global mining
Some of the emerging companies are not new to the sector but have widened their interests both around the world and into new commodities such as Vale (previously CVRD acquiring the nickel producer Inco) and Norilsk (acquiring gold mines in Russia and South African Gold Fields, later sold off for tactical reasons). Others are new to mining and have taken the first steps in various ways:
Making favourable deals in privatisation sell-outs and using these acquisitions as a
stepping stone for later global expansion such as Vedanta from India.
Through vertical integration - a prime example being Arcelor Mittal (earlier Mittal
Steel) that has a clear strategy to acquire both operating captive iron ore mines and also to start new projects. Mittal has quietly over only a few years bought iron ore mines in Algeria, the US, Mexico, Bosnia, Kazakhstan and Ukraine. The group also
Minmetals for Canadian Noranda a few years ago is a prime example of this. The pressure and support from Chinese authorities to make Chinese mining and exploration companies go overseas to secure stable supplies of metals and minerals certainly provides a strong incentive to do so. The imbalances between Chinese demand for metals and the role played by Chinese companies in production of minerals and metals are other reasons to expect a strong growth in Chinese ownership of mines and deposits outside of China in the next decade. Chinese interest in taking 20% of the leading South African based mining bank Standard Bank is but one example of the growing presence of China in Africa.
Chinese producing companies will try to secure their raw materials demand
increasingly through direct investments anywhere in the world. Chinalco taking 12% in Rio Tinto during the BHP Billiton take-over battle is another recent example. No doubt there will in just a few years time be one or several Chinese companies among the Top 10 list of mining companies provided by the Raw Materials Group (RMG). There will most certainly be other companies from other emerging countries following these routes.
Table 1 sets out how the industry would look once the acquisitions proposed in 2010 have taken place. This table is based on the companies’ control of the value of mine production of non-fuel metals.
Table 1: Top companies (metals) (source: Raw Materials Data 2011) Rank
world 2010
Company name Country Share of value 2010 (%) Cumulated share 2010 (%) Main metal value share (%) 1 Vale SA Brazil 8.0 8.0 Fe 91 2 Rio Tinto plc UK 5.5 13.5 Fe 78 3 BHP Billiton Group Australia 5.5 19.0 Fe 64 4 Anglo American plc UK 2.8 21.8 Fe 39 5 Freeport-McMoran Copper & Gold USA 2.2 24.0 Cu 74
6 Codelco Chile 2.0 26.0 Cu 93
7 Barrick Gold Corp Canada 2.0 28.0 Au 92 8 Xstrata plc Switzerland 1.8 29.8 Cu 53 9 Norilsk Nickel Russia 1.8 31.6 Ni 43 10 Newmont Mining Corp USA 1.5 33.0 Au 88 11 ArcelorMittal UK 1.2 34.2 Fe 100 12 Vedanta Resources plc UK 1.1 35.3 Fe 61 13 Anglogold Ashanti Ltd South Africa 1.1 36.3 Au 100 14 Grupo Mexico SA de CV Mexico 0.9 37.3 Cu 82 15 Fortescue Metals Group Ltd Australia 0.9 38.2 Fe 100
It is interesting to see how important in this benchmarking exercise the production of iron ore
has become due to the high relative price level of iron ore. Vale, which is the 3rd largest nickel
producer in the world and the 17th copper producer is only marginally depending on these
metals for its rank. Of the top companies it is only Anglo American (which is weak in iron ore) that could be said to be truly diversified. Today of the top 15 companies six are more than 50 % iron ore producers, four are copper producers and three gold producers. In addition
i.e. what could be called a diversified producer.
4.3 Mergers and acquisitions
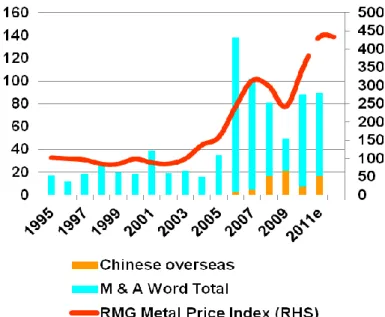
A wave of mining industry mergers and acquisitions (M&A) has been sweeping the world since the beginning of 2005 and has come back in 2010 with intensified force after the temporarily slow down in 2008/09. There are at present many rumours of potential new acquisitions as well as actual bids both friendly and hostile.
Since the mid 1990s there have been three crests on the M&A wave in the mining sector: in 1998, 2001 and the present one since 2005. The magnitude of the peaks is to some degree depending on a few mega-deals that inflate the dollar value for a specific year. The Billiton/BHP merger in 2001 together with the restructuring of De Beers and Anglo American in the same year is together valued at 25 billion US $ out of the total that year of 37 billion. In 1998 three deals were accounting for over 11 billion making that year a record one. If we look at the number of deals each year and exclude the deals below 10 millions the number is fairly constant at around 80 until the present new level was reached. Please see Table 2 below. The Chinese entrance into the global mining industry is much less dramatic than the impression one gets when reading the daily press. The Chinese share of the total M&A activities since 1995 is shown in Figure 7. Before 2005 the Chinese M&A activity outside of China was almost negligible. The Chinese domestic mining industry structure is fragmented both on the mine and the company level. There is no Chinese mining company among the Top 10 presented above. The most important Chinese mining company is Anshan Iron & Steel Co Ltd at rank number 39 and a controlled production value of 0.5 % or roughly a tenth of the largest companies. There is reportedly over 5 000 iron ore mines in China, even the largest ones produce only around 10 Mt annually and hence the production in the small mines is very small less than 0.1 Mt.
Year Buyer Share (%)
Target Target country Main metal Value MUS $ 2011 Barrick 100.0 Equinox Min Australia Copper, Gold 3200.0
Cliffs Nat Res 80.1 Cons Thompson Canada Iron ore 2314.3 Glencore 42.3 Kazzinc Kazakhstan Zinc 2070.0 Newmont Mining 100.0 Frontier Gold Canada Gold 1950.0 Bumi plc 75.0 Bumi Res Indonesia Zinc, Lead 1469.1 Japanese consortium 15.0 CBMM Brazil Niobium 1370.6 AuRico Gold 100.0 Northgate Canada Gold 1360.0 MMR 100.0 Anvil Mining Australia Copper 1344 Hanlong 81.0 Sundance Res Australia Iron ore 1338.3 JNMC 100.0 Metorex South Africa Copper 1042.5 Cliffs Nat Res 19.9 Cons Thompson Canada Iron ore 981.1 WTG 100.0 Century Mining USA Gold 746.6 Capstone 100.0 Far West Canada Copper 729.5 Gold Fields 18.9 Abosso Gold Ghana Gold 667.0 Newcrest 100.0 Lihir Gold Australia Gold 9000.0 Kinross Gold 90.6 Red Back Canada Gold 7100.0 2010 Uralkali UC 80.0 Silvinit Russia - 6400.0 Norsk Hydro 57.0 Alunorte Brazil Aluminium 5270.0 Vale 42.3 Fosfertil Brazil 3800.0 Trafigura 8.0 Norilsk Nickel Russia Nickel 3500.0 Goldcorp 100.0 Andean Res. Malaysia Gold 3494.5 Vale 51.0 Vale BSGR Guinea Iron ore 2500.0 Alacer Gold 100.0 Avoca Res Australia Gold 2000.0 Sumitomo Corp 30.0 MUSA Brazil Iron ore 1929.0 Batista fam 100.0 Ventana Canada Gold 1514.3 QuadraFNX 100.0 FNX Mining Canada Copper 1510.0 Shandong I&S 25.0 Tonkolili Sierra Leone Iron ore 1500.0 Uralkali UC 20.0 Silvinit Russia - 1400.0 Chinalco 47.0 Simandou Guinea Iron ore 1350.0