Comparing actual and self-reported measures of Facebook use
Reynol Junco
⇑Berkman Center for Internet and Society, Harvard University, 23 Everett Street, Cambridge, MA 02138, United States
a r t i c l e i n f o
Article history: Keywords: Facebook Criterion validity Measurement College students Researcha b s t r a c t
Numerous studies exist examining how college students use Facebook and how this affects aspects of their college experience; however, all of these studies have relied on self-report measures of Facebook use. Research in other areas of human behavior has shown that self-report measures are substantially inaccurate when compared to actual behaviors. This study provides the first test of the criterion validity of measures of Facebook frequency by comparing self-reported time spent on the site and number of logins against actual usage as measured by computer monitoring software. A sample of 45 college stu-dents installed software that monitored their computer usage for 1 month. There was a strong positive correlation between self-reported and actual time spent on Facebook; however, there was a significant discrepancy between the two. Students spent an average of 26 min (SD= 30) per day on Facebook, signif-icantly lower than the average of 145 (SD= 111) minutes per day obtained through self-report. There was a moderate relationship between number of logins and actual time spent on Facebook. Although there are some limitations of monitoring computer usage, researchers are encouraged to attempt to relate their self-report measures to actual behaviors in order to improve external validity.
!2012 Elsevier Ltd. All rights reserved.
1. Introduction
Social networking sites (SNSs) are popular online activities with 59% of Internet users reporting they use at least one (Hampton, Sessions Goulet, Rainie, & Purcell, 2011). Unquestionably, Facebook is the most popular social networking site in the United States. Of all social networking site users, 92% use Facebook (Hampton et al., 2011). In contrast, the next most popular SNS, Myspace is only used by 29% of all SNS users (Hampton et al., 2011). While Face-book is popular with all Internet users, it is even more so with col-lege students. Research shows that between 67% and 75% of college-aged adults used SNS (Jones & Fox, 2009; Lenhart, 2009; Lenhart, Purcell, Smith, & Zickuhr, 2010). An EDUCAUSE Center for Applied Research (ECAR) study found that 90% of college stu-dents used Facebook with a majority (58%) using it several times a day (Dahlstrom, de Boor, Grunwald, & Vockley, 2011). In large sample studies conducted at single institutions, 92% of students re-ported using Facebook and spending an average of over 1 h and 40 min a day on the site (Junco, 2012a, 2012b).
Because of its popularity with students, there has been a great deal of interest in studying outcomes of Facebook use in university populations. Researchers have examined how Facebook is related to various aspects of the college student experience including learning (Junco, 2012a; Kirschner & Karpinski, 2010; Kolek & Saunders, 2008; Pasek, More, & Hargittai, 2009), student
engagement (Junco, 2012b), multitasking (Junco, 2012c; Junco & Cotten, 2012), political activity (Vitak et al., 2011), life satisfaction, social trust, civic engagement, and political participation (Valenzuela, Park, & Kee, 2009), development of identity and peer relationships (Pempek, Yermolayeva, & Calvert, 2009), and relation-ship building and maintenance (Ellison, Steinfield, & Lampe, 2007, 2011; Valenzuela et al., 2009). Additionally, researchers have examined how Facebook use relates to personality variables such as scores on the big five personality dimensions of openness, con-scientiousness, extraversion, agreeableness, and neuroticism (Back et al., 2010; Ong, Ang, Ho, Lim, & Goh, 2011; Ross et al., 2009).
A major limitation of previous research is that Facebook use is exclusively assessed through self-report and no attempts have been made to evaluate the criterion validity of these measures. In other words, no study has yet to evaluate whether self-reported Facebook use is, in fact, related to actual use. Research in other areas of human behavior has found that there are significant differ-ences between self-reported and actual behaviors. For example, up to 50% of head and neck cancer patients who reported being non-smokers were actually smoking as determined by measurement of carbon monoxide in expired air and of blood levels of a nicotine metabolite (Hald, Overgaard, & Grau, 2003), self-reported mea-sures of physical activity underestimated health risk biomarkers by as much as 50% when compared to accelerometer measure-ments (Celis-Morales et al., 2012), and self-reported TV viewing time was underestimated by an average of 4.3 h per week when compared to data from a TV monitor (Otten, Littenberg, & Harvey-Berino, 2010).
0747-5632/$ - see front matter!2012 Elsevier Ltd. All rights reserved. http://dx.doi.org/10.1016/j.chb.2012.11.007
⇑ Tel.: +1 814 441 0339.
E-mail address:[email protected]
Contents lists available atSciVerse ScienceDirect
Computers in Human Behavior
Another limitation is that self-reported measures of frequency of Facebook use vary across studies. For instance, researchers have measured minutes per day on the site (Ellison et al., 2007, 2011; Junco, 2012a, 2012b; Kalpidou, Costin, & Morris, 2011; Kujath, 2011; Pempek et al., 2009; Ross et al., 2009), time spent on the site ‘‘yesterday’’ (Junco, 2012a, 2012b), number of logins to the site per day (Junco, 2012a, 2012b; Roblyer, McDaniel, Webb, Herman, & Witty, 2010), number of logins to the site ‘‘yesterday’’ (Junco, 2012a, 2012b), frequency of Facebook status updates per week (Ong et al., 2011), and a measure that combines total number of Facebook friends, minutes per day on Facebook over the last week, and emotional variables (such as ‘‘I would be sorry if Facebook shut down’’; Ellison et al., 2007, 2011; Valenzuela et al., 2009; Vitak et al., 2011).
Because there have been no studies of how well these measures capture actual use, it is unclear how much measurement error is introduced when evaluating outcomes of Facebook use. This is problematic because imprecise measurement can obfuscate how Facebook use is related to outcomes. For example, two of the afore-mentioned studies found that time on Facebook and number of lo-gins were differentially related to outcomes (Junco, 2012a, 2012b). This suggests that these two measures (time spent on the site and number of logins) are not evaluating the same thing (i.e., actual Facebook usage). As a result of the problems with self-report mea-sures, researchers do not yet have an accurate estimate of how much time students actually spend on Facebook.
1.1. Purpose of the study and research questions
There is a growing body of research examining how college stu-dents use Facebook and how this relates to various facets of their psychological, interpersonal, and developmental experiences (Back et al., 2010; Ellison et al., 2007, 2011; Junco, 2012a, 2012b, 2012c; Junco & Cotten, 2012; Kirschner & Karpinski, 2010; Kolek & Saun-ders, 2008; Ong et al., 2011; Pasek et al., 2009; Pempek et al., 2009; Ross et al., 2009; Valenzuela et al., 2009; Vitak et al., 2011). All of the published research relies on self-report measures of Facebook use. Therefore, this study uses a computer logging method to col-lect data on student use of Facebook in order to: (1) obtain a better estimate of the frequency of Facebook use in a college student pop-ulation and (2) relate self-report measures to actual use. Given the wide variability in measuring frequency of Facebook use in the lit-erature, data collected from this study will be able to inform future data collection methods. The research questions examined were:
Question 1: How much time do students actually spend on Face-book on their computer?
Question 2: What is the relationship between self-reported Face-book usage and actual usage as collected through monitoring software?
Given research in other areas showing that there are consider-able differences in self-reported and actual measures of behavior, it is expected that there will be a large difference between student self-report and actual use of Facebook.
2. Methods
2.1. Participants
A random sample (n= 640) of all (N= 1186) college students en-rolled for summer courses at a medium, 4-year, public, primarily residential institution in the Northeast was obtained through the institutional research office. Students were contacted through their on-campus email accounts and sent a link to a survey hosted on
SurveyMonkey.com, a commercial survey-hosting website. An additional reminder was sent a week after the first email. After completing the survey, students were asked to install software that monitors their computer activity. Participants were offered a $10 Amazon.com gift card as an incentive. A total of 110 surveys were completed for an overall response rate of 17%. Of the 110 students who completed the survey, 49 installed the monitor for a 45% par-ticipation rate. Four students dropped out of the study before the end of the month-long data collection period for a final sample size of 45. The survey data were downloaded as an SPSS file directly from SurveyMonkey, combined with data from the monitoring software, screened for anomalies, and analyzed using SPSS Statis-tics Version 19.
2.2. Instrument and measures 2.2.1. Self-report measures
To evaluate time spent on Facebook, students were asked: ‘‘On average, about how much time per day do you spend on the fol-lowing activities?’’ with a prompt for ‘‘Facebook’’. Students used a pull-down menu to select the hours and minutes spent using Facebook. In order to evaluate patterns in self-reported and actual usage, students were also provided prompts for ‘‘Twitter’’, ‘‘Email’’, and ‘‘Searching for information online’’. The hours and minutes spent using Facebook and the other technologies were converted to minutes for these analyses. Students were also provided a prompt to enter the hours and minutes they spent ‘‘Using cell phone to go online’’. Again, the hours and minutes were converted to minutes for these analyses. To evaluate number of logins to Facebook per day, students were asked: ‘‘On average, how many times per day do you check Facebook?’’ Respondents were permit-ted to input a number of their choosing in a blank field. Demo-graphic information was obtained from the university’s institutional research office. Parental education (a proxy for socio-economic status) was evaluated by asking students ‘‘What is the highest level of formal education obtained by your parents?’’ with prompts for ‘‘Parent/Guardian 1’’ and ‘‘Parent/Guardian 2’’. Paren-tal education items were coded using a five-point Likert scale with options for ‘‘Less than high school degree’’; ‘‘High school degree’’; ‘‘Some college’’; ‘‘College graduate (for example: B.A., B.S., B.S.E)’’; and ‘‘Advanced graduate (for example: master’s, professional, J.D., M.B.A, Ph.D., M.D., Ed.D.)’’.
2.2.2. Monitoring software
Upon completing the survey, students were provided a link to download an application that monitored their computer use for 1 month. Once installed, the students were unable to remove the software from their computer until the end of the monitoring per-iod. The monitoring software was developed in order to help employers evaluate how employees are using their computer time. The software runs in the background and measures which applica-tion, website, or document is being used. Specifically, it only mea-sures active time spent on the current window. After two minutes of idle time (when no mouse movement or keyboard activity is de-tected), the software stops logging and does not add those two minutes to the active time count for that window. The data col-lected by the software were automatically uploaded to a central server where only the researcher had access to the monitoring data. The number of seconds each student spent actively using Facebook was downloaded from the server and then converted to average minutes per day. Additionally, the number of seconds each student spent actively using Twitter, email, and search engines was downloaded from the server and then converted to average min-utes per day. Lastly, the number of seconds that students spent using the computer was downloaded and converted to average minutes per day.
2.3. Data analyses
Descriptive statistics were run to illustrate the demographic characteristics of the sample, to describe overall computer use, and to describe actual and self-reported Facebook, Twitter, email, and search engine use. Because students might also use their mo-bile devices to access Facebook, descriptive statistics were run to illustrate how much time students spent going online with their mobile phones. Correlations were examined to evaluate the rela-tionships between actual and self-reported Facebook, Twitter, email, and search engine use. To examine the relationship between mobile and computer use, correlations between self-reported time spent using cell phones to go online, self-reported time spent on Facebook, and actual time spent on Facebook were conducted. In order to explore whether differences in self-reported and actual use could be accounted for by mobile use, a variable was created subtracting the sum of self-reported time spent on Facebook, Twit-ter, email, and search engines from actual time spent on these technologies. This variable (self-reported time unexplained by the computer use monitor) was then correlated with self-reported time spent using cell phones to go online. The SPSS curve estima-tion procedure was used to test whether the relaestima-tionships between actual and self-reported use met the assumption of linearity neces-sary for correlation. Paired samplet-tests were conducted in order to test the difference between actual and self-reported Facebook, Twitter, email, and search engine use. A paired samplet-test was also conducted to evaluate the difference between self-reported time unexplained by the computer use monitor and time spent using cell phones to go online.
3. Results
3.1. Descriptive statistics 3.1.1. Demographics
Seventy-three percent of the participants were female. The mean age of the participants was 28 (SD= 10). The age of partici-pants ranged from 18 to 51, though 62% were between 18 and 24 years old. Twenty-six percent of students in the sample were first year students, 19% were sophomores, 14% were juniors and 40% were seniors. Highest educational level attained by either par-ent was as follows: 35% had a high school degree or less, 28% com-pleted some college, 23% were college graduates and 14% had a graduate degree. In terms of race and ethnicity, the sample was overwhelmingly Caucasian, with 89% of students listing that as their race. Additionally, 5% of the sample was African American, 5% were Latino, 2% were Asian American, 2% were Native American, and 2% identified as ‘‘other’’. The gender, race, and ethnic charac-teristics of the sample were similar to that of the population of en-rolled summer students, excepting an overrepresentation of women in this sample. Furthermore, the demographic characteris-tics of the population of enrolled summer students was similar to that over the overall university population, excepting a slight over-representation of women in the summer population.
Since not all students who completed the survey installed the monitoring software, analyses were conducted to test whether there were differences in background characteristics along the variables of interest between those who installed the software and those who did not. Pearson’s chi-square and independent-samplest-tests indicated that there were no differences between students who installed the software and those who did not on gen-der (
v
2(1,101) = .557,p> .3), ethnicity (v
2(1,101) = .010,p> .6), race (v
2(5,101) = 4.278,p> .5), self-reported time spent on Face-book (t(103) = .33,p> .6), and self-reported time spent using cell phones to go online (t(103) = .45, p> .9); however, anindepen-dent-samplest-test indicated that students who installed the soft-ware reported significantly more Facebook logins per day (M= 7,
SD= 10.8) than those who did not install the software (M= 4.7,
SD= 4.7),t(98) = 1.47,p< .05, Cohen’sd= .28.
3.1.2. Technology use
Students reported spending an average of 145 min (Mdn= 120,
SD= 111) per day on Facebook. They also reported checking Face-book an average of 7 times (Mdn= 4,SD= 11) per day. Students re-ported spending an average of 73 min (Mdn= 61,SD= 59) per day using Twitter, 114 min (Mdn= 120,SD= 106) per day using email, and 167 min (Mdn= 180,SD= 106) per day searching for informa-tion. Lastly, students reported spending 117 min (Mdn= 91,
SD= 119) per day using their cell phones to go online. Data col-lected from the monitoring software showed that students spent an average of 123 min (Mdn= 115,SD= 67) per day using the com-puter and 26 min (Mdn= 14,SD= 30) per day on Facebook. There-fore, students spent an average of 21% of the total time they were on their computers using Facebook. The monitoring software also showed that students spent an average of 4 min (Mdn= 1,SD= 6) per day using Twitter, 6 min (Mdn= 3,SD= 10) per day using email, and 4 min (Mdn= 3,SD= 3) per day searching for information.
3.2. Correlations
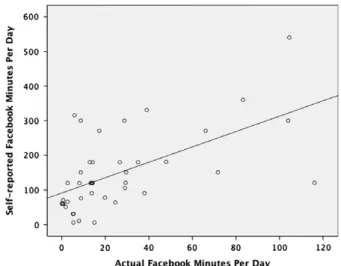
Curve estimation was used to compare linear, quadratic, and logarithmic models for the relationships between self-reported and actual Facebook, Twitter, email, and search engine use as well as self-reported number of Facebook logins and actual Facebook use. The results revealed that a linear model was most appropriate for these relationships. As can be seen inFig. 1, there was a strong positive correlation between self-reported and actual time spent on Facebook (Pearson’sr= .587,p< .001). The correlation between self-reported number of logins and actual time spent on Facebook was also significant (Pearson’sr= .368,p< .05). Furthermore, the correlations between self-reported and actual time spent on Twit-ter (Pearson’sr= .866,p< .001), email (Pearson’sr= .628,p< .001), and search (Pearson’sr= .335,p< .05) were significant. The corre-lations between self-reported time spent using cell phones to go online and self-reported time spent on Facebook (Pearson’s
r= .020,p> .9) as well as actual time spent on Facebook (Pearson’s
r=!.155,p> .3) were not significant. Lastly, the correlation be-tween self-reported time spent using cell phones to go online
Fig. 1.Scatterplot of self-reported and actual time spent on Facebook. The interpolation line corresponds to anR2of .345.
and self-reported time unexplained by the computer use monitor was not significant (Pearson’sr= .184,p> .2).
3.3. Paired sample t-tests
A paired-samplet-test indicated that self-reported time spent on Facebook (M= 149,SD= 114) was significantly higher than ac-tual time spent on Facebook (M= 26, SD= 30), t(41) = 8.068,
p< .001, Cohen’sd= 1.5. The same pattern was observed for the other technologies with self-reported time spent on Twitter (M= 104,SD= 92) being significantly higher than actual time spent on Twitter (M= 4,SD= 6),t(14) = 4.424,p< .001, Cohen’sd= 1.5; self-reported time spent using email (M= 113,SD= 107) being sig-nificantly higher than actual time on email (M= 6, SD= 10),
t(43) = 6.984, p< .001, Cohen’s d= 1.4; and self-reported time spent searching for information (M= 167,SD= 106) being signifi-cantly higher than actual time spent searching for information (M= 4, SD= 3), t(44) = 10.404, p< .001, Cohen’s d= 2.2. Lastly, self-reported time unexplained by the computer use monitor (M= 464, SD= 256) was significantly higher than self-reported time spent using cell phones to go online (M= 117, SD= 119),
t(44) = 8.878,p< .001, Cohen’sd= 1.7.
4. Discussion
4.1. Research questions
4.1.1. Question 1: How much time do students actually spend on Facebook on their computer?
Data from the monitoring software showed that students in this sample spent an average of 26 min (SD= 30) per day on Facebook, which corresponded to 21% of the total time that they spent using their computers. This estimate is very different than the averages of over 100 min per day and over 75 min ‘‘yesterday’’ reported by Junco (2012a, 2012b). Moreover, Ross et al. (2009) found that 79% of their sample reported spending between ‘‘10 and 60 min on Facebook daily’’ (p. 581) whileEllison et al. (2007)’s sample re-ported spending between 10 and 30 min each day. Even though the approximate ranges fall within the results of the current study, the Ross et al. (2009)andEllison et al. (2007)estimates were based on questions with categorical choices. Facebook frequency of use questions with categorical choices may reflect the researcher’s a prioribiased estimate of the distribution of time spent on the site. Furthermore, categorical choices may artificially truncate variance in ways that reduce measurement precision. Providing such a non-specific range makes it difficult to evaluate against other studies and poses problems of accuracy when conducting multivariate sta-tistical models.
The estimates fromPempek et al. (2009)were most congruent with those found in the current study.Pempek et al. (2009)asked students to log their daily time spent on Facebook in a diary they were asked to keep for a 1-week period. The researchers found that students reported spending an average of 27.93 min per day on weekdays and 28.44 min per day on weekends. However, data from thePempek et al. (2009), Ellison et al. (2007)andRoss et al. (2009) studies are several years old and estimates of Facebook use have generally increased since. In addition to the estimates of around 100 min per day in the studies by Junco (2012a, 2012b), a newer study byEllison et al. (2011)found that students reported using Facebook 81.4 min each day. Another recent study by Kalpidou et al. (2011)found that students spent 60–120 min per day on the site. Although estimates of use have mostly in-creased, standard deviations of reported time have remained large. For instance,Pempek et al. (2009) found that there was a large standard deviation in usage estimates for weekdays (SD= 19.43)
and weekends (SD= 23.69) whileJunco (2012a, 2012b)found stan-dard deviations of over 90 and Kujath (2011)found a standard deviation of 77 for minutes per day. The large variability in Face-book use discovered with monitoring software suggests that data from other studies showing high standard deviations may be reflecting an important underlying pattern—that Facebook use var-ies widely within the population of college students.
4.1.2. Question 2: What is the relationship between self-reported Facebook usage and actual usage as collected through monitoring software?
Even though there was a significant correlation between self-re-ported Facebook usage and actual usage, a paired sample t-test found that students significantly overestimated their time spent on Facebook by an average factor of five. The results showed a sim-ilar pattern with other technologies: the self-reported and actual usage measures were significantly correlated; however, t-tests showed that students significantly overestimated their time spent using Twitter, email, and search engines. These findings pose a compelling contradiction—students are not able to estimate their actual Facebook usage well, yet they are able to provide estimates that are consistent. In other words, students who reported spend-ing more time on Facebook actually spent more time on the site than students who reported lower estimates even though they vastly overestimated their Facebook time.
Students overestimated the time they spent on Facebook by an average of 2 h per day. Put another way, even though students re-ported spending about 2½h per day, they were actually spending an average of 3 h per week on Facebook. There are a number of possibilities for this discrepancy:
(1)Self-report questions lack necessary specificity. The question in this study asked students ‘‘On average, about how much time per day do you spend on the following activities?’’ with a prompt for ‘‘Facebook’’. Students may have interpreted this to mean both inactive and active time on the site, thereby inflating their self-reported estimates. Students may also have provided estimates by considering the amount of time they were thinking about Facebook. In this sense, ‘‘how much time per day do you spend on’’ may have been inter-preted to mean ‘‘how much time does Facebook have your attention each day?’’ The author conducted an informalpost hocfocus group with undergraduate and graduate interns at a research center at another university to discuss these results. Students in the focus group reported that they think about Facebook ‘‘all the time’’ and stated that they would factor this into their estimate when answering the survey question.
(2)Students harbor implicit theories about technology use. Harbor-ing implicit theories is a common source of method variance in research (Podsakoff, MacKenzie, Lee, & Podsakoff, 2003). In this particular instance, students are told (by the popular media, parents, educators, etc.) that they spend a lot of time on Facebook and have the implicit theory that ‘‘people my age use Facebook a lot’’. Such an implicit theory would lead students to give inflated estimates of their actual time spent on Facebook.
(3)Accessing Facebook from multiple devices. The monitoring software used in this study only captured time spent on Facebook while on one computer. It is possible that students are accessing Facebook a great deal using their mobile devices. Indeed, students reported spending an average of almost 2 h per day using their cell phones to go online. The discrepancy between self-reported and actual Facebook use was 2 h per day; it could be that students are spending those 2 h using Facebook from their mobile devices in which
case, their estimates may be more precise. However, the cor-relations between both self-reported and actual Facebook use and time spent going online with cell phones were not significant showing a departure from the pattern of correla-tions between self-reported and actual use of the technolo-gies measured. Additionally, the correlation and t-test between self-reported time unexplained by the computer use monitor and self-reported time spent using cell phones to go online suggest that cell phone use cannot account for the overestimation in time spent using Facebook, Twitter, email, and search engines. Specifically, there were 347 min of self-reported use that were left unaccounted for when fac-toring in time captured by the computer monitor and time using cell phones to go online. Therefore, students may either not be using their cell phones to check Facebook or are not able to accurately estimate the time they spend online using their phones. Furthermore, it is possible that students accessed Facebook from multiple computers, which would have provided a lower estimate of actual time spent on the site. Future research will want to attempt to capture time spent using Facebook on mobile devices as well as on multiple computers.
(4) Students are unable to estimate Facebook usage. It is possible that students are unable to estimate the amount of time they spend on online activities. In this study, students were unable to estimate their actual usage across various technol-ogies. This could be a function of how humans have devel-oped schemas about technology use. For instance, drivers often estimate driving distances in miles and time to desti-nation; however, Internet users typically do not estimate frequency and intensity of use in time. It might be because of the ubiquitous nature of online pursuits—the Internet is used during the workday, for recreational activities, and/or for research so much that keeping tabs on frequency of use would be excessively taxing.
Despite the fact that there was a large discrepancy between self-reported and actual Facebook use, there was a strong positive correlation between the two. In fact, the proportion of the variance shared between self-reported and actual time spent on Facebook was 34.5% (seeFig. 1). That statistic suggests that the self-report measure consistently captures a facet of Facebook use. Moreover, it also suggests that students are able to estimate their Facebook usage to some degree. So while the discrepancy between the two is large and significant, a self-report measure of time spent on Facebookcanbe useful in estimating actual time spent on the site. Even though the self-report measure is limited, it is possible that future extensions of this kind of research might help researchers create a ‘‘correction factor’’ for self-reported Facebook use.
There was also a moderate positive correlation between self-re-ported number of logins to Facebook and actual time spent on Facebook with the two variables sharing 14% of the variance. While not as strongly related to actual Facebook use as the question about time, number of logins can also be useful in estimating ac-tual time on the site. However, the weaker relationship between logins and actual use raises some questions about what is being measured. In two other studies,Junco (2012a, 2012b)found that time on Facebook and number of logins were differentially related to academic outcomes. The results of the current study and of Jun-co’s (2012a)study suggest that questions evaluating self-reported number of Facebook logins may be measuring something other than actual Facebook use. One possibility is that students are log-ging in to Facebook multiple times and only checking for short periods of time asJunco’s (2012a)data suggest. These issues make evaluating relationships between self-reported Facebook use and other variables problematic.
4.2. Limitations
A principal limitation of this study was the possibility that stu-dents who chose to install the software had unmeasured character-istics that they did not share with those who declined to participate and that these characteristics might have influenced Facebook use. In this study, there were no differences between stu-dents who chose to install the monitoring software and those who didn’t on demographic variables and on the variables of interest with one exception: self-reported number of logins to Facebook. Given that self-reported number of logins was only moderately re-lated to actual Facebook use, this question might actually tap into another variable that is related to willingness to participate in such a study. Certainly, future research will want to test whether other variables are related to student willingness to allow researchers to monitor their computer activity. It is hypothesized that there might be differences in student Internet skills and personality vari-ables (such as agreeableness and openness) between those who choose to allow to be monitored and those who do not. Internet skills and personality variables could also influence how much time students choose to spend on Facebook (as well as other Inter-net activities).
Another limitation of this study is the possibility of observer ef-fects or that students behaved differently because they knew their Internet activities were being monitored. One of the more common manifestations of observer effects in psychology is theHawthorne effect, which suggests that research participants will change their behavior when they know they are being observed (Mayo, 1945). In the current study, students who were being monitored may not have used the Internet and Facebook in the same ways as when they were not being monitored. It is also possible that students who were being monitored spent more time using devices other than the computer with the monitoring software in order to cir-cumvent being tracked. A strategy used to mitigate this in the cur-rent study was to monitor students for a full month; however, future research may want to collect additional data, possibly via fo-cus groups, to evaluate whether computer use during the study period was reflective of typical computer use.
A related limitation was the possibility that students used other devices to access their Facebook account not to circumvent the monitor, but as part of their regular pattern of technology use. Re-search by the Pew Internet and American Life Project found that 63% of undergraduate cell phone owners used their devices to go online (Smith, Rainie, & Zickuhr, 2011). Additionally, research by Nielsen (2011)found that 60% of smartphone owners use SNS apps with Facebook being the most popular one. Therefore, it is possible that monitoring student computer activity might miss capturing all of the time they spend on Facebook. Future research will want to examine ways to collect data not only from computers but from mobile devices as well.
Lastly, though the sample was representative of enrolled sum-mer students (and the enrolled sumsum-mer students were represen-tative of the overall university population), the online activities in which students engage in during summer sessions might be different. At the university where the study was conducted, a typ-ical academic year lasts for two semesters with the summer semester regarded as optional. Students typically do not carry as heavy of a class load in the summer giving them more free time for recreational pursuits. Therefore, it is possible that students in this study did not spend the same amount of time on Facebook as they would during the regular academic year. Because the sum-mer allows for more free time, students may have either spent more time on Facebook to fill that free time or less because their same-aged peers were more engaged in offline pursuits and not engaging them on Facebook as much as during the regular aca-demic year.
5. Conclusion
The results of this study reveal that self-report measures of Face-book use canapproximatebut are notaccuratemeasures of actual use. Data collected from a computer monitor demonstrated that students used Facebook a great deal; however, not as much as has been reported in other studies. The discrepancies between current data on actual use and data from other research are due to the fact that other studies used self-report estimates. This inconsistency be-tween self-reported and actual measurements will obfuscate how Facebook use is related to outcomes, signaling a problem for re-search relying on self-report measures. An additional issue to con-sider in research examining outcomes of Facebook use is that there is great variability in the amount of time students spend on the site. This variability may also impact the relationship between Facebook use and outcomes especially when appropriate statistics are not performed (i.e., choosing appropriate measures of central tendency and conducting data transformations).
As there is growing interest in researching the psychosocial ef-fects of Facebook use, it is important for future research to come up with measurement methods that are both accurate and useful. Inaccurate measurement negatively affects not only the criterion validity of the measure, but also the external validity of the study. Therefore, researchers are encouraged to create survey questions that are specific (such as ‘‘how much time do you spend per day ac-tively using Facebook on your computer?’’) and to attempt to col-lect data to measure the criterion validity of these questions. The results of this study have shown that time spent on Facebook and number of logins are not accurate estimators of actual Facebook use. Given there is no agreed-upon measure of frequency of Face-book use in the literature, future research may want to evaluate all of the measures used and make recommendations about stan-dardized questions that more accurately capture Facebook usage.
Acknowledgements
The author would like to thank the blind reviewers of this paper for their insightful feedback and suggestions. I am especially grate-ful to Urs Gasser and Sandra Cortesi, the Harvard Berkman Center Youth and Media project team, and the Youth and Media Lab sum-mer 2012 interns (‘‘Berkterns’’) for their invaluable input on the preliminary results from this study. The author is appreciative of Doc Searls’ help in selecting the computer monitoring software used in the study.
References
Back, M. D., Stopfer, J. M., Vazire, S., Gaddis, S., Schmukle, S. C., Egloff, B., et al. (2010). Facebook profiles reflect actual personality, not self-idealization. Psychological Science : A Journal of the American Psychological Society/APS, 21(3), 372–374.
Celis-Morales, C. A., Perez-Bravo, F., Ibañez, L., Salas, C., Bailey, M. E. S., & Gill, J. M. R. (2012). Objective vs. self-reported physical activity and sedentary time: Effects of measurement method on relationships with risk biomarkers.PLoS ONE, 7(5), e36345.http://dx.doi.org/10.1371/journal.pone.0036345.
Dahlstrom, E., de Boor, T., Grunwald, P., & Vockley, M. (2011). ECAR national study of undergraduate students and information technology, 2011. <http:// net.educause.edu/ir/library/pdf/ERS1103/ERS1103W.pdf> Retrieved 6.11.12. Ellison, N. B., Steinfield, C., & Lampe, C. (2011). Connection strategies: social capital
implications of Facebook-enabled communication practices. New Media & Society.http://dx.doi.org/10.1177/1461444810385389.
Ellison, N. B., Steinfield, C., & Lampe, C. (2007). The benefits of Facebook ‘‘friends:’’ social capital and college students’ use of online social network sites.Journal of Computer-Mediated Communication, 12(4), 1143–1168.
Hald, J., Overgaard, J., & Grau, C. (2003). Evaluation of objective measures of smoking status—A prospective clinical study in a group of head and neck cancer patients treated with radiotherapy.Acta Oncologica, 42(2), 154–159. Hampton, K., Sessions Goulet, L., Rainie, L., & Purcell, K. (2011).Social networking
sites and our lives. Washington, DC: Pew Internet and American Life Project. <http://pewinternet.org/Reports/2011/Technology-and-social-networks.aspx> Retrieved 15.07.12.
Jones, S., & Fox, S. (2009).Generations online in 2009. Data memo. Washington, DC: Pew Internet and American Life Project. <http://pewinternet.org/Reports/2009/ Generations-Online-in-2009.aspx> Retrieved 11.28.12.
Junco, R. (2012a). Too much face and not enough books: The relationship between multiple indices of Facebook use and academic performance.Computers in Human Behavior, 28(1), 187–198.
Junco, R. (2012b). The relationship between frequency of Facebook use, participation in Facebook activities, and student engagement. Computers & Education, 58(1), 162–171.
Junco, R. (2012c). In-class multitasking and academic performance.Computers in Human Behavior.http://dx.doi.org/10.1016/j.chb.2012.06.031.
Junco, R., & Cotten, S. R. (2012). No A 4 U: The relationship between multitasking and academic performance.Computers & Education, 59(2), 505–514. Kalpidou, M., Costin, D., & Morris, J. (2011). The relationship between Facebook and
the well-being of undergraduate college students.Cyberpsychology, Behavior and Social Networking, 14(4), 183–189.
Kirschner, P. A., & Karpinski, A. C. (2010). Facebook and academic performance. Computers in Human Behavior, 26, 1237–1245.
Kolek, E. A., & Saunders, D. (2008). Online disclosure: An empirical examination of undergraduate Facebook profiles.NASPA Journal, 45(1), 1–25.
Kujath, C. L. (2011). Facebook and MySpace. Complement or substitute for face-to-face interaction? Cyberpsychology, Behavior, and Social Networking, 14(1–2), 75–78.
Lenhart, A. (2009).Adults and social network websites. Washington, DC: Pew Internet and American Life Project. <http://www.pewinternet.org/Reports/2009/Adults-and-Social-Network-Websites.aspx> Retrieved 11.28.12.
Lenhart, A., Purcell, K., Smith, A., & Zickuhr, K. (2010).Social media and young adults. Washington, DC: Pew Internet and American Life Project. <http://pewinternet. org/Reports/2010/Social-Media-and-Young-Adults.aspx> Retrieved 11.28.12. Mayo, E. (1945).The social problems of an industrial civilization. Boston: Harvard
University.
Nielsen (2011). State of the media: the social media report, Q3. <http:// www.nielsen.com/content/corporate/us/en/insights/reports-downloads/2011/ social-media-report-q3.html> Retrieved 15.07.12.
Ong, E., Ang, R., Ho, J., Lim, J., & Goh, D. (2011). Narcissism, extraversion, and adolescent’s self-presentation on Facebook. Personality and Individual Differences, 50, 180–185.
Otten, J. J., Littenberg, B., & Harvey-Berino, J. R. (2010). Relationship between self-report and an objective measure of television-viewing time in adults.Obesity, 18(6), 1273–1275.
Pasek, J., More, E., & Hargittai, E. (2009). Facebook and academic performance. Reconciling a media sensation with data.First Monday, 14(5).
Pempek, T. A., Yermolayeva, Y. A., & Calvert, S. L. (2009). College students’ social networking experiences on Facebook. Journal of Applied Developmental Psychology, 30(3), 227–238.
Podsakoff, P. M., MacKenzie, S. B., Lee, J.-Y., & Podsakoff, N. P. (2003). Common method biases in behavioral research: a critical review of the literature and recommended remedies.The Journal of Applied Psychology, 88(5), 879–903. Roblyer, M. D., McDaniel, M., Webb, M., Herman, J., & Witty, J. V. (2010). Findings on
Facebook in higher education: a comparison of college faculty and student uses and perceptions of social networking sites.The Internet and Higher Education, 13, 134–140.
Ross, C., Orr, E. S., Sisic, M., Arseneault, J. M., Simmering, M. G., & Orr, R. R. (2009). Personality and motivations associated with Facebook use.Computers in Human Behavior, 25(2), 578–586.
Smith, A., Rainie, L., & Zickuhr, K. (2011). College students and technology. Washington, DC: Pew Internet and American Life Project. <http://www. pewinternet.org/Reports/2011/College-students-and-technology.aspx> Retrieved 15.07.12.
Valenzuela, S., Park, N., & Kee, K. F. (2009). Is there social capital in a social network site?: Facebook use and college students’ life satisfaction, trust, and participation.Journal of Computer-Mediated Communication, 14(4), 875–901. Vitak, J., Zube, P., Smock, A., Carr, C. T., Ellison, N., & Lampe, C. (2011). It’s
complicated: Facebook users’ political participation in the 2008 election. Cyberpsychology, Behavior and Social Networking, 14(3), 107–114.